About
Randy Krum
President of InfoNewt.
Data Visualization and Infographic Design

Infographic Design

Infographics Design | Presentations
Consulting | Data Visualizations

DFW DataViz Meetup

Join the DFW Data Visualization and Infographics Meetup Group if you're in the Dallas/Fort Worth area!

Search the Cool Infographics site

Custom Search

Subscriptions:


Feedburner

The Cool Infographics® Gallery:

How to add the
Cool Infographics button to your:

Cool Infographics iOS icon

- iPhone
- iPad
- iPod Touch


Read on Flipboard for iPad and iPhone

Featured in the Tech & Science category

Flipboard icon

Twitter Feed
From the Bookstore

Caffeine Poster

The Caffeine Poster infographic

Entries in instructional (3)

Wednesday
Oct212015

How To Make Your Movies Better

How To Make Your Movies Better infographic

How to Make Your Movies Better is a great infographic from Moviehouse Eatery, which is a new movie theater concept in Texas.

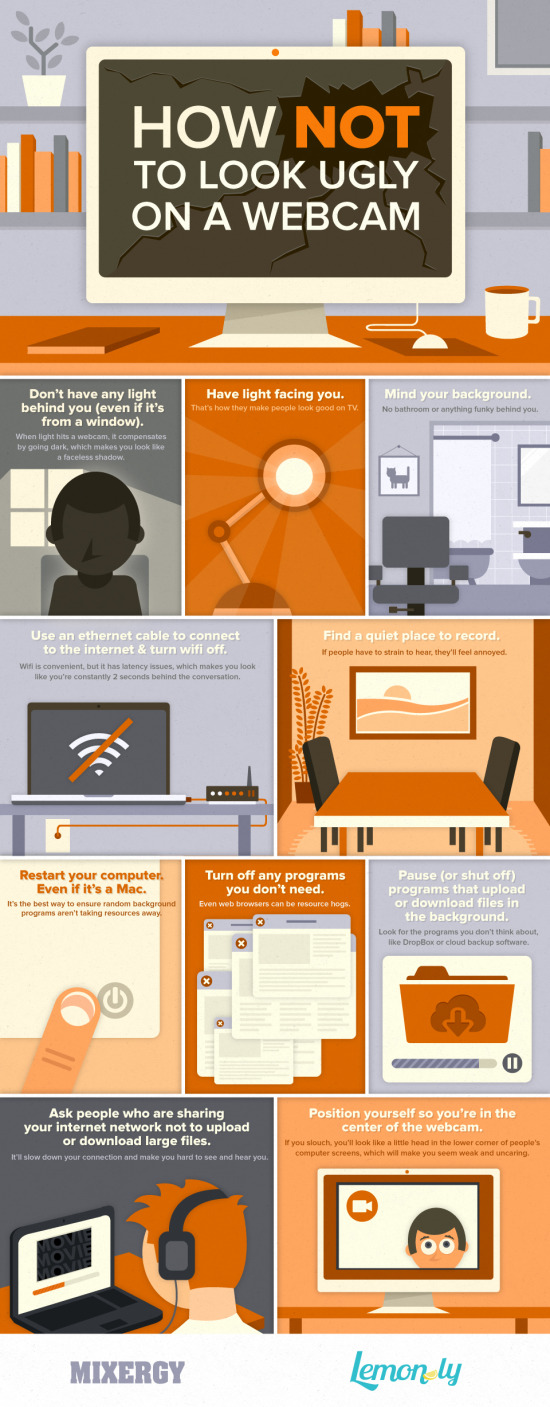
This is a fantastic use of an infographic, to show the simple step-by-step process of buying tickets and going to the movies. Using infographics as how-to information about your products and services is a highly effective way to communicate directly to your customers.

Notice how the simple design makes the overall process feel easy before you even start to read any of the instructions. It's not cluttered with a lot of text, which keeps this design easy to read.

I would recommend making the overall length of the infographic shorter. This one includes large illustrations, nicely spaced out, but the length can be intimidating. I would keep the content the same, but make the illustrations smaller to reduce the length.

Also, the footer should include a copyright (or Creative Commons) license statement, and the URL to the infographic landing page so readers can find the original, full-size version.

Monday
Nov252013

How NOT To Look Ugly on a Webcam

How NOT To Look Ugly on a Webcam infographic

How NOT To Look Ugly on a Webcam from Mixergy and Lemon.ly lays out the top 10 tips for successfully using your webcam.

No matter who you are and how good you look, it’s pretty easy to look terrible on a webcam. We teamed up with our friends at Mixergy to showcase just how NOT to look bad on a webcam with this handy infographic. By just following a few of our easy webcam tips, you’ll look as good as you feel in your next webcam interview. What do you think? Have any other tricks to add?

Nice instructional how-to infographic.  There’s no data visualized, just illustrations of the 10 tips.  Quick and easy to read.  This design also has a long Online Lifespan.  The topic is so universal, the infographic will be relevant for years!

The footer should include the text URL link to the infographic landing page on either Mixergy or Lemon.ly so when readers see smaller thumbnail versions posted on Facebook, Pinterest, Twitter, Google+ or blogs without a link, they can still find the original full-size version!

Thanks to @jasongaloob on Twitter for the link!


And Guy Kawasaki on Facebook:

Friday
May112012

Backpacking Basics

How to choose and use a backpack infographic 

Everyone loves the great outdoors! Well… until something doesn’t go as planned… With the informative How to Choose & Use a Backpack infographic from REI, enjoying roughing it without having to, you know, rough it.

Need a break from the daily multitasking merry-go-round? Trade in your digital devices for boots and backpacks—they’re your ticket to off-the-grid adventures and the wonders of the backcountry! With the right pack and a little preparation, you can head out for a day hike or a through-hike and say “CUL8R” to the daily grind. 

Many consumer products have an educational piece to them, and the challenge for a retailer is to educate their customers without feeling like a hard-sell ad.  This infographic does a great job of educating and informing their audience without listing available products, brands or any pricing.  It’s just purely informative, and adds to REI’s brand credibility.

The design is a little text-heavy for my taste, but it’s packed with information.  Some of the data in the text of the design could also have been visualized to make it easier for the reader to comprehend.  Weight ranges, lengths and the number of items that fit in the backpack would have been great visuals.

I don’t mind the URL link to the REI Backpack products page, but there should also be the URL to the original infographic landing page.  When people share this online with their firends as an informative piece, they will want to share the infographic URL.  There should also be a copyright statement at the bottom.

Thanks to Ron for sending in the link!