About
Randy Krum
President of InfoNewt.
Data Visualization and Infographic Design

Infographic Design

Infographics Design | Presentations
Consulting | Data Visualizations

DFW DataViz Meetup

Join the DFW Data Visualization and Infographics Meetup Group if you're in the Dallas/Fort Worth area!

Search the Cool Infographics site

Custom Search

Subscriptions:


Feedburner

The Cool Infographics® Gallery:

How to add the
Cool Infographics button to your:

Cool Infographics iOS icon

- iPhone
- iPad
- iPod Touch


Read on Flipboard for iPad and iPhone

Featured in the Tech & Science category

Flipboard icon

Twitter Feed
From the Bookstore

Caffeine Poster

The Caffeine Poster infographic

Entries in medical (18)

Tuesday
May142013

Bike To Work Week

Bike to Work Week infographic

This week is bike to work week. Why should you participate? The Bike to Work Week infographic from Fitness for Weight Loss explains the health benefits of participating as well as cost benefits!

Bike to Work Week is May 13th – 17th, 2013.

Thanks to Stephanie for sending in the link!

Friday
Jan042013

Cancer in the U.S.A.

Cancer in the USA infographic


The Cancer in the US infographic addresses the current state of the country with its fight against cancer. MesotheliomaHelp.net created this infographic to inspire people to donate to help find the cure of cancer. Find an organization you would like to donate to here.
MesotheliomaHelp.net is dedicated to fighting cancer and providing helpful resources to mesothelioma patients and their caregivers. The purpose of this infographic is to share importance of us focusing on a cure for cancer and asking people to support the organizations that are working hard to find one. Please go to http://www.mesotheliomahelp.net/beat-cancer to donate to your favorite cancer charity today! 

I really like this design style and color scheme.  It keeps a serious tone overall to go with the serious topic, the visuals are simple and clear, and the story path is easy to read from top-to-bottom.  The light gray paper backgound texture also provides clear boundaries to the infographic when displayed on a white background (like this blog).  The lined up person icons to represent “1,500 people die each day” would be easier to understand with ten icons in each row.  

I like idea behind the icons and the stacked grids of squares in “Cases of Cancer by Type”, but I’m unclear as to the values being visualized.  It appears to be the percentage of deaths of of the total cases of each type of cancer, but that percentage value isn’t shown anywhere.  The rows of squares should also be ten squares across to make the visualization easier to understand.

The “Mortality from Cancer” visualization is a basic line chart, but that visual does such a great job of telling the story of the overall trend over time.  I think this particular section should have been bigger, since that data is so impressive.

The footer should include a copyright statement, and the URL to the original, full-size infographic on the MesotheliomaHelp.net site.

Thanks to Oakes for sending in the link! 

Monday
Dec312012

Water Changes Everything

I have heard it argued that clean water has been the single greatest medical advancement in mankind’s history.  With effects including longer lifespan, reducing diseases, reducing birth defects and generally improving health, it’s easy to undertand how important clean water is.  Water Changes Everything is an infographic promotional for the Charity Water organization.

I’ve started the “Start 2013 Clean” campaign to raise $1,000 for Charity Water from Cool Infographics readers.  Start off 2013 right, and help me support making the world a better place.

Almost a billion people live without clean drinking water. We call this the water crisis. It’s a crisis because it only starts with water — but water affects everything in life.

Health. Education. Food security. And the lives of women and children, especially.

We can end the water crisis in our lifetime. But first we have to let everyone know it’s happening. Learn how water changes everything — and share this with everyone you know. 

It was an infographic map design by John Snow in 1854 that led to the discovery that a cholera outbreak in Soho, London was geographically tied to the location of a water well.  At the time, the popular belief was that cholera was airborne, and people would become sick by breathing “bad air.”  But John Snow’s early data visualization of reported cases was used to convince local officals to shut down the potentially contaminated well (by removing the handle).  This action is commonly credited with ending the epidemic.

Original map made by John Snow in 1854. Cholera cases are highlighted in black.

Video was designed by Jonathan Jarvis, who also designed the Crisis of Credit infographic video, and the voiceover is Kristen Bell.

Found on Daily Infographic and FastCoDesign

Thursday
Dec272012

Blood Pressure: Know Your Numbers


Blood Pressure: Know Your Numbers infographic

Being knowledgeable about your health is always helpful. Your blood pressure is no exception, 1/3 people who have strokes die because of high blood pressure. The Blood Pressure infographic created by westfieldhealth.com describes what blood pressure is, what it means, and then how to maintain a healthy blood pressure. The infographic was found on behance.net.

High blood pressure puts strain on your heart and increases your likelihood of developing health problems in the future. It is one of the most common causes of heart attacks and strokes, and is also a risk factor for heart disease, kidney disease and dementia. One in three people in the UK have high blood pressure even though just a few simple steps can help combat it. By checking your blood pressure, exercising regularly and reducing the amount of salt in your diet you can significantly lower your blood pressure and enjoy a healthier lifestyle.

The infographic provides some useful tips and advice about how you can keep your blood pressure in check.

This is a really good design with great information for people.  I wish it was a little bit easier to understand though.  A few of the data visualizations are not clearly explained.

In Blood pressure High Spots, I don’t understand what the size of each symbol on the UK map represents.  The implication is the amount of reports high blood pressure cases, but the values are not shown.  I don’t understand the right circle at all.  The percentage numbers seem to be spread on a map, but it’s not the UK, and I don’t recognize it.

In Looking After your Blood Pressure, I think this diagram is completely artistic, even though it seems to imply that it’s a data visualization.

In A Guide to Blood Pressure Levels, the area chart seems to be a visualization over time of some sort, but no x-axis values are shown, so the readers can’t tell what this chart means.

Thanks to Luke for sending in the link!

Monday
Nov122012

The Explosive Growth of Infant Prescriptions

The Explosive Growth of Infant Prescriptions GERD PPI infographic

ColicCalm.com has released a new infographic exploring the incredible rise in the number of infant prescriptions.    Education before medication, please explains the diagnosis, treatment and potential side effects of infant GERD.

Are Infant Reflux Drugs Worth the Risks?

The number of babies prescribed acid suppression drugs such as H2 blockers and PPIs grew 8-fold during 2002 to 2009, but fewer than 10% received any diagnostic testing for GERD (Gastroesophageal Reflux Disease). Some pediatricians are growing concerned that the “epidemic” of infant GERD cases is actually due to over-diagnosis, especially since clinical trials show acid blockers work no better than a placebo and can actually lead to short term and long term side effects. The FDA has not approved PPIs for treatment of GERD in children younger than one year.

Designed by InfoNewt, this design follows the 3-part story format really well.

  1. Introduction: What is GERD? - background information
  2. The Main Event: The Explosive Growth of Acid Blockers - the surprising statistic visualized
  3. Conclusion: What’s the harm? - potential side effects

The topic is potentially controversial, so the design carefully sticks to only sharing the facts and research about infant GERD, and includes an exhaustive source list.  The other critical design elements are also included in the design, like the Creative Commons license and the infographic landing page URL so anyone can find the full-size original. 

Wednesday
Aug292012

American Sugar Consumption

American Sugar Consumption Infographic

OnlineNursingPrograms.com visually shows the readers that they are eating WAY too much sugar with the American Sugar Consumption infographic. It is an eye opener to see how much more we are consuming than the recommended amount and that it can be harmful for us.  It is even going to be difficult to cut back, because sugar is as addictive as cocaine!

 The consumption of sugar will always be an issue for nutritionists and health buffs everywhere. As long as sugar remains a large part of the American diet, we will continue to hear about all the negative effects sugar can have on the body. As someone who is studying nursing, it’ll be important to understand how the overconsumption of sugar may cause many health problems in the future. Many may ask: Is this concern exaggerated? Absolutely not. Sugar is in everything and it has contributed to the growing obesity epidemic in the United States. Since 1990, sugar intake has increased by 40 lbs a year. Is it a coincidence that the obesity rate has increased by 20 percent? As a nurse, you will see many cases in which a reduction of sugar intake could have gone a long way to ensuring less visits to the hospital. It’ll be important as a nurse to educate your patients on why sugar is bad and why they should limit their consumption of sugar. This infographic will show you just how getting your daily sugar fix may be contributing to many short term and long term health issues.

This is a great infographic design.  It’s eye-catching, and uses data visualizations to put the statistical values into context for the readers.  I like the simple color scheme, the use of piles of sugar (like the wheelbarrow and the dumpster) and the real world objects used to provide scale (soda cans and gallon jugs).

Only a couple things I would suggest to improve the design:

  • The average adult easts 22 teaspoons of sugar per day, but the visualization shows 24
  • The average child eats 32 teaspoons of sugar per day, but 33 spoons are shown in the visualization
  • The URL link to the original infographic landing page should be in the footnotes

Thanks to Emily for sending in the link!

Monday
Jan302012

Client Infographic: Top 20 Medical Records Software Solutions

A new infographic design from InfoNewt for CapterraTop 20 Most Popular EMR (Electronic Medical Records) Software Solutions shows the results of comparing Capterra’s Popularity calculations in the EMR software category.

As the deadline for implementation in the U.S. draws near, talk of electronic medical records (EMR) and electronic health records (EHR) software is a hot topic at the doctor’s office lately. These systems assist medical practitioners in the creation, storage, and organization of electronic medical records, including patient charts, electronic prescriptions, lab orders, and evaluations (just to name a few common features). While the terms “EMR” and “EHR” are often used interchangeably, EMR solutions allow for patient information to be shared within one health care organization, whereas EHR solutions allow for health-related records to be shared across multiple organizations. Below is a look at some of the most popular options in both categories, but to see a comprehensive list, visit our EMR Software Directory. You can also click on any of the company logos in the graphic to go directly to their websites.

Capterra’s listing current shows 324 EMR software solutions, and for their target audience this is a very hot topic with an upcoming Federal requirement in the U.S. to make all medical records electronic by 2014.  This is a HUGE issue to convert millions of patient records over the next few years, and practitioners obviously only want to do this once, so picking the right platform up front is critical!

Similar to the Top 20 Marketing Automation Software design, this design features a large pie chart as the primary visualization, and then provides additional information.  The main data is Capterra’s Popularity calculations which combine total users, customers, revenue, social media followers and website rankings.  Again, the specific percantage values weren’t as important as the ranking and visually showing how the packages compare.

This software category has the added complication that the different software packages are written for different sizes of medical organizations.  Single medical practitioners don’t need the same software (or have the same budgets) as hospitals.  We also added the element of showing which hardware platforms each package is design to use.  Microsoft Windows hardware is clearly dominant, but Apple hardware and Cloud-based solutions made up 30% of searches in this category.

Capterra is the authority when it comes to finding software solutions for businesses, and they’ve done some great work gathering data and measuring the relative popularity of different software categories.  Although popularity doesn’t necessarily mean the software is right for your business, it is a really good indicator that the solution is working successfully for many businesses and may be worth a closer look.  A better indicator than just total revenue or trying to rate “the best.”  You can read their comprehensive blog post about the data behind the infographic.

Thanks to the team at Capterra for being great to work with!

Tuesday
Jan102012

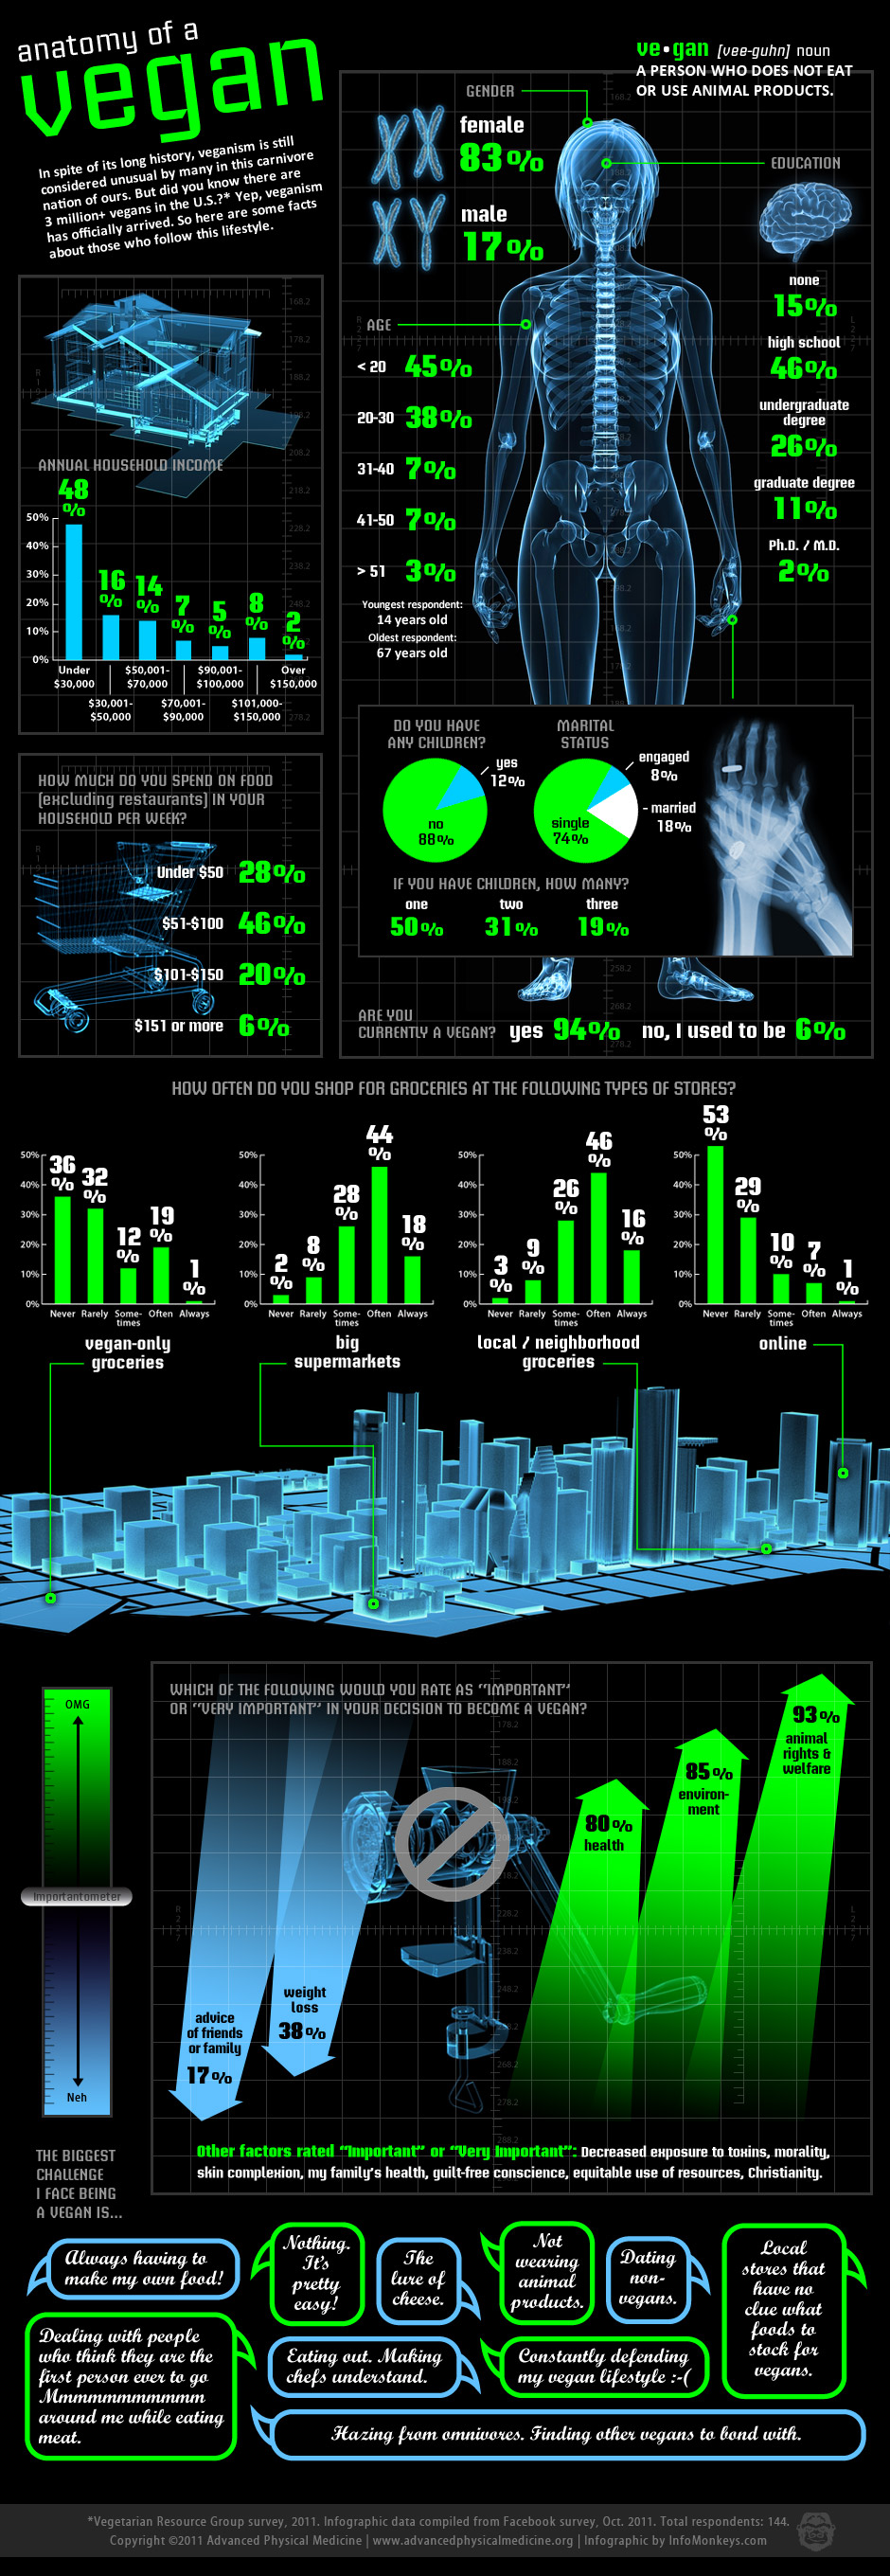
The Anatomy of a Vegan

The Anatomy of a Vegan infographic from AdvancedPhysicalMedicine.org takes an “in depth” look at some of the demographic data they gathered in a survey of Vegans.

In spite of its long history, veganism is still considered unusual by many in this carnivore nation of ours.  But did you know there are 3 million+ vegans in the U.S.?  Yep, veganism has officially arrived.  So here are some facts about those who follow this lifestyle.

Designed by InfoMonkeys, I love the X-Ray design style.  They do a great job of showing context of the data being represented.  Hands with a wedding ring, the house, the shopping cart, the cityscape and the meat grinder is especially humorous.

Eye-popping colors and an X-ray theme give a whole new meaning to taking an “inside look” at veganism. Packed with information, this infographic strikes a great balance between education and entertainment. Based upon a Facebook survey with text provided by the client, this is one of our favorite pieces!

- InfoMonkeys

The black background stands out boldly in blog formats, and the infographic includes all the important information (clear title, data source, copyright, website URL and even lists the designer).  It should have listed the URL of the infographic on the Advanced Physical Medicine site instead of the homepage.  I like the idea of the “Importantometer”, but I just noticed the size of the arrows in the visualization doesn’t match the data.  The 17% arrow shouldn’t be larger than the 38% arrow, etc.

I have a few things I would suggest changing about the design:

  • I say it often here on the blog.  Big fonts do not make good data visualizations.  Too many of the statistics are listed as big numbers without any visualization, and it would have been simple to visualize these statistics.
  • The percentage sign under the value numbers on the bar charts are hard to read and disconcerting.  Shrink the numbers and lets the visualization tell the story.  The actual numbers themselves are secondary.
  • The Annual Household Income is shown as a bar chart, but those percentages are all part of the complete 100%.  They should be shown as parts of the whole like a pie chart or a stacked bar chart.  Same with the shopping statistics.
  • I have a really hard time reading the script font they used in the quoted responses at the bottom.

One final thought is that readers should always be skeptical of the data sources.  144 respondents from a Facebook survey is not enough to be a statistically valid study that would indicative of the entire population.  The reader also doesn’t know how the respondents were screened as part of the survey.  By visualizing the data in an infographic, it implies a certain level validity that isn’t truly there.

Thanks to David for sending in the link!

Page 1 2