About
Randy Krum
President of InfoNewt.
Data Visualization and Infographic Design

Infographic Design

Infographics Design | Presentations
Consulting | Data Visualizations

DFW DataViz Meetup

Join the DFW Data Visualization and Infographics Meetup Group if you're in the Dallas/Fort Worth area!

Search the Cool Infographics site

Custom Search

Subscriptions:


Feedburner

The Cool Infographics® Gallery:

How to add the
Cool Infographics button to your:

Cool Infographics iOS icon

- iPhone
- iPad
- iPod Touch


Read on Flipboard for iPad and iPhone

Featured in the Tech & Science category

Flipboard icon

Twitter Feed
From the Bookstore

Caffeine Poster

The Caffeine Poster infographic

Entries in rank (2)

Thursday
Sep292016

Visualizing the Fortune 500

Visualizing the Fortune 500 interactive data visualization

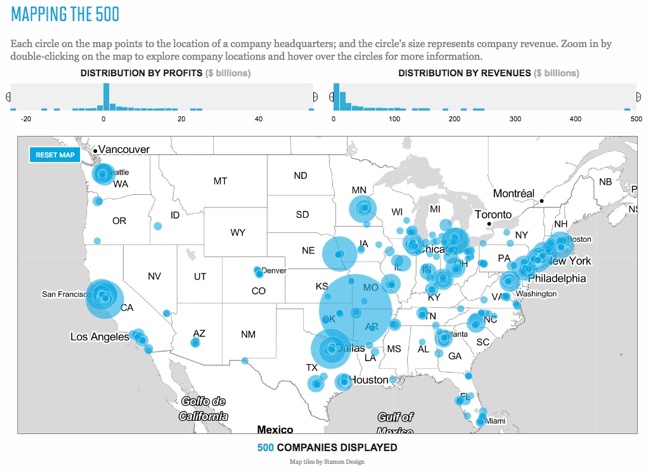
Visualizing the Fortune 500 is an experiment by the team at Fortune magazine. This is an interactive data visualization site that shows the location of each company's headquarters and the size of the circle represents the company's annual revenue.

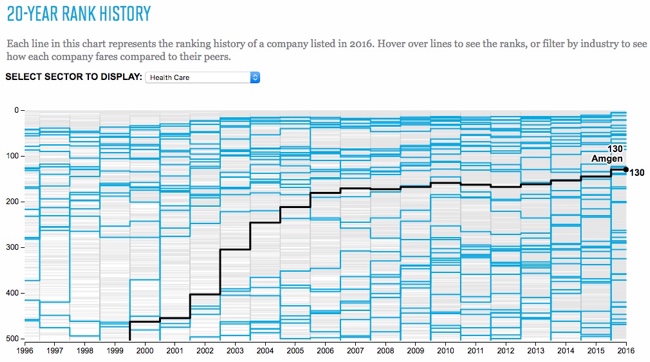
People visit and revisit the Fortune 500 for lots of reasons, chief among them: job prospects, sales leads, corporate research and investor information. And bragging rights, of course. Below are two visualizations that allow you to explore the Fortune 500. On the map you'll find every one of the U.S. headquarters from the 2016 list, on the line chart below it, you'll see how each of the companies on the 2016 list has moved through the ranks for the past 20 years.

They also show an interactive visualization of how the companies have moved through the ranks over the last 20 year history of the Fortune 500.

Designed by Nicolas Rapp, using map tiles from Stamen Design.

Tuesday
Jan282014

2013 Airline Scorecard Best to Worst

2013 Airline Scorecard; Ranking of Major Carriers in Key Operational Areas, Best to Worst infographic

Traveling by airplane can be a stressful situation. Choosing the correct airline can make all the difference. Check out how your favorite airline scores on the 2013 Airline Scorecard; Ranking of Major Carriers in Key Operational Areas, Best to Worst infographic and article from The Wall Street Journal

In the Middle Seat’s annual scorecard of airline service, tracking seven different key measures of airline performance, Alaska Airlines performed best in 2013 among major carriers. At the top with Alaska was Delta, which for the past two years has posted far better operational results than big competitors. Worst among big airlines? United Airlines and American Airlines, again. 

By assigning each airline a specific color, it allows the viewer to clearly distinguish each airline throughout the scorecard. The lines connecting the columns also gives the whole graphic a sense of connectivity and flow, causing the eye to follow each airline.

Even though this visualization is part of a larger article, they did a good job of including the relevant information in the image file itself.  This is a big help when the scorecard image gets shared online.  It has a clear title, data sources and credit to the WSJ.  The URL back to the article would be very helpful, but they didn’t include that in the image.

Found on http://ilovecharts.tumblr.com