About
Randy Krum
President of InfoNewt.
Data Visualization and Infographic Design

Infographic Design

Infographics Design | Presentations
Consulting | Data Visualizations

DFW DataViz Meetup

Join the DFW Data Visualization and Infographics Meetup Group if you're in the Dallas/Fort Worth area!

Search the Cool Infographics site

Custom Search

Subscriptions:


Feedburner

The Cool Infographics® Gallery:

How to add the
Cool Infographics button to your:

Cool Infographics iOS icon

- iPhone
- iPad
- iPod Touch


Read on Flipboard for iPad and iPhone

Featured in the Tech & Science category

Flipboard icon

Twitter Feed
From the Bookstore

Caffeine Poster

The Caffeine Poster infographic

Entries in report (4)

Wednesday
Nov282018

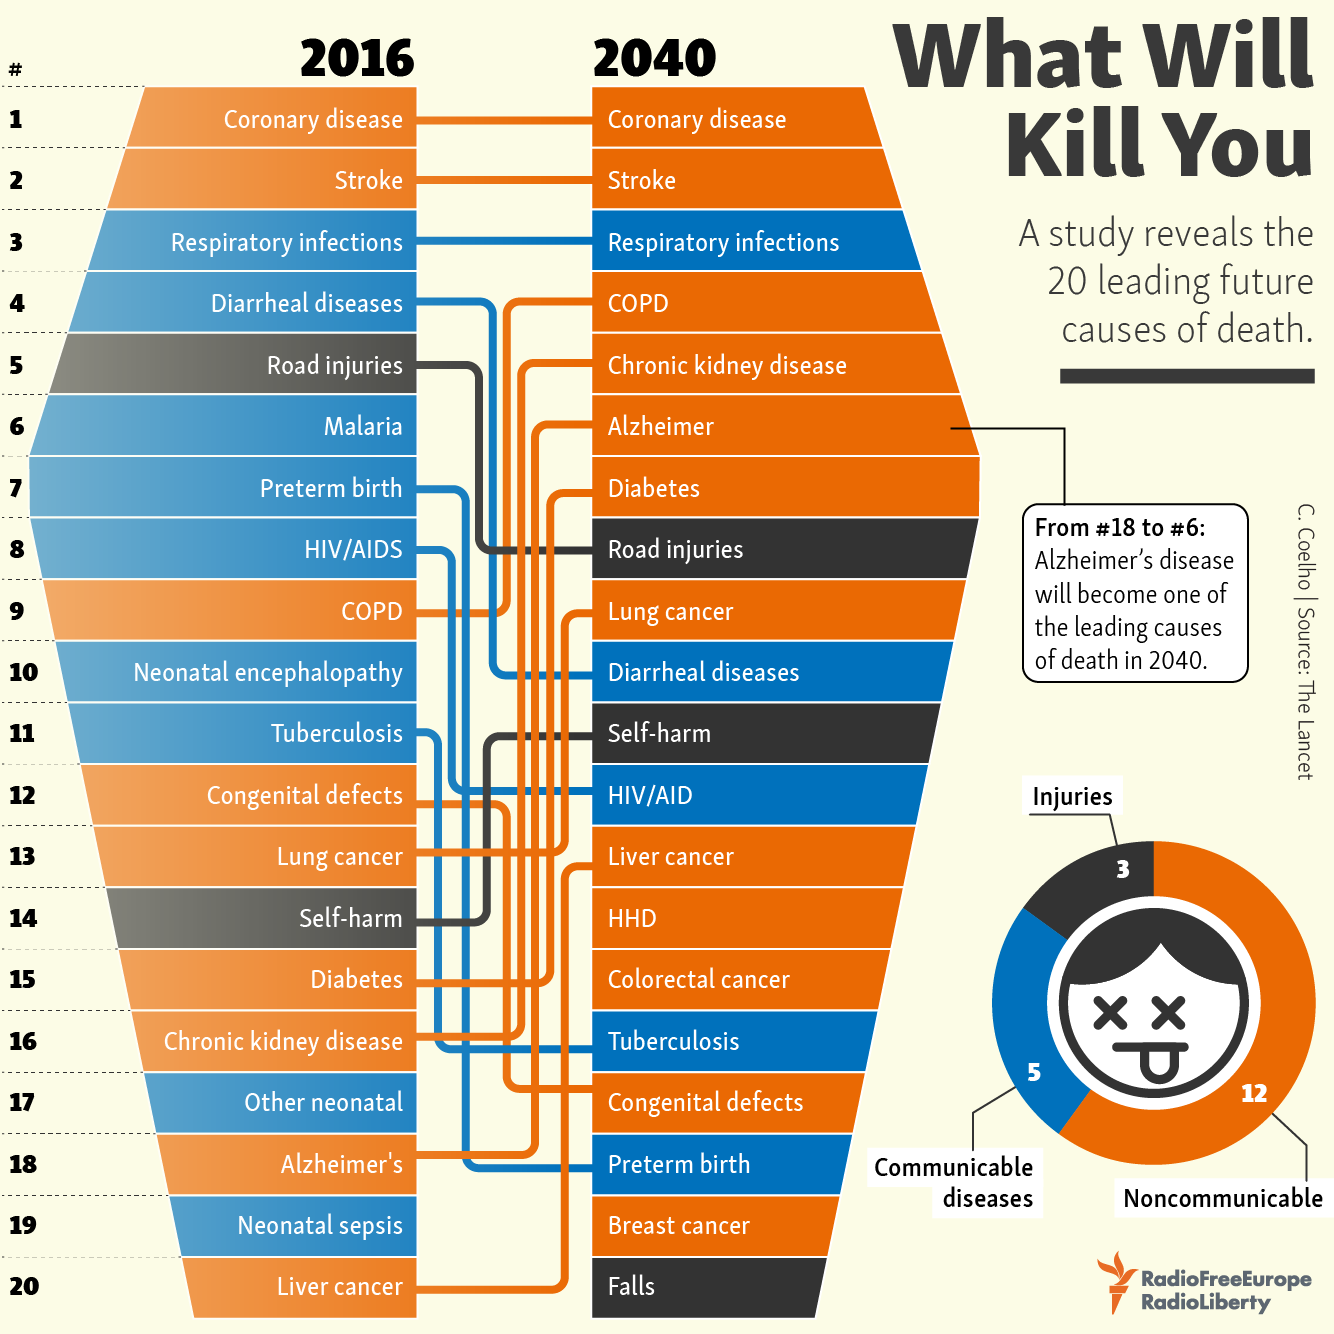
What Will Kill You in 2040

What Will Kill You in 2040 infographic

What Will Kill You in 2040 infographic takes the top 20 reasons for death in 2016 and compares them to the predicted top 20 reasons for death in 2040. The top 3 aren't predicted to change, however the rest are all over the board!

The infographic was created by Radio Free Europe Radio Liberty. Their source of information came from an article published in The Lancet (a peer-reviewed general medical journal) called Forecasting life expectancy, years of life lost, and all-cause and cause-specific mortality for 250 causes of death: reference and alternative scenarios for 2016-40 for 195 countries and territories. That's a mouth-full for a title!

The orthogonal lines are hard to follow. Straight lines would have turned this into a slope graph, and made it easier to see which causes of death were increasing or decreasing. Categorizing the causes of death into 3 different categories and color coding them really helps break up the text and makes it a little easier to follow the arrows.

Found on Radio Free Europe

Monday
Feb082016

2016 State of Small Business Report

The 2016 State of Small Business Report from Wasp Barcode highlights some of the most pressing issues facing small business owners.

According to the 2016 State of Small Business Report, 71 percent of them expect to increase revenue in 2016, a 14 percent increase over 2015’s revenue optimism.

Their optimism is holding up in the face of a few big hurdles this year, namely hiring new employees, increasing profit, and employee healthcare. More than 1,100 small business owners and executives identified these items as their top three challenges for 2016.

In addition to identifying business challenges, the State of Small Business Report also investigated small businesses’ views on the economy, hiring, government, marketing practices, and use of information technology.

Check out a few highlights and let us know what you think.

I really like the use of the infographic to highlight a few key points to draw in readers to the full report. 

A few things I would suggest that designers and publishers can learn from:

  • Make the fonts larger or make a larger version of the infographic image file available. Much of the text in the "full size" version is still too small to read.
  • Use a good description in the infographic image filename. This image was just called "Infographic-FULL-SIZE.png" which hurts you visibility with the search engines.
  • Visualize all of the data. When some data in an infographic is listed as text-only, it is perceived by readers as less important and often skipped over.
  • Include a copyright or Creative Commons license statement. I can't tell if there is one, it's too small for me to read.
  • Include the URL to the infographic landing page so readers can find the full-size original infographic when it appears on other sites that don't link back appropriately. I appreciate the link to the full report they are promoting, but readers also need the link to the infographic landing page.
  • The infographic should be linked or included in the full report page. 

Thanks to Anna for sending the link!

Friday
Aug022013

The 2012 Feltron Annual Report

The 2012 Feltron Annual Report

The 2012 Feltron Annual Report is a report by information designer Nicholas Felton whose numbers were gathered with a custom-built iPhone app called Reporter. At random intervals each day the app sent reminders to complete a survey. The results of these questions were saved alongside background measurements to form the basis of this document. You can see the examples of the report at Feltron.com and buy it at the shop.

An extensive write up can be found on Fast Co Design:

Today, you probably know Nicholas Felton best for his most widely seen work, Facebook’s Timeline. But since 2005, he’s been working on a cult-favorite project all his own, the annual Feltron Report. The 2012 version is out now for $28.

As always, the report is a meticulously documented year in review of everything he’s done, presented in a series of rich infographics that push the boundaries on personal data quantification. With a glance, you’ll learn some of Felton’s most intimate details. Each day, he consumes coffee around 10:40am and booze around 8:38pm. He spends about 4x as much time with his girlfriend as his mother. And on June 20, he shot a Glock 22.


Found at http://feltron.com

Thursday
Dec062012

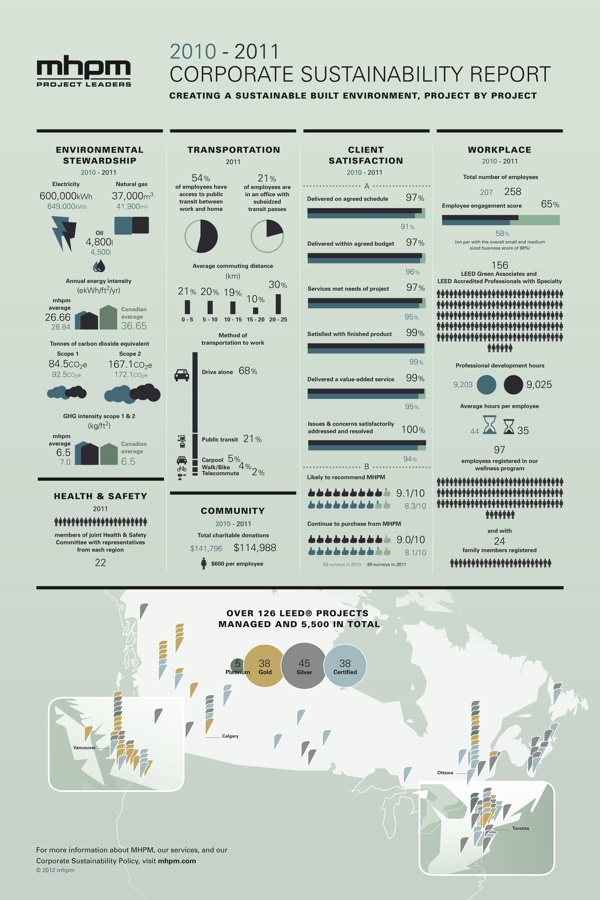
MHPM's Infographic CSR (Corporate Sustainability Report)

MHPM's Infographic CSR (Corporate Sustainability Report)

MHPM Project Managers has taken a different approach with the release their first CSR (Corporate Sustainability Report).  Instead of the normal text report that other companies release, MHPM created an infographic poster with all of their sustainability information.  It serves as a great example to their clients of how even CSR data can be designed in an engaging way.

MHPM Project Leaders passed a milestone towards integrating sustainable practices into its business operations today, with the release of its first annual corporate sustainability report.

MHPM’s corporate sustainability report evaluates MHPM’s impact on the environment and the community, its transportation practices and workplace policies. The findings reveal areas for improvement and provide a benchmark against which to measure future performance.

Designed by InfoNewt, this poster was printed at 24” x 36” by MHPM and is also available online on the Corporate Sustainability Report section of their website.  The front side of the post visualizes all of the data, and puts most of it into context by comparing to prior year results.  The back side of the design includes all of the required text, which keeps the front side less cluttered and easy to read.  The entire design is inspired by the Global Reporting Initiative’s guidelines.

This is a fantastic use of infographic design principles!  The full size, high-resolution poster is available as a PDF download from the CSR page.