About
Randy Krum
President of InfoNewt.
Data Visualization and Infographic Design

Infographic Design

Infographics Design | Presentations
Consulting | Data Visualizations

DFW DataViz Meetup

Join the DFW Data Visualization and Infographics Meetup Group if you're in the Dallas/Fort Worth area!

Search the Cool Infographics site

Custom Search

Subscriptions:


Feedburner

The Cool Infographics® Gallery:

How to add the
Cool Infographics button to your:

Cool Infographics iOS icon

- iPhone
- iPad
- iPod Touch


Read on Flipboard for iPad and iPhone

Featured in the Tech & Science category

Flipboard icon

Twitter Feed
From the Bookstore

Caffeine Poster

The Caffeine Poster infographic

Entries in Sharks (4)

Thursday
May192016

Sizing Up Sharks

Sizing Up Sharks infographic National Geographic

The design team at National Geographic has published a beautiful size comparison infographic: Sizing Up Sharks, the Lords of the Sea. The parallax scrolling keeps you, the reference deep sea diver, in frame as a comparison to provide perspective for each of the various types of sharks.

Sharks range in size from largest fish on the planet to the length of your palm. See how you compare to some of these vulnerable predators that are so crucial to the ocean's health.

The tooth Illustrations are not in scale with the fish, but all the teeth are in scale to each other to show relative tooth sizes. For some reason, only a few of the smaller sharks species are shown with both the small end and high end of their size ranges.

Sizing Up Sharks infographic Great White

This engaging infographic tells one story really, really well without adding too much other data that would have cluttered the design. The diver animation and underwater sounds are a nice touch.

Thanks to Chiqui Esteban (@chiquiesteban) for posting the link!

The massive Megalodon!

Sizing Up Sharks infographic Megalodon

Friday
May022014

The Deadliest Animal in the World

The Deadliest Animal in the World is an infographic posted by Bill Gates on his blog as part of Mosquito Week.

What would you say is the most dangerous animal on Earth? Sharks? Snakes? Humans?

Of course the answer depends on how you define dangerous. Personally I’ve had a thing about sharks since the first time I saw Jaws. But if you’re judging by how many people are killed by an animal every year, then the answer isn’t any of the above. It’s mosquitoes.

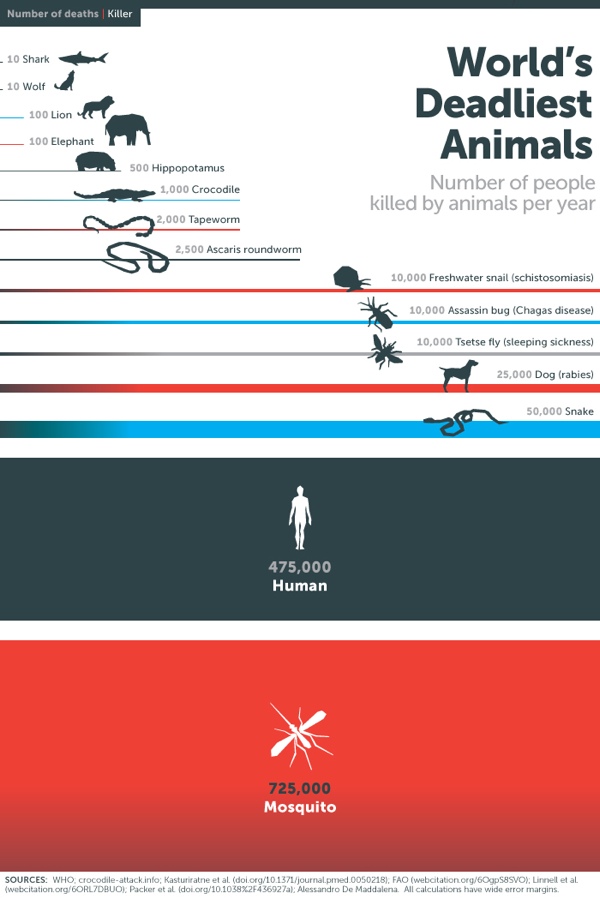
When it comes to killing humans, no other animal even comes close. Take a look:

Considering their impact, you might expect mosquitoes to get more attention than they do. Sharks kill fewer than a dozen people every year and in the U.S. they get a week dedicated to them on TV every year. Mosquitoes kill 50,000 times as many people, but if there’s a TV channel that features Mosquito Week, I haven’t heard about it.

This infographic does a number of things right from a design perspective, but the major point is that as humans we see the two-dimensional area of objects as representing the values.  This design uses both the width and height of the rectangles to visualize the scale of deaths caused by the various animals.

Sometimes it might be too subtle.  For example, the width is the same for the rectangles for tapeworms and crocodiles, but the height of the tapeworm box has twice the height to represent the value correctly.

The other thing it does well is to tell one story really well.  There’s isn’t any extraneous information like geographic locations or animal populations.  The infographic focuses on communicating one set of data.

Because the infographic will be shared online without the rest of the article, there are three piece of information that are missing from this design:

  1. The Gates Notes logo, or some type of identification of who published the infographic
  2. A copyright or Creative Commons license state to clearly identify the rights for people sharing the infographic
  3. The URL of the article where readers can find the original, full-size infographic and the associated text.

Thanks to Peter for recommending the link!

Thursday
Jan092014

Great Danger for the Great White Shark

Great Danger for the Great White Shark infographic

Most people know of Great White Sharks as a dominant predator, but this powerful shark is actually nearing extinction. The Great Danger for the Great White Shark infographic from Shark Watch SA breaks down the statistics for the few remaining sharks. 

The general perception is that the great white shark population is between 3000-5000. Marine biologists conducted a five year study in Gansbaai (a small town in South Africa with the greatest population of great white sharks in the world) that revealed the population to be approximately 50% of the original estimate. This means great white sharks could be closer to extinction than black rhinos…

The data could of been visualized a little better. The infographic uses a little too much text insead of visuals to portray their data. But overall, an eye-catching graphic.

Thanks to Marine Dynamics for sending in the link!


Friday
May102013

Shark Attack!

Shark Attack! infographic

Shark Attack! is a great infographic design collaboration between Ripetungi and Joe Chernov.  Based on data from a Huffington Post article, 100 Million Sharks are Killed Annually.

Recently received a Facebook message from content marketing wizard Joe Chernov linking to the Huffington Post article 100 million sharks are killed annually.  This was an astonishing fact and the enormity of the number made it difficult to wrap your head around.  Joe also shared an idea for a graphic to add context to this fact making it easier to comprehend, while exposing the outrageous ratio of the number of people sharks kill to the number of sharks people kill.

Great data visualization that shows readers the magnitude and scale of how many sharks are killed by humans every hour.  It also puts the 11,417 sharks killed value into context by comparing it against the 12 humans killed by sharks every year.  [EDITED]

Don’t get me wrong.  I’m convinced that death by shark attack would be a horrible way to go, but some days it’s good to be at the top of the food chain on Earth.