About
Randy Krum
President of InfoNewt.
Data Visualization and Infographic Design

Infographic Design

Infographics Design | Presentations
Consulting | Data Visualizations

DFW DataViz Meetup

Join the DFW Data Visualization and Infographics Meetup Group if you're in the Dallas/Fort Worth area!

Search the Cool Infographics site

Custom Search

Subscriptions:


Feedburner

The Cool Infographics® Gallery:

How to add the
Cool Infographics button to your:

Cool Infographics iOS icon

- iPhone
- iPad
- iPod Touch


Read on Flipboard for iPad and iPhone

Featured in the Tech & Science category

Flipboard icon

Twitter Feed
From the Bookstore

Caffeine Poster

The Caffeine Poster infographic

Entries in spending (78)

Monday
Feb082010

Obama's 2011 Budget Proposal Infographic

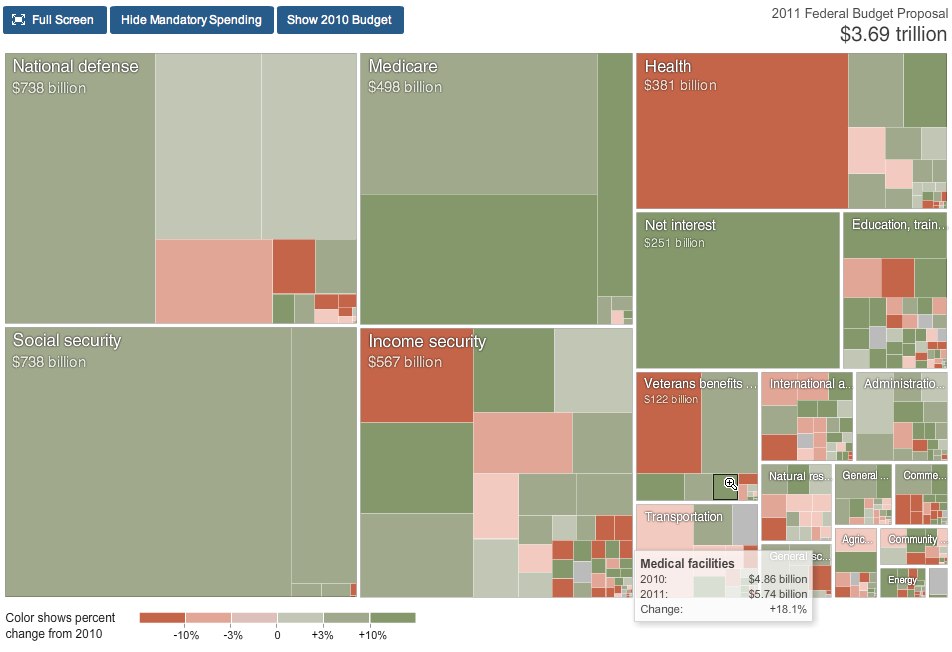
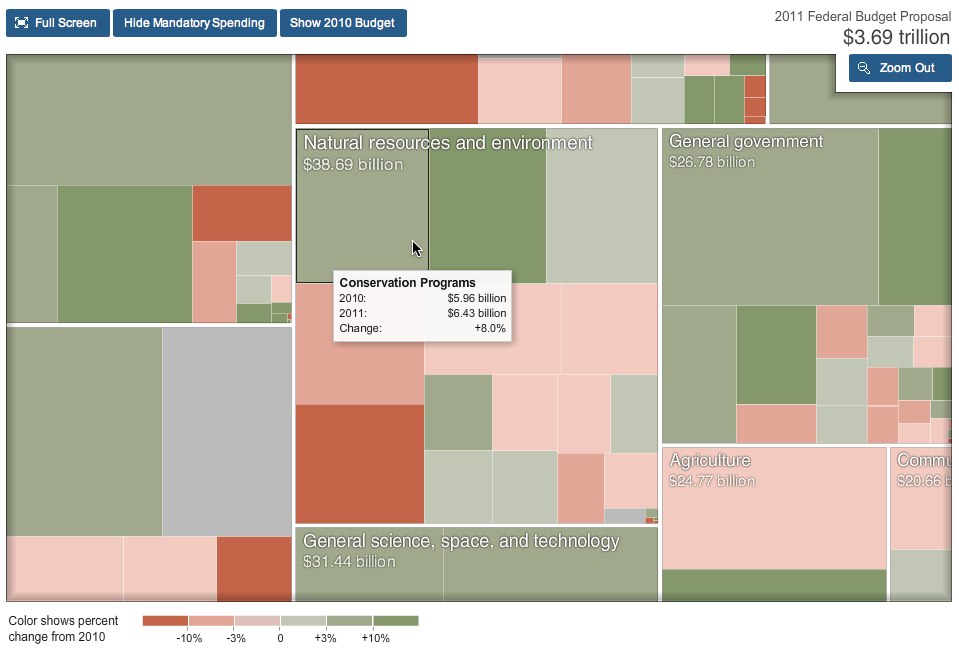
From NYTines.com, a treemap of Obama’s Budget Proposal color coded for increases and decreases from the prior year.

Rectangles in the chart are sized according to the amount of spending for that category. Color shows the change in spending from 2010.

Red indicates budget cuts, and green indicates increases in spending.  It’s a little bit interactive, allowing you to zoom into specific parts of the budget, and see detials by hovering the mouse over squares.

Designed by Shan Carter and Amanda Cox.

Found on FlowingData.

Friday
Dec252009

Christmas by the Numbers!


BillShrink.com presents this holiday infographic, Christmas by the Numbers, visualizing the decline in holiday spending in the U.S. and some other fascinating holiday figures.  Click the link to see the high-resolution version.
‘Tis the season for Christmas trees, lights and gifts, and in the past that has also meant the season of outrageous spending. While the holidays may not be cheap, hard times sometimes call for desperate measures and drastic budget changes. Here’s a look at the hard facts and numbers of this most wonderful time of the year.
Merry Christmas from Cool Infographics!

Thursday
Dec242009

The Holiday Economy


Our Present Economy is a look at holiday spending from 1997-2007 with some specifics about 2007.  It doesn't say explicitly, but I believe this is for the U.S. only.  From GOOD Magazine, this Good Sheet was available at Starbucks during the holiday season in 2008.

I wonder how 2009 compares?

Tuesday
Dec082009

Infographic Coins!


What a great infographic product design idea!  From designer Mac Funamizu on his site, PetitInvention, Infographic Coins that use the physical analogy of a pie chart to help consumers figure out the currency, especially when visiting a foreign country.  You have to ignore some of the benefits of all round coins, but the idea is spot-on.  Feeling in your pocket, you could almost always pull out the right coin.


The round shaped coins must have a lot of benefits that other figures such as a triangle or a square don’t. Also, non-rounded coins may have many demerits. Aside from those, travelers and other people who are not accustomed to the currency would be able to easily remember how much each of these coins is (as long as she knows how to read pie charts).


Wednesday
Dec022009

Ebay Visualizes Black Friday 2009 - Interactive infographic map


From ebay, a map of the transaction activity on Black Friday 2009 (the shopping day after Thanksgiving).  1 million transaction are mapped in the U.S. over the course of the day!
Activity Level Indicator The color of the point on the map indicates the number of transactions that occurred in the corresponding area.
Data Execution This transaction map was created as a study of the extensive activity that occurs in the eBay Marketplace on the biggest offline shopping day of the year. It is a visualization of all U.S.-based buyer and seller transactions on eBay on Black Friday, November 27, 2009 (12:00:00 AM to 11:59:59 PM EST). Although eBay is an international marketplace, this map is focused on U.S. data, as Black Friday is the traditional beginning of the holiday shopping season for the U.S.
It's an interactive, animated timeline, so you can watch the transactions grow throughout the day and zoom in to specific areas of the country by clicking on the map.  It's a flash animation, but there's a WMV movie file available for download too.

They also did a map of the even bigger 1.4 million transactions on Cyber Monday 2009.

Found on VizWorld


Monday
Nov092009

ANC Spending infographic


Diaan Minhardt created this simple infographic for his blog, Dreamfoundry, to show how money being spend on new cars for government officials could have been spent differently to build houses.
I’ve been keeping an eye on the rivers of money haemorrhaging out of the government coffers for idiotic reasons for some time now. What I saw inspired me to create this very simple infographic.
Thanks Diaan!

Monday
Oct052009

The Billion Dollar Gram


This is one of those simple, but great infographics.  Once the news starts talking about "billions" of dollars, the brain goes numb and it all runs together because the numbers are too big for us to comprehend.

David McCandless, from Information Is Beautiful, created this tree map to show the relative size of the different billion dollar spending and budgets in the news.

Great job David, keep them coming!


Tuesday
Aug042009

NEW Death and Taxes 2010 poster!!

First, Jess from WallStats.com has released the 2010 Death & Taxes poster.  This is one of the best infographic examples today.  It's extremely informative, and the topic has a very wide reach.  The Death & Taxes poster from 2007 was my initial post on Cool Infographics, so I'm very excited to see this update.   Now the 2010 version is available to purchase as a poster here. Great job Jess!

Second, I'm really impressed by the viewer code for the poster. It's from Zoomorama.com, and lets me embed the interactive viewer.  The built-in zoom is pretty nice, but the Quick Find index on the left side is the best part.

Thursday
Mar122009

Visualizing the Stimulus Bill


Here's a great, simple graphic that breaks down the stimulus bill.

Nicholas Rapp does some great infographic design work.  Check out some of his other work at nicolasrapp.com

Wednesday
Feb252009

Taking Apart the $819B Stimulus Package

Very detailed infographic from the Washington Post showing how the proposed stimulus package is broken out between ares of spending and tax cuts.

The centerpiece of President Obama's domestic agenda is an $819 billion economic stimulus plan. The Senate will consider the measure this week, with an eye toward the amount of tax cuts and spending. Republicans and Democrats spar over what to consider a tax cut. An analysis by the nonpartisan Congressional Budget Office tallies the tax-cut portion to be significantly less than the one-third Democrats claim it to be.

SOURCE: Congressional Budget Office | Reporting by Karen Yourish, graphic by Laura Stanton - The Washington Post - February 01, 2009

Page 1 ... 3 4 5 6 7 ... 8 Next 10 Entries »