About
Randy Krum
President of InfoNewt.
Data Visualization and Infographic Design

Infographic Design

Infographics Design | Presentations
Consulting | Data Visualizations

DFW DataViz Meetup

Join the DFW Data Visualization and Infographics Meetup Group if you're in the Dallas/Fort Worth area!

Search the Cool Infographics site

Custom Search

Subscriptions:


Feedburner

The Cool Infographics® Gallery:

How to add the
Cool Infographics button to your:

Cool Infographics iOS icon

- iPhone
- iPad
- iPod Touch


Read on Flipboard for iPad and iPhone

Featured in the Tech & Science category

Flipboard icon

Twitter Feed
From the Bookstore

Caffeine Poster

The Caffeine Poster infographic

Entries in text (9)

Monday
Jul022018

What Your Font Says About You

What Your Font Choices Say About You infographic

What Your Font Choices Say About You infographic from GetVoip is a comical explanation of why we choose what font we use.

In 1975, two Swiss designers, Max Miedinger and Eduard Hoffmann came out with the font Helvetica. Since then, it has been used on some of the biggest brands in the world, such as Verizon, 3M, Kawasaki, Jeep, Tupperware, Target, Panasonic, and Apple.

What is it that makes this font and others so alluring?

For most of us, unless you are a designer in some capacity, the font choice on reading materials is overlooked or completely ignored. But there may be something that still triggers in the subconscious that helps you recognize a good font. In one study at MIT, subjects were found to be in a better mood after reading something with “good” typography. The subjects also saw improved performance in certain cognitive tasks after reading the “good” typography instead of the bad.

Today, there are over 33,000 fonts available on sites like MyFonts.com With so many choices, and so much at stake, how do you know which to choose? And furthermore, when choosing a font, do you know what message it might be conveying to your readers?

We put together an infographic below that looked at some of the most popular fonts of the day and provided some feedback on what message you might be sending with that font choice or style.

Whether you are drafting an important email or deciding on a font to use for your brand, you will certainly want to know how this decision will come to define you. We all have likely experienced either sending or receiving an embarrassing misspelling, grammatical error, or autocorrect failure, but choosing the wrong font can become the biggest mistake of all.

If you have ever been concerned about how you will be perceived by your choice of font, your concerns are warranted. Dan Gilbert, the majority owner of the Cleveland Cavaliers basketball team, received a maelstrom of criticism after his open letter regarding Lebron James’ move to the Miami Heat was written in the Comic Sans font.

When choosing your font it’s best to default to a standard serif or sans-serif versus a more decorative or script font, even if you are resentful that your elementary school teacher said that you would need to know cursive in life––lies!

What does using Trebuchet on the Cool Infographics site say about me? 

Thank you to Drew for sending in the link!

Wednesday
Feb152017

Bold & Justified: The Huge World of Typography

Bold & Justified: The Huge World of Typography infographic

Coulor Lovers has done some etensive research on typography and has compiled it into their Bold & Justified: The Huge World of Typography infographic. A lot has changed since 1452 when the first movable type was invented. Now every business and brand can have their own unique typeface.

Comic Sans is installed more on PCs. Why so serious Linux & Mac? That's just one of the many things we discovered while looking into the creative history of typography aka fonts. They play a huge part in branding and logos. They bring us the words in the stories we read. They add personality to a message. ... and with CreativeMarket.com, our new marketplace for beautiful design content like fonts launching soon, we wanted to bring the typographic history, usage & character to life. Get your typographic love on!

The content in this one is fantastic, but they took some creative liberties when it comes to visualizing the data. A common error is sizing circle incorrectly by changing the diameter to match the data instead of the area (See more HERE). The lengths of the ties in the Style section is just creative illustration, and doesn't match the data values. The doughnut chart on the "Type On The Web" section doesn't add up to 100%!

I love the depth of details they put together, but the data visualization details are disappointing.

Thursday
Aug292013

Consumer Attitudes to SMS Marketing and Texts Alerts

Consumer Attitudes to SMS Marketing and Texts Alerts infographic

The Consumer Attitudes to SMS Marketing and Texts Alerts infographic is the results of a survey done by Text Marketer. The survey was conducted to find out the consumers’ view on receiving text alerts from companies. 

The infographic is based on an exclusive survey of over 1,350 consumers in to their attitudes to SMS marketing. 

The results highlight that 84% of customers want to receive appointment reminders, 61% want order confirmations and 89% would like delivery notifications via text; showing there are a lot of ways to market through this channel that customers love. 

48% of consumers are also likely to respond to a text from a company they have previously purchased from. Consumers love special offers by text and like to be able to ask questions to companies via text messages.

Since the data is from their own survey research, there are no additional data sources cited.  The purpose of the first section is to establish the credibility of the data, but the total number of respondents alone isn’t enough.  Surveys like this target specific consumers, and use screener questions to target a specific portion of the population.  What type of consumers were surveyed for this report?

The visualizations of the data are clear, and the iPhone illustrations for the results of each question break apart the data nicely.  It’s a little hard for readers to understand that the lineup of iPhones is meant to add up to the total of 100% of respondents for each question.

The footer should include a copyright notice, and the URL back to the original infographic landing page so readers can find the full-size version if a link is not available.  A link to the source data would increase the credibility of the data too.  Instead, the landing page has a link to the home page of Text Marketer as the data source link, which means public access to the numeric data is not available.

Thanks to Mike for sending in the link!

Monday
Apr222013

8 New Punctuation Marks We Need

8 New Punctuation Marks We Need infographic

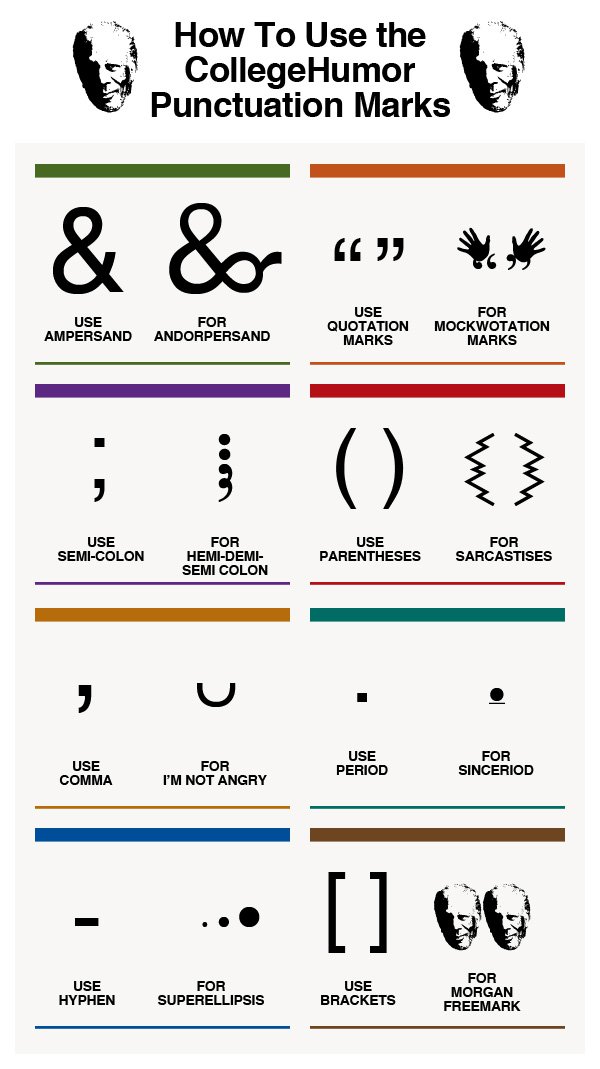
Our punctuation choices could really use an update, and CollegeHumor.com is proposing we add these 8 New Punctuation Marks to our collective writing options.

A humorous look at some of the punctuation marks missing in the English language.

This is a borderline infographic.  Originally, all eight were designed as separate images, but then College Humor stacked them together into one image file so that it resembled a tall infographic .  There’s no data visualization or much in the way of illustration other than the symbols themselves.  However, it is informative, so like I said, I consider this to be a borderline infographic.

The response to the ideas was strong enough that they actually created the font, and you can download it from the College Humor site.  They created a separate infographic as the instructions on how to use the font in your desktop applications once you have it installed.  

UPDATE: Want to use these punctuation marks? Click here to download the CollegeHumor Punctuation font and get access to all of them.

The downloaded font won’t work on websites, just desktop applications, but I have seen a few people trying to make it available online as well.  For example, here’s a link to a Google Chrome extension that let’s you use the font on Facebook.

Found on Visual.ly

Thursday
Jul142011

Distracted Driving Infographic

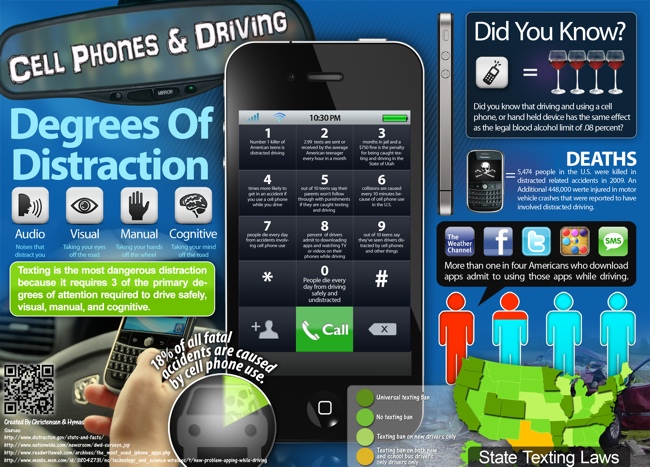
From the Christensen Law Firm in Utah comes the Cell Phones & Driving infographic that looks at the horrifying statisitics behind accidents and deaths caused by people using cell phones while driving in the U.S.

shocking facts about the realities of texting and driving in modern culture. It mentions, for example, that 18% of all fatal accidents are caused by cell phone use, and that 6 collisions occur every 10 minutes because of cell phones. In other words, keep the cell phone as far away from you as possible while driving, because frankly, becoming one these statistics is not an admirable achievement.

The design style is very crowded and busy, but I like the unique approach to using each number on the keypad as a statisitic.

“More than one in four Americans who download apps admit to using those apps while driving.”  On my iPhone, one of those apps is the TomTom GPS app, so of course I use it while driving!

Thanks to Jake for sending in the link!

Friday
Jul022010

The 2010 Internet Censorship Report infographic


From Antonio Lupetti at WoorkUp.com, The 2010 Internet Censorship Report looks at how many people in the world population are effected by government censorship.

It is one of the tools used by governments to filter out unwanted information and to prevent the spread through the World Wide Web. It is a phenomenon of staggering proportions that affects over 25% of the global population.

My suggestion for improvement is that I think the the white circles representing the countries should be sized in accordance the population numbers.

Thanks to Antonio for sending in the link.

Friday
Dec182009

Word Spectrums! The Online Infographic Battleground


On Chris Harrison's site, there are a number of graphics that he calls Word Spectrums.  More like a battleground, Chris is using the enormous amount of data from websites that has been made public by Google.  This is an advanced form of a word cloud that visualizes related words and their relative connections to the two topics.  (FYI, since this is based on raw Google data, foul language does appear in some of them).


Using Google's enormous bigram dataset, I produced a series of visualizations that explore word associations. Each visualization pits two primary terms against each other. Then, the use frequency of words that follow these two terms are analyzed. For example, "war memorial" occurs 531,205 times, while "peace memorial" occurs only 25,699. A position for each word is generated by looking at the ratio of the two frequencies. If they are equal, the word is placed in the middle of the scale. However, if there is a imbalance in the uses, the word is drawn towards the more frequently related term. This process is repeated for thousands of other word combinations, creating a spectrum of word associations. Font size is based on a inverse power function (uniquely set for each visualization, so you can't compare across pieces). Vertical positioning is random.


Chris has created and shared a number of different versions on the Word Spectrum page of his website, and you can see high-resolutions PDFs of each there.

Want to try your own?  Building on Chris' idea, Jeff Clark from Neoformix has created interactive Word Spectrums using either Twitter or News as the source that lets you enter your own terms to compete.  I especially like the idea of pitting two competing brands against one another.


Tuesday
Mar312009

Periodic Table of Typefaces


Created by Cameron Wilde/SquidSpot, The Periodic Table of Typefaces lays out the top ranked type fonts.  Makes a great poster for the office.


I found this over on Visual Think Map

Saturday
Mar082008

See the World in Words

I thought this was really cool!