iOS Version Release Date History
 Randy
Randy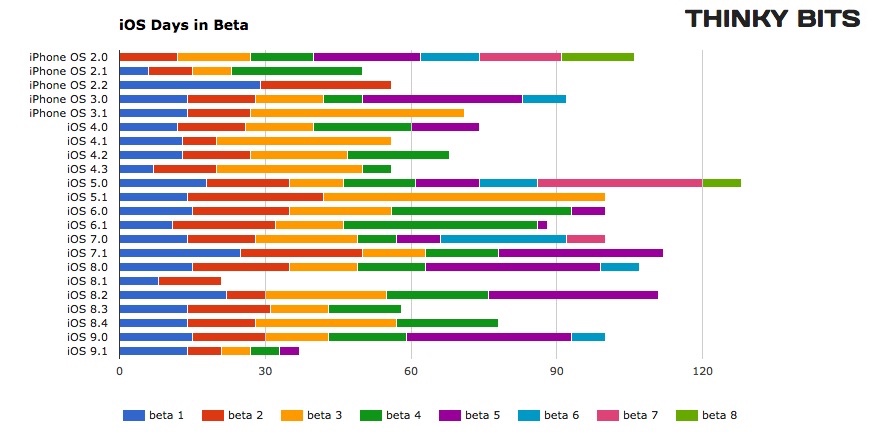
iOS Version Release Date History is a data visualization that shows how long each version of iOS has gone through beta versions. I really like this visualization by Will Hains and posted on his site Thinky Bits.
The design is still a work-in-progress, and it still requires me to go in and edit it every time a new beta is released, but it’s much less work than it used to be. And now, with the magic of Google’s Charts API, it’s interactive as well. The chart is 100% generated by Javascript in the browser, producing slick SVG images on-the-fly.
The stacked bar style clearly shows how long each version spend in the development process, and specifically shows how fast iOS 9.1 is being pushed through the system.
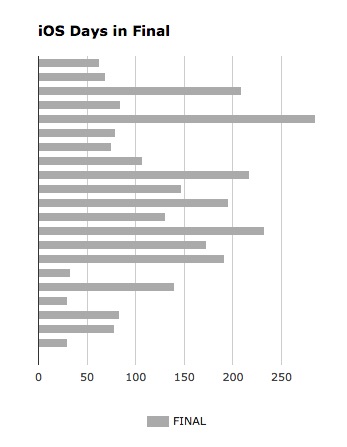
You can also see how long each version was the official current version in the wild, and the general trend to update iOS more frequently in Will's 2nd chart.