About
Randy Krum
President of InfoNewt.
Data Visualization and Infographic Design

Infographic Design

Infographics Design | Presentations
Consulting | Data Visualizations

DFW DataViz Meetup

Join the DFW Data Visualization and Infographics Meetup Group if you're in the Dallas/Fort Worth area!

Search the Cool Infographics site

Custom Search

Subscriptions:


Feedburner

The Cool Infographics® Gallery:

How to add the
Cool Infographics button to your:

Cool Infographics iOS icon

- iPhone
- iPad
- iPod Touch


Read on Flipboard for iPad and iPhone

Featured in the Tech & Science category

Flipboard icon

Twitter Feed
From the Bookstore

Caffeine Poster

The Caffeine Poster infographic

Entries in Viral (4)

Monday
Feb152016

What Happens on YouTube in 24 Hours?

What Happens On YouTube in 24 Hours? infographic

What Happens on YouTube in 24 Hours? is an infographic that Pexeso created after taking an in-depth look into daily uploads on YouTube during the month of October 2015. Pexeso is a company that is designed to help you find your videos from multiple platforms across the web so you can better understand your virality.

It’s no secret that video is quickly becoming the #1 priority for both social media platforms and marketers alike. As consumers, we spend more and more time glued to our smartphones watching one video after another. By 2017, it is estimated that video will account for 74% of all internet traffic in the world, making the upcoming year make or break time for any company that’s betting on video. 

As competition heats up, some of the most well-known platforms have rushed to report impressive statistics. While they may be staggering, such numbers tend to be cherry-picked and don’t necessarily show the full picture. 

We at Pexeso are committed not only to delivering the best possible service to our customers, but also bring more transparency to this inherently non-transparent market. As we independently crawl many popular sites, we've been able to uncover some remarkably interesting, in-depth insights that we want to share. 

I appreciate seeing most of the statistics visualized, but a couple of the visuals do not accurately represent the data.

  • The Video Uploads by Category took a creative spin on what should have been a quarter pie chart. By taking the slices out of a triangle instead, the area of the slices at the ends is oversized and is misleading to viewers.
  • The Languages visual of sections on the tongue, under represent the size of the values by only using the height in an odd shape. The lowest section where the tongue is narrower don't have enough area to accurately show the data.
  • The 3D stacked bar in the shape of a cake, way over emphasizes the 5% Taken Down by Users by also showing the area of the top of the cake.
  • The clock visual doesn't represent the data at all. It's confusing for readers to have evenly spaced ticks around the clock, but widely varying times in the text.
  • The citations for the data sources are missing from the infographic. They're listed on the landing page in text, but infographics are usually shared without the original text from the publisher.

Thanks to Lisa for sending in the link!

Monday
Jul282014

Viral Sharing Tactics of an Infographic

  Viral Sharing Tactics of an Infographic infographic

Making a cool infographic is one thing, sharing it and making it go viral is another. Luckily, the Viral Sharing Tactics of an Infographic infographic published by Piktochart gives some tips on how to make your cool infographic a hit!

Making your carefully crafted infographic go viral isn’t a dark science. It doesn’t just happen miraculously. You have to make it happen.

The key to a successful viral infographic lies not just in the content. Apart from designing a very good infographic, what you do with it after that plays a big role in making it go viral. You have to go the extra mile to publicize and enable others to publicize your infographic for you. There are many available platforms and tools to accelerate your viral campaign.

There’s some really good information included in here, and many of the tactics listed here are included in my Infographic Release Strategy from the Cool Infographics book.  Designing a good infographic isn’t enough.  You need to publicize and promote your design so people can find it and share it.

I would have liked to see more statistics behind their recommendations.  The only data included in the design is the Google Trends chart of searches for the word ”infographic”, which is a very impressive trend!  The design should have also included a copyright, and the URL to the infographic landing page on the Piktochart site.  I love the “Click to Tweet” pre-written sharing element on the landing page!

Piktochart is an online infographic design tool, similar to a vector graphics software application.  You can find this tool listed along with others on the Cool Infographics Tools page.  I love to see that they used their own tool to design this infographic!

Thanks to Rachel for sending in the link! 

Thursday
Jul042013

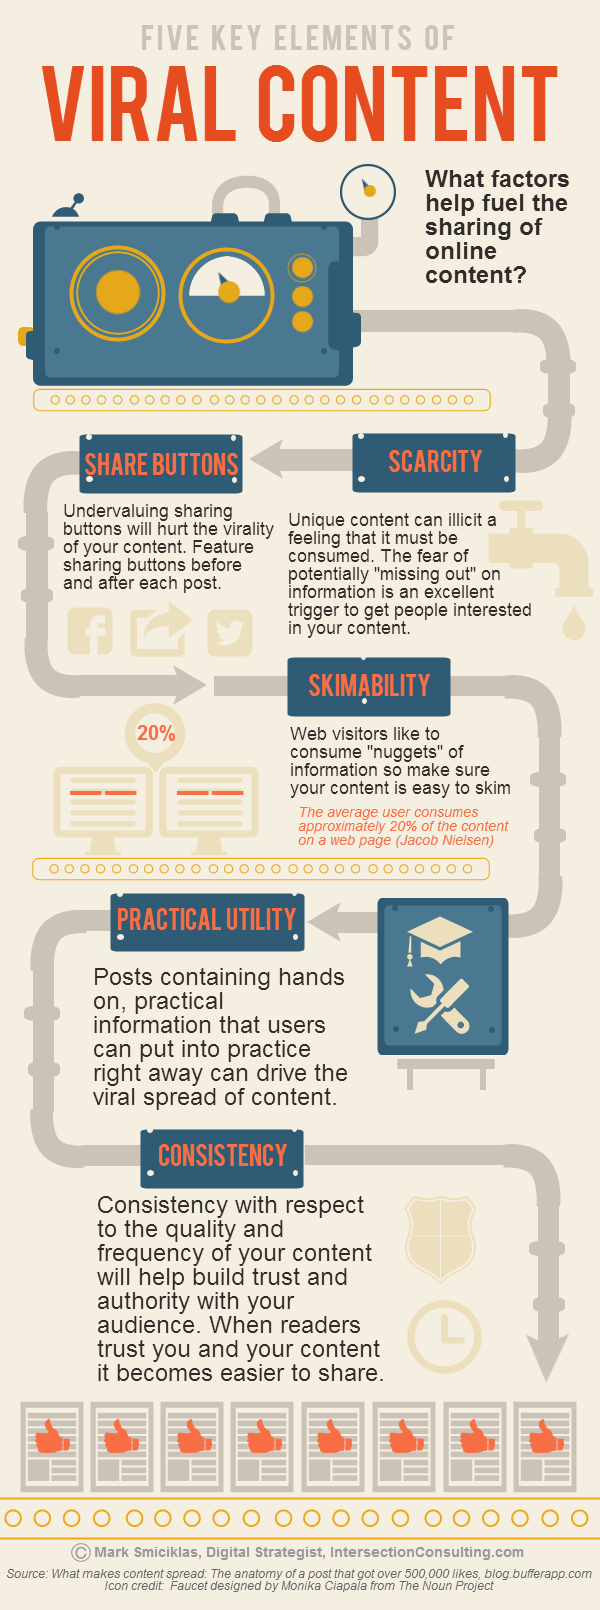
5 Key Elements of Viral Content

Mark Smiciklas from Intersection Consulting and author of The Power of Infographics, designed this helpful infographic The Five Key Elements of Viral Content.

The goal of every content marketer is to have his/her information shared across digital channels by their audiences. This is often easier said than done. What factors contribute to people sharing the content they consume online?

In researching the content for this infographic I came across a post in my Delicious archive that helps answer this question. Leo Widrich over on the Buffer Blog wrote a great post about what makes content spread. In it, he analyzes some of the elements that helped one particular blog post get over half a million likes. He also references an interesting research paper about what makes online content go viral.

This infographic highlights five key elements of viral content: scarcity, share buttons, skim-ability, practical utility and consistency. Are there any others you would add? The comments are yours.

Originally posted on Social Media Explorer

I would like to see the URL links to the sources and to the infographic landing page in the footer of the design so they travel with the infographic image as it gets shared across the Internet.

Wednesday
Jun062012

Gymkhana: The Infographic

DC Shoes - Gymkhana Infographic

Gymkhana: The Infographic, is a design collaboration between InfoNewt (my company) and the design team at DC Shoes.  Gymkhana has become a mega-viral hit series of YouTube videos showing Ken Block and his rally car racing through different locations and performing many cool driving stunts.  There have been four Gymkhana videos released on YouTube in the last four years with over 135 million views combined, and Gymkhana 5 is expected this summer!

The DC Ken Block Gymkhana Project is a viral phenomenon with well over 135 Million views worldwide and a collection of more than 40+ videos. The Gymkhana franchise has won countless awards including top rated, most shared video series and most recently received the award for #1 viral video ad of 2011.

Created as a fun way to check out all things Gymkhana, the Infographic displays highlights, amazing stats and facts about the Gymkhana YouTube videos. “The fun just keeps on rolling along,” said Ken Block, the Gymkhana star and co-founder of DC Shoes. “The Gymkhana Infographic puts together some outstanding facts. Even I didn’t know that the Ford Fiesta used in Gymkhana 4 had 9 times the horsepower as my first car, a 1984 Toyota Corolla station wagon. Astounding!”

The infographic brings new viewers up to speed leading up to the release of Gymkhana 5, and gives fans of the videos a bunch of behind-the-scenes information they can’t find anywhere else.

Thanks to the team at DC Shoes for a great project!