About
Randy Krum
President of InfoNewt.
Data Visualization and Infographic Design

Infographic Design

Infographics Design | Presentations
Consulting | Data Visualizations

DFW DataViz Meetup

Join the DFW Data Visualization and Infographics Meetup Group if you're in the Dallas/Fort Worth area!

Search the Cool Infographics site

Custom Search

Subscriptions:


Feedburner

The Cool Infographics® Gallery:

How to add the
Cool Infographics button to your:

Cool Infographics iOS icon

- iPhone
- iPad
- iPod Touch


Read on Flipboard for iPad and iPhone

Featured in the Tech & Science category

Flipboard icon

Twitter Feed
From the Bookstore

Caffeine Poster

The Caffeine Poster infographic

Entries in Visme (4)

Thursday
Mar312016

A New Visme: Huge Update to the Online Design Tool

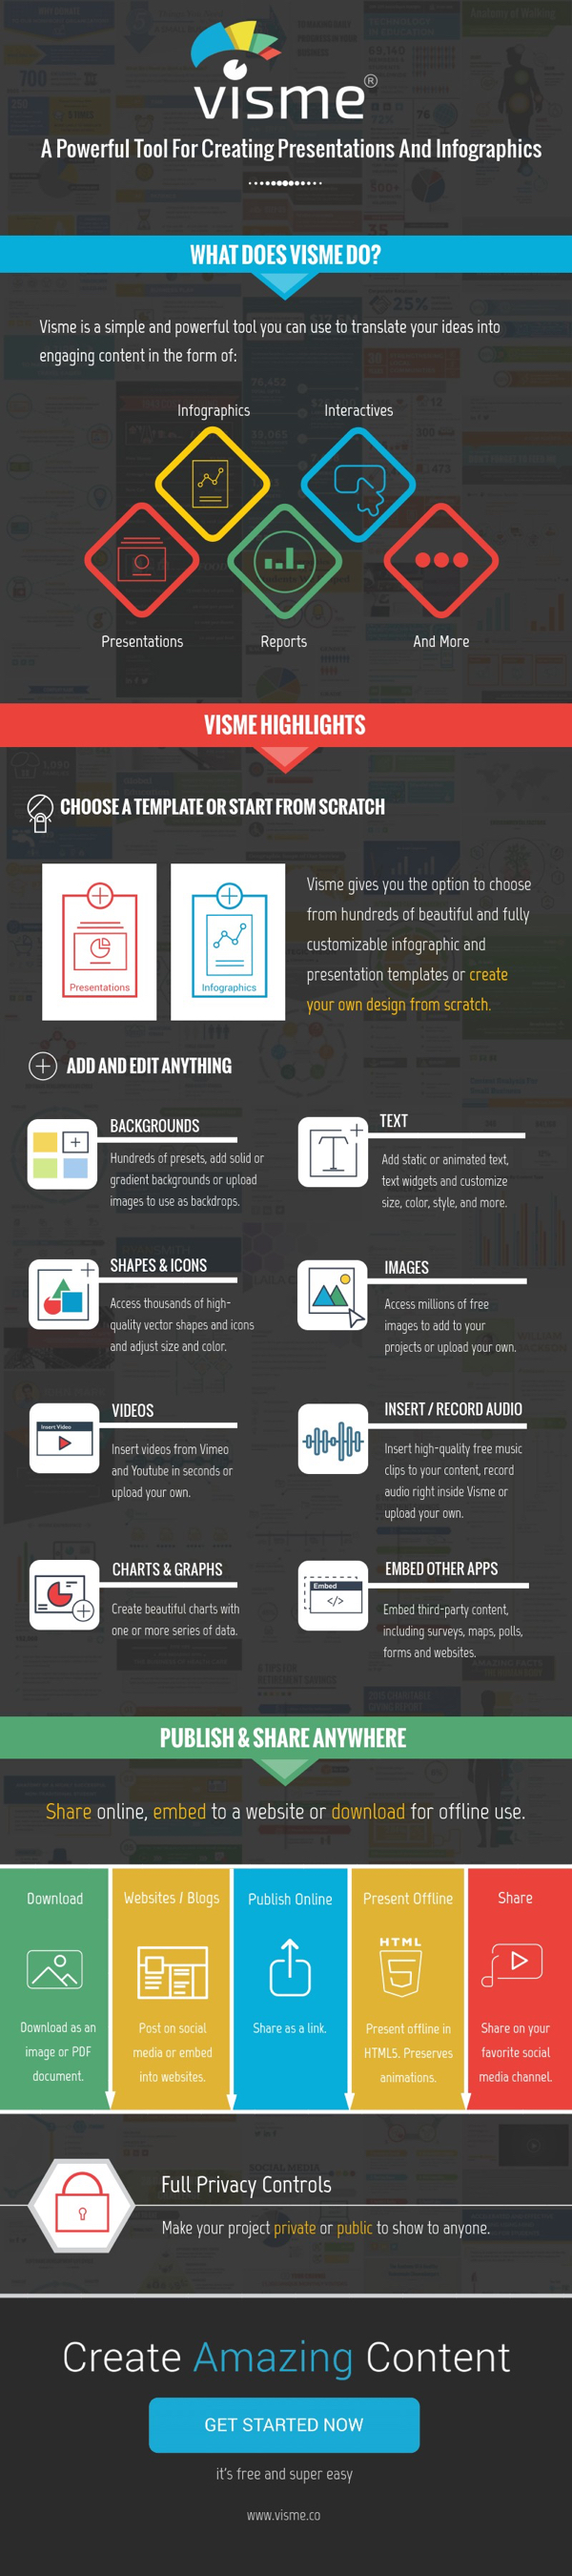
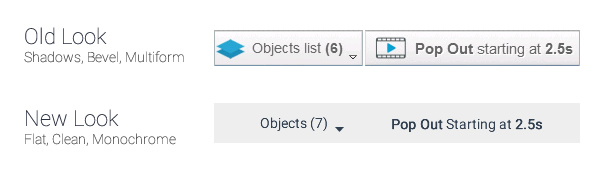
The new Visme is here. Following eight months of dedicated work to address more than 30 user requests, Visme now gives its users an even smoother workflow. By improving user experience, development infrastructure, and scalability, the new Visme enables faster deployment and increased productivity with a familiar interface.

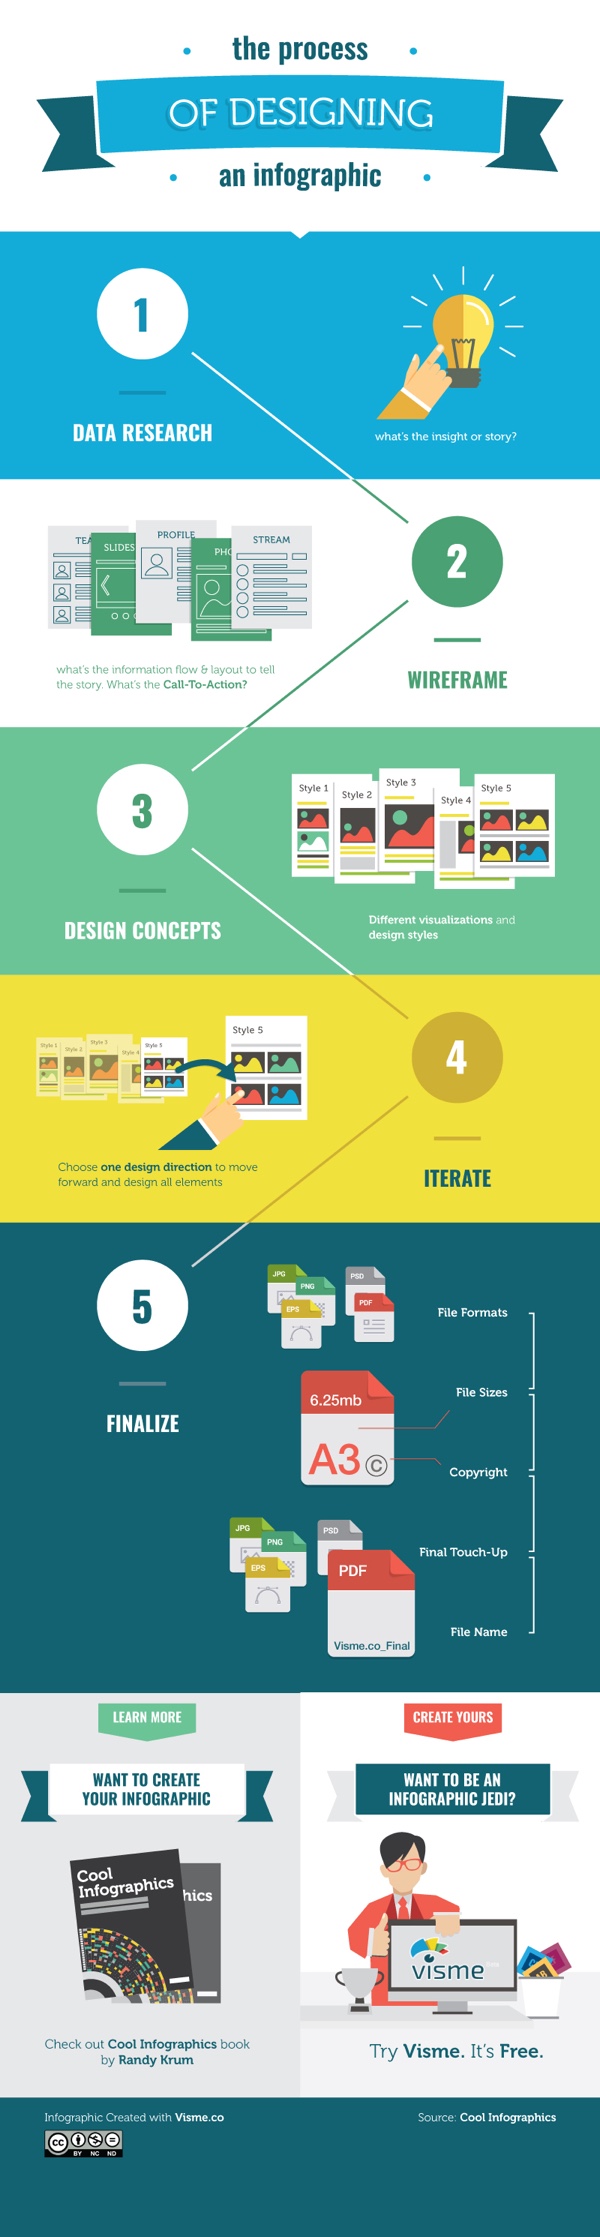
Of course, the best way for a design platform like Visme to share the new features is with an infographic designed using their own tool! You can see the infographic and all of the update features in this Visme blog post.

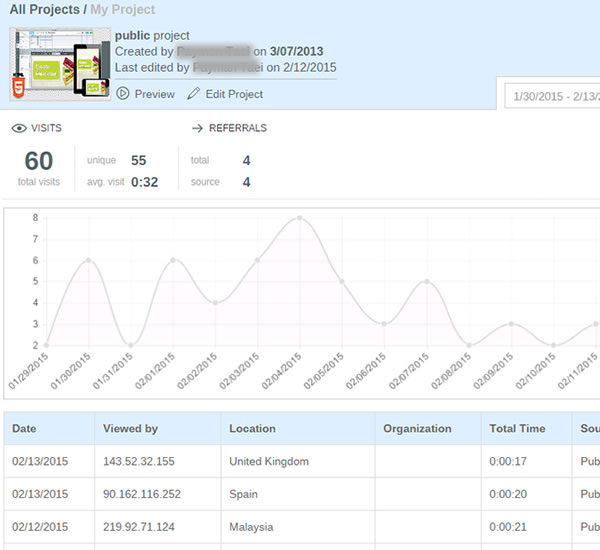
If you're not already familiar with Visme, it's an easy-to-use online visual content editor that allows you to create stunning presentations, reports, infographics, interactives, and more. Used by designers worldwide as their vector design platform that replaces the need for traditional software apps like Adobe Illustrator or Microsoft PowerPoint. With Visme, you can visualize stories and data, which is why it’s trusted by 300,000+ marketers, communicators, executives, educators, and nonprofits from 50+ countries.

With the upgraded Visme, you can:

  • Produce an alluring narrative with the revamped text editor and updated text widgets. Custom styling and padding, along with a spread of lively fonts, give your words an illustrative charm that bounces off the screen, transforming dull text blocks into something to see.

  • Move multiple objects and copy to them to slides to reorganize your story without hassle. No need for tedious work when you can duplicate and tweak rather than constantly starting anew or pasting too much and working backwards.

  • Create a global color palette to guarantee consistency throughout a complex project. This allows you to keep track of colors in a visual language in order to design quicker without guesswork or extra steps.

  • Choose from millions of free images to present a more striking take on your content. Don't spend hours online looking for the right picture and if you can even use it. Brighten up your work with ease and efficiency to grab your audience's attention without entering a labyrinth.

  • Record audio, upload your own or choose from a collection of high-quality music clips to strengthen a presentation with a narration or background music. Audio gives your content an extra level of exciting depth. Manage timing and fade control from one intuitive panel.

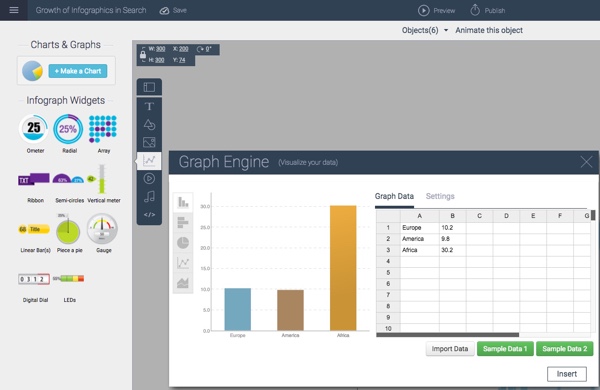
  • Expand your data storytelling tactics with new chart types and a selection of thousands of adjustable vector shapes and icons. Go far beyond standard and avoid being repetitive with new data visualization capabilities. You can even make them animated.

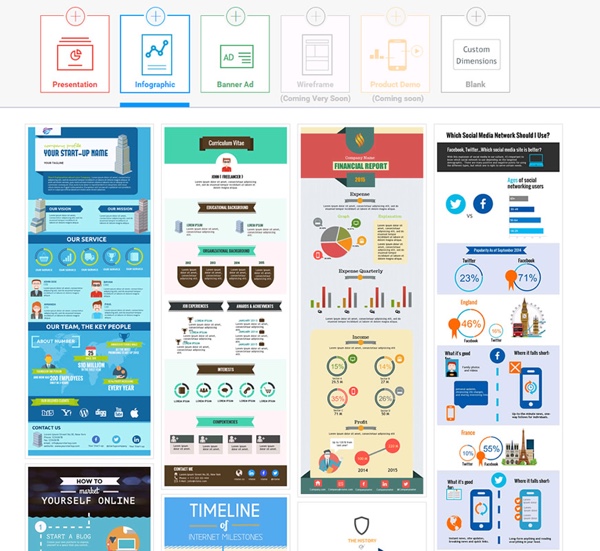
  • Get started quickly with a vastly expanded library of templates and themes, tailored for specific industries and purposes. You'll have the right look for exactly what you're doing.

I recently had the opportunity to interview Visme Founder Payman Taei in this webinar for Visme members, where he also demonstrated the new capabilities of the updated Visme design platform:

It's time to step up your game and make your presentations and infographics more impactful and effective. Try Visme for FREE, and when you're ready to subscribe, use the discount code VISME30 for 30% OFF for the lifetime of your account!

Friday
Nov062015

Giveaway: Visme Full Premium Subscription for One Year

I have ONE Visme Full Premium Complete Subscription to give away in November! I love this giveaway! Regular value $192

Register HERE by 11:59pm on November 30, 2015 to be entered.

A winner will be randomly selected on Dec 1st.

Easily create powerful Presentations and Infographics with full access to all of the premium features including infographic widgets, custom icons, templates, millions of free images, thousands of free vector assets, charting tools, private projects and engagement tracking for your content.

Check out the Visme site to see all of the features!

Tuesday
Jun162015

Visme 3.0 Design Platform Launches Improved User Interface

Visme Infographic Templates

Visme is an online design platform, and can be used to create infographics, presentations, banners, reports, and even resumes. With over 200,000 users, Visme is being used by many as a replacement for expensive desktop applications like Microsoft PowerPoint and Adobe Illustrator.

"Visme epitomizes everything we strive for. At the core we are a visualization tool and our mission is to simplify the ability for anyone to easily transform their thoughts and ideas into engaging visual content," - Founder Payman Taei

In April 2015, the team at Hindsite Interactive launched Visme 3.0, a complete redesign, moving to a cleaner, easy-to-use user interface. The redesign has made a major move towards flatter design elements that help users focus on the content they are creating without being distracted by the interface tools.

Visme Flat Design Interface Updates

If you’re not a professional designer that can invest in a high-end hardware and software setup or don’t have the time or budget to hire a professional, Visme is a great platform to create eye-catching visual content with minimal effort. You can start with one of the many professional templates, and then customize your design by changing colors, rearranging the layout, uploading your own images, inserting video, building simple data visualizations using the Graph Tool, or use any of the millions of free icons and images from the huge built-in library.

Specifically for infographics design, the built-in Graph Tool and Infograph Widgets can be very helpful. Although you may import more complex data visualizations created elsewhere, the Graph Tool let’s you build simple charts directly in your design by entering the data and editing the chart settings. This is a huge advantage over many other online design tools that only provide chart shapes and objects that you have to adjust manually to match your data. Accuracy of your data visualizations in an infographic is crucial!

Visme Graph Tool

Here you can see a simple area chart created with the Visme Graph Tool. Over 600 data points were uploaded to create this simple data visualization. Because it was built with the Graph Tool, the chart is editable as the data set continues to grow in the future. The design has been inserted here using the embed code created by the Visme platform to display the chart. As future updates are made to the chart on the Visme site, the most current version will always be displayed here. For infographics, you can update the data in your design, and every site that uses the embed code will always display the latest version of your design.

Original: http://my.visme.co/projects/growth-of-infographics-in-search-613ce1

 Personally, I’d like to see the Graph Tool expand into more visualization styles, and give the users more ability to customize the charts it creates. It’s pretty good with the simple charts, but I hope this is only the starting point for the Visme team. I hear that improvements to the Graph Tool are in the plan for release later this year.

Infographics are made to be shared, and the Visme tool gives you plenty of options. In addition to embed code for both animated and static sharing, you can also download your design as a static image file (JPG or PNG) or a PDF file for easy distribution.    You can also download as HTML5 version which would retain all interactivity of your live version and open locally in any browser without third party software or plugins.

Two other advantages of designing your infographics in Visme. First, you can keep your designs private, and only allow those that have the link to view your design. You can even password protect your design so only those with the link and the password can view your design. Second, you can see the analytics for your design in one place. This is a real challenge for tracking infographics online, and seeing the combined statistics of views and visits to your infographic is a fantastic feature. For everyone that shares your infographic on their own using the embed code, those viewer statistics are all gathered together in your Visme analytics dashboard.

Visme Analytics


Visme is free to everyone to try with many of the basic design tools. Paid plans start at just $6/month to unlock premium templates, along with the ability to manage privacy, download content, analytics and collaboration tools.

Special for readers of Cool Infographics, use the discount code VISME3 to get a lifetime 25% discount on any subscription.


Monday
Jun082015

The Process of Designing an Infographic

The Process of Designing an Infographic

The Process of Designing an Infographic is an interactive design that outlines my own infographic design process. My data visualization and infographics design company, InfoNewt, uses this process when designing infographics for clients, and I teach this process in my workshops and classes. The team at Visme.co created an interactive infographic version of it using the Visme design platform. Visme.co is a fantastic online design platform for infographics, presentations, reports and more.

Most of my designs follow this 5-step process:

  1. Data Research - Start with the data. What's the insight or story?
  2. Wireframe - Wireframe your story before you start any design work 
  3. Design Concepts - Experiment with design ideas by creating rough concepts that visualize your data in a handful of different ways
  4. Iterate - Choose one design direction or combine a few different ideas from your concepts.
  5. Finalize - The final step is to finalize your design with the appropriate Copyright or Creative Commons license, and export the final design to a few different file formats as necessary. 

One of the advantages of using Visme as the platform to design your infographic is that you can create interactive elements in your design. In this case, you can see the original interactive version on the Visme site, that includes additional information when you mouse over each process step. This is built in Javascript, and anyone can share the interactive version by using the embed code on their own website.

You can embed the interactive infographic on your own site by using this HTML code: