About
Randy Krum
President of InfoNewt.
Data Visualization and Infographic Design

Infographic Design

Infographics Design | Presentations
Consulting | Data Visualizations

DFW DataViz Meetup

Join the DFW Data Visualization and Infographics Meetup Group if you're in the Dallas/Fort Worth area!

Search the Cool Infographics site

Custom Search

Subscriptions:


Feedburner

The Cool Infographics® Gallery:

How to add the
Cool Infographics button to your:

Cool Infographics iOS icon

- iPhone
- iPad
- iPod Touch


Read on Flipboard for iPad and iPhone

Featured in the Tech & Science category

Flipboard icon

Twitter Feed
From the Bookstore

Caffeine Poster

The Caffeine Poster infographic

Entries in web (190)

Wednesday
May042011

Real Estate: Social Media Killed the Blog Star


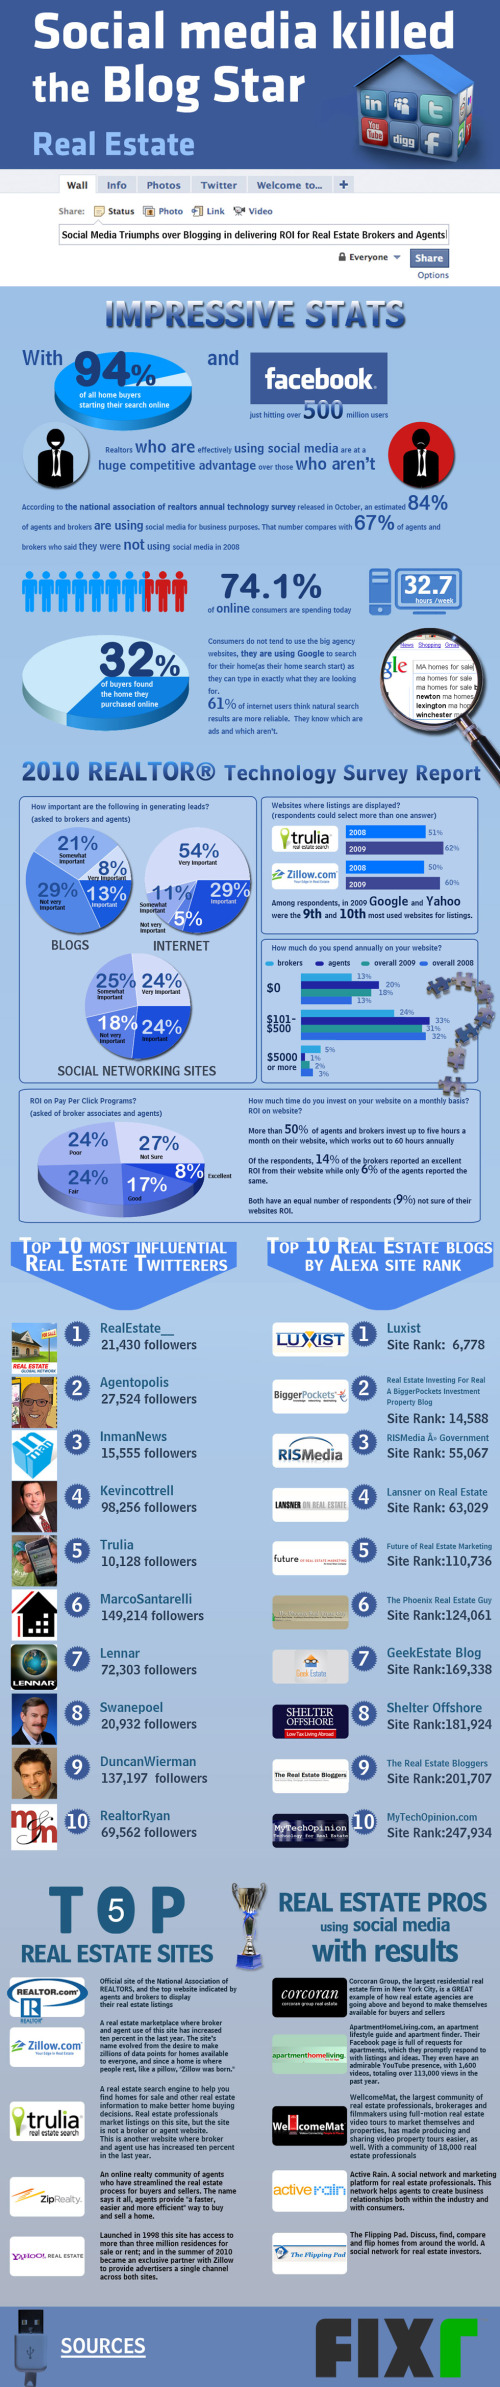
Another good infographic from Fixr.com about the how the real estate industry is changing.  Social Medai Killed the Blog Star: Real Estate looks at how buyers are finding their information online and who are the most influential blogs and real estate people on Twitter.

I like the use of company logos and Twitter profile images.  I also like that all of the data is built-in to the pie charts and bar charts to make it easier for the readers to comprehend.

The side-by-side Top 10 lists are interesting, but because they’re based on different measurements (followers vs. Alexa page rank), the graphic should give the reader some context of how to compare the different values.  Why do these lists support the overall message that social media is more important than blogging?

Some major technical errors as well.  Pie chart percentages should ALWAYS add up to 100%.  The pie charts here add up to 71%, 99%, 91% and 100%, which means that the visual of the slice sizes doesn’t match the data.  You never want your data visualizations to tell a story that isn’t supported by the data.

Thanks to Raul for sending in the link!

Tuesday
May032011

Demand Media - Breaking the Bank

Demand Media - Breaking the Bank is a cool infographic published on OnlineMBA.com by designer Ricky Linn.

The content itself in interesting, and I remember reading the Wired article listed in the sources.  I like that the infographic combines the process flow of content creation, but also visualizes relevant statistics about how big and profitable Demand Media has become.  Overall it tells a good story.

Found on SiliconValleyWatcher.

Tuesday
Apr122011

The Current State of Social Networks #infographic

From ignite, a social media agency, comes The Current State of Social Networks.

It goes without saying that Facebook is the network du jour, but even though the reigning champion’s user stats keep soaring, social networking as a whole might be leveling off. Nevertheless, there are still scores of other highly competitive social sites that are waxing and waning; and different networks and apps are more popular in specific geographic areas, with certain genders or age groups, and even among various social classes.

For example, Plaxo is the network with the most users over the age of 65. Facebook is more popular with women, but Digg and Reddit tend to be more popular with men. LinkedIn is the “richest” social network, but Plurk outranks it when it comes to well-educated users who have graduate degrees.

They have a ton of traffic data to work with, and this infographic does a good job of summarizing some of the key findings at the top level. 

Found on Mashable and Social Media Graphics

Thursday
Apr072011

The Map of the Internet

The Map of the Internet is an ambitious project from Peer 1 Hosting that maps the network of hosts and routing connections that are the foundation of the Internet.  Clicking on the image above takes you to the poster in an interactive zooming viewer so you can see the details.  You can also read about the making of the poster in this post on the Peer 1 Hosting blog.

It’s a layout of all the networks that are interconnected to form the internet. Some are run by small and large ISPs, university networks, and customer networks - such as Facebook and Google. It’s visual representation of all those networks interconnecting with one another, forming the internet as we know it. Based on the size of the nodes and the thickness of the lines, it speaks to the size of those particular providers and the connections. 

In technical speak, you’re looking at all the autonomous systems that make up the internet. Each autonomous system is a network operated by a single organization, and has routing connections to some number of neighbouring autonomous systems. The image depicts a graph of 19,869 autonomous system nodes, joined by 44,344 connections. The sizing and layout of the autonomous systems is based on their eigenvector centrality, which is a measure of how central to the network each autonomous system is: an autonomous system is central if it is connected to other autonomous systems that are central.

My apologies for being late posting this one here on the blog.  They were giving out free printed 24”x36” posters at SxSW in Austin, TX a couple weeks ago, but the high-resolution PDF is available from the Peer 1 Hosting site.

Thanks to Shobhita for sending me the information and the link!

Thursday
Mar242011

Google's Collateral Damage


Another cool flowchart-style infographic by Jess Bachman for SEOBook.com.  Google’s Collateral Damage visualizes how Google’s evolving search algorithm is impacting the Web.

Google’s PageRank worked well until people realized what drove search & how to optimize for it. But the web moves much faster than the colleges do. A million spam pages are created every hour! Thus Google’s relevancy algorithms have grown in complexity over the years.


Thursday
Feb102011

2010 Facebook vs. Twitter Social Demographics

Facebook vs. Twitter is a good one from DigitalSurgeons.com.  They’ve done a great job of compiling the data from at least 10 different sources, to create an overall profile of the standard Facebook and Twitter users.

One has over 500 million users, the other just over 100 million. But who are they and what’s their behavior? What’s their value to a brand? How old are they? What’s their education? How much do they make? Just exactly what does the Facebook vs. Twitter landscape look like? Good questions. Here’s how we see it.

The use of the Polar Area Chart (also called a Nightingale Rose Diagram) does a good job of breaking down the demographic information into 11 different categories.  Unlike a standard pie chart, each slice is the same angle, and only the radius of each slice conveys value.

The difficulty in using this visualization style, is that it’s hard for the reader to compare between the two diagrams.  Does Twitter or Facebook have more logins by mobile device?  The reader can’t tell from the visuals, and they have to move back and forth reading the values to tell the difference.

One possible alternative would have been to put everything into one Polar Area Chart, so for every section the Facebook slice is next to the Twitter slice.  That way you could visually compare the two without reading the numbers or comparing between two charts.

Thanks Matt for sending in the link!

Monday
Jan312011

Google's Periodic Table of APIs & Developer Tools

From the Google Code site, the Periodic Table of Google APIs & Developer Tools is a cool layout of the tools available.  It’s actually well designed table, so each element is clickable, and takes you to the information page about that particular API.

They’re color-coded by category, but many of them belong to multiple categories.  For example, the Google Analytics is part of Data APIs, Ads and Tools.  If you mouse over the category names at the top, all of the members of that category are highlighted below.

Found on Twitter through @illuminantceo

Monday
Dec272010

The Blog Tree


The Blog Tree is growing on me.  A project collaboration between JESS3 and Eloqua, it uses the tree metaphor to map out the post prominent Marketing blogs by traffic size and category.

The Blog Tree maps out the marketing blog structure from the most prominent blogs at the roots through the leaves which are shown in different colors to indicate the size of each blog’s readership. The positioning and color of the blogs were determined using publicly-available visitor data about each web site on compete.com.

This has gotten a lot of traffic on its own, and they are experimenting with an interesting call to action for viewers.  

As for those blogs not yet portrayed on the infographic, Eloqua invites and encourages their authors to tag The Blog Tree infographic on Eloqua’s Facebook account in order to be included in future versions and receive an official “Blog Tree” badge for their site.

Where’s the infographic blog branch?

Tuesday
Nov022010

Client Infographic: The Empowered E-Patient


The Empowered E-Patient is a recent project InfoNewt (my company) did for the Path of the Blue Eye Project.  The statistics are compelling, and certainly support that e-patients are now mainstream.

In 2000, the Pew Internet and American Life Project found that 25% of Americans searched online for health information.  Today, 61% rely on the Web for medical and health content.  Americans’ growing reliance on Dr. Google and Nurse Yahoo! has led to profound changes in how health organizations and providers relate to and communicate with consumers.

Notably, this infographic provides information on e-patient social media communications from a Project-produced research report, “Communicating with the Empowered E-Patient.”  This report is available free of charge to individuals making regular contributions to the Project’s knowledge community, Living the Path.  Learn more about how to access this report here.


One of the challenges was defining not only what is an e-patient, but also what is the correct term to refer to these people looking up medical information online.  We ended up using Google to determine which terms are used most commonly, and the title ‘e-patient” was clearly the term used most often.

Thanks to Fard and the team at Enspektos.com.  There’s much more information available at the Path of the Blue Eye Project.

Thursday
Oct282010

Google(graphic): Is Google a Monopoly?

Scores.org brings us Is Google a Monopoly? designed by Jess Bachman.

Google has a dominate market share of a very important gateway; internet search.  Can they stay impartial when they have their own products to pitch?  Whether or not they are a monopoly is up to the government and the best way to predict the future is to look to the past.  Examining these four historical monopolies, and their outcomes, should give us a better sense of Google’s fate.