About
Randy Krum
President of InfoNewt.
Data Visualization and Infographic Design

Infographic Design

Infographics Design | Presentations
Consulting | Data Visualizations

DFW DataViz Meetup

Join the DFW Data Visualization and Infographics Meetup Group if you're in the Dallas/Fort Worth area!

Search the Cool Infographics site

Custom Search

Subscriptions:


Feedburner

The Cool Infographics® Gallery:

How to add the
Cool Infographics button to your:

Cool Infographics iOS icon

- iPhone
- iPad
- iPod Touch


Read on Flipboard for iPad and iPhone

Featured in the Tech & Science category

Flipboard icon

Twitter Feed
From the Bookstore

Caffeine Poster

The Caffeine Poster infographic

« Aflac Brunch Commercial #BadDataViz Error | Main | Design Better Charts in PowerPoint Class on Skillshare »
Tuesday
Feb062018

The ICO Explosion of 2017

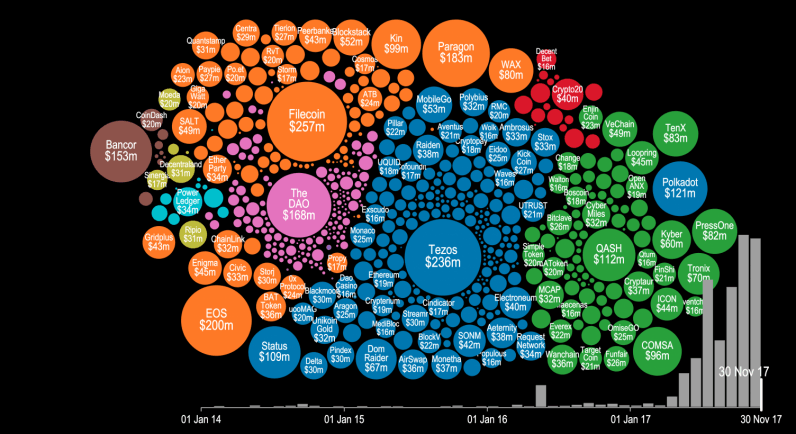
4 Years of ICO Activity infographic

ICO, or Initial Coin Offering, is a method of fundraising that doesn't sell equity of the company, but selling things called "tokens" or new forms of cryptocurrency. The method has been around for years, but the actual boom didn't start until mid 2017.The 4 Years of ICO Activity infographic from The Next Web shows a summary of the investments made. The video version below gives a more detailed timeline of when and where the companies obtained their investments.


Token sales and initial coin offerings (ICO) were certainly the hottest buzzwords of the year for thousands of recreational cryptocurrency enthusiasts and seasoned investors alike. But have you ever wondered precisely how much money was poured into this trend this year? There’s a visualization that can give you an idea.

Cryptocurrency startup Elementus has compiled a nifty animated visualization that shows every token sale that has successfully raised at least $100,000 since 2014. The graph also displays the entire cashflow that went into these ICOs, with detailed month-by-month information for the past four years.

As you will notice in the video below, following some minor activity for the first three years, all hell breaks lose around May 2017. You can see tens of ICOs kick off around the same time, securing millions in financial backing from cryptocurrency enthusiasts and investors.

To put all of this data together, Elementus went straight to the source and collected this information first-hand, gleaning the figures directly from the Ethereum and Bitcoin blockchains.

We searched for every token, crowdsale, and multisig wallet we could find,” wrote Elementus founder and UPenn adjunct lecturer Max Galka. “We then identified the corresponding owners and added up the total amount of contributed funds – taken either from the blockchain itself or as reported by the fundraiser.”

Found on thenextweb.com

PrintView Printer Friendly Version

EmailEmail Article to Friend

Reader Comments (8)

Amazing look your infographics about bitcoin ................................
February 14, 2018 | Unregistered Commenterpeter jhone
Incredible graphic, although the soundtrack was lacking... (Money by Pink Floyd perhaps?)
I'd really like to see a tutorial on how it was created.

THANKS!
February 21, 2018 | Unregistered CommenterBob Russell
Amazing look your infographics about bitcoin..
Thanks for share
March 28, 2018 | Unregistered CommenterBhaskar
Awesome information provide by its ICO Activity blog ......................................................
April 2, 2018 | Unregistered Commenterpeter jhone
Great infographics, just amazing. The best explanation on 4 years ICO actvity
April 23, 2018 | Unregistered CommenterMarko
Very Nice infographics , just amazing.
May 7, 2018 | Unregistered CommenterSam Davies
It's a very good information about the ICO Explosion, Thanks for posting...
May 17, 2018 | Unregistered CommenterIGC
It's a very good information about the ICO Explosion, Thanks for posting...
May 25, 2018 | Unregistered CommenterUjwal Pandit
Editor Permission Required
While we are migrating to a new site design, you must have editing permission for this entry in order to post comments.