About
Randy Krum
President of InfoNewt.
Data Visualization and Infographic Design

Infographic Design

Infographics Design | Presentations
Consulting | Data Visualizations

DFW DataViz Meetup

Join the DFW Data Visualization and Infographics Meetup Group if you're in the Dallas/Fort Worth area!

Search the Cool Infographics site

Custom Search

Subscriptions:


Feedburner

The Cool Infographics® Gallery:

How to add the
Cool Infographics button to your:

Cool Infographics iOS icon

- iPhone
- iPad
- iPod Touch


Read on Flipboard for iPad and iPhone

Featured in the Tech & Science category

Flipboard icon

Twitter Feed
From the Bookstore

Caffeine Poster

The Caffeine Poster infographic

Entries in investment (4)

Tuesday
Feb062018

The ICO Explosion of 2017

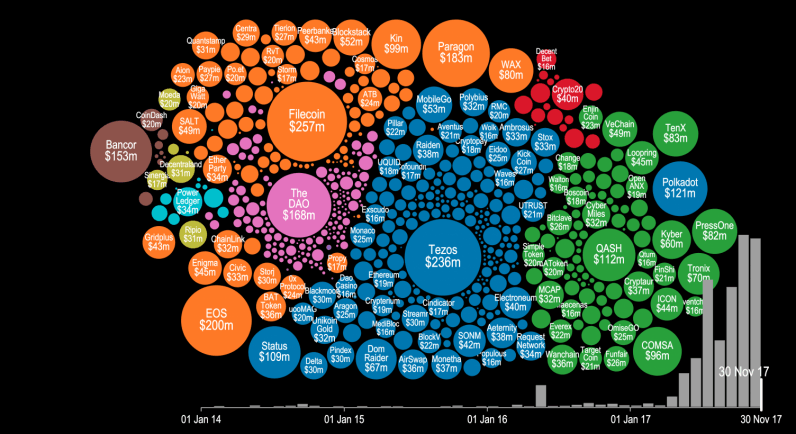
4 Years of ICO Activity infographic

ICO, or Initial Coin Offering, is a method of fundraising that doesn't sell equity of the company, but selling things called "tokens" or new forms of cryptocurrency. The method has been around for years, but the actual boom didn't start until mid 2017.The 4 Years of ICO Activity infographic from The Next Web shows a summary of the investments made. The video version below gives a more detailed timeline of when and where the companies obtained their investments.


Token sales and initial coin offerings (ICO) were certainly the hottest buzzwords of the year for thousands of recreational cryptocurrency enthusiasts and seasoned investors alike. But have you ever wondered precisely how much money was poured into this trend this year? There’s a visualization that can give you an idea.

Cryptocurrency startup Elementus has compiled a nifty animated visualization that shows every token sale that has successfully raised at least $100,000 since 2014. The graph also displays the entire cashflow that went into these ICOs, with detailed month-by-month information for the past four years.

As you will notice in the video below, following some minor activity for the first three years, all hell breaks lose around May 2017. You can see tens of ICOs kick off around the same time, securing millions in financial backing from cryptocurrency enthusiasts and investors.

To put all of this data together, Elementus went straight to the source and collected this information first-hand, gleaning the figures directly from the Ethereum and Bitcoin blockchains.

We searched for every token, crowdsale, and multisig wallet we could find,” wrote Elementus founder and UPenn adjunct lecturer Max Galka. “We then identified the corresponding owners and added up the total amount of contributed funds – taken either from the blockchain itself or as reported by the fundraiser.”

Found on thenextweb.com

Monday
Jul152013

The Investfographic

Investfographic

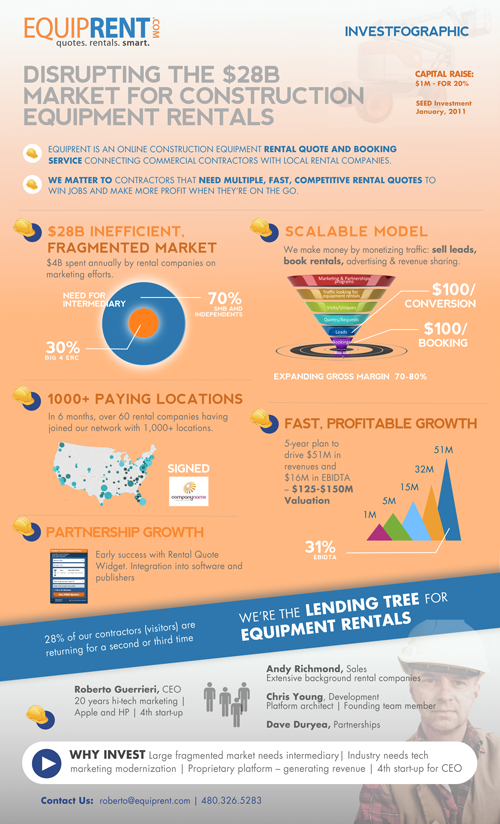
The Investfographic from EquipRent.com is the infographic they designed in-house to share with potential investors. Visual aids and infographics are becoming a valuable tool for companies to communicate with potential investors and shareholders.  Consider this to be a visual elevator pitch.

Using an “InvestFoGraphic” to raise capital

As a serial entrepreneur, I am always looking for an edge that makes a company standout and be noticed during capital raising times.

With the advent of new software tools like Prezi to boost your presentations, we decided to creatively put together a colorful investment infographic handout that completely complied with our goal of keeping our story concise, relevant, and exciting. The typical handout (1-page executive summary) that we had previously given VCs was heavy on words explaining in great detail what our company did and how successful we had been. This new graphic handout was riddled with bold and exciting claims about our company and our industry. The underlying theory behind using the infographic was to hook them first, grab their attention and then be ready to talk business. 

The exciting news is that we are now in final discussions with several investor groups to close our funding. We know the infographic wasn’t the main reason for getting to this final phase, but we do know that differentiating yourself makes you more memorable and shows investors you and your company plan on being different than the massess.

Remember the advice that the great Rod Stewart gave years ago:  Every picture tells a story, don’t it!

The team at EquipRent uses the design as a talking point at investor events.  They found it much easier to point out the visuals and discuss each point with their investors.  They shared with Cool Infographics, a few of the comments made by investors after seeing the design:

  • “I can quickly see what is different about this company than reading a typical one-page executive summary.”
  • “I have never seen anyone use an infographic for investor purposes,  other than to distinguish market trends.”
  • “Definitely sets you a part…like a cool and different resume.”

Thanks to Nate for sending in the link!

Monday
Jul082013

How Startup Funding Works

How Startup Funding Works infographic

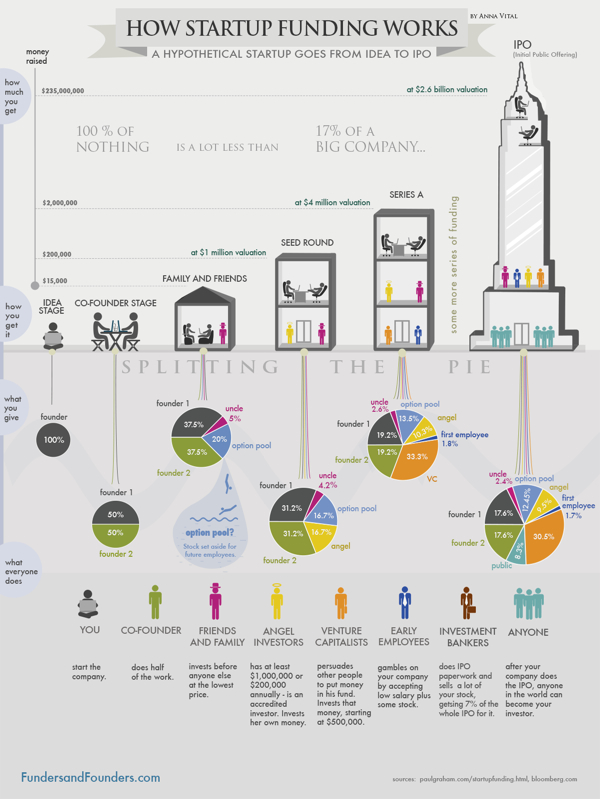
How Startup Funding Works from Funders and Founders co-founder Anna Vital does a great job of visualizing the split of equity at different stages of a company’s life.

A hypothetical startup will get about $15,000 from family and friends, about $200,000 from an angel investor three months later, and about $2 Million from a VC another six months later. If all goes well. See how funding works in this infographic:

Is dilution bad? No, because your pie is getting bigger with each investment. But, yes, dilution is bad, because you are losing control of your company. So what should you do? Take investment only when it is necessary. Only take money from people you respect. (There are other ways, like buying shares back from employees or the public, but that is further down the road.)

This is a great design that uses pie charts correctly and effectively!  This is in contrast to the many designs that use pie charts inappropriately.  This is a great example of a visual explanation that uses a combination of data visualization, illustration and text to tell a clear story.

The color coding is also effective, but for some reason they didn’t color the co-founder icon character green to match his portion of the pies.  The URL link to the original infographic landing page is also missing in the footer, so it makes it hard for readers to find the full-size original version when they see it posted on other sites.  People aren’t always good about creating links back to the original, so the URL should be included in the infographic image file itself.

Friday
Aug172012

The Awesome Tower of Beer!

Roth IRA The Awesome Tower of Beer infographic


The High Life in a new infographic from RothIRA.com that visualizes the awesome tower of beer you could buy if you were to save just $1 per day starting at age 25.

Getting older has its benefits—how about all the beer you can drink? All it takes is a dollar a day (and a really, really large fridge).

Want to learn more about a Roth IRA?

Designed by InfoNewt (my company), this design follows the strategy of telling one story really well.  There are hundreds of charts online showing the power of compound interest and why people should invest early for retirement.  We took a different approach to put the power of those savings into terms that young adults are more likely to relate to…BEER!

Thanks to the team at RothIRA.com for being great to work with!