About
Randy Krum
President of InfoNewt.
Data Visualization and Infographic Design

Infographic Design

Infographics Design | Presentations
Consulting | Data Visualizations

DFW DataViz Meetup

Join the DFW Data Visualization and Infographics Meetup Group if you're in the Dallas/Fort Worth area!

Search the Cool Infographics site

Custom Search

Subscriptions:


Feedburner

The Cool Infographics® Gallery:

How to add the
Cool Infographics button to your:

Cool Infographics iOS icon

- iPhone
- iPad
- iPod Touch


Read on Flipboard for iPad and iPhone

Featured in the Tech & Science category

Flipboard icon

Twitter Feed
From the Bookstore

Caffeine Poster

The Caffeine Poster infographic

Entries in animation (9)

Tuesday
May212013

DNA Explained

BBC Knowledge Explainer DNA from Territory on Vimeo.


An animated visual explanation of DNA found on creativeblog.com.

BBC Knowledge and Learning is exploring a wide variety of topics from social history to science in a series of three-minute online Explainer documentaries, and commissioned Territory Studio (territorystudio.com) to produce an animated film on the subject of DNA.

Three minutes is a short time to explore a subject where most doctorates only scratch the surface, so writer Andrew S. Walsh teamed up with molecular biologist Dr Matthew Adams to distil the script down to the most fundamental elements required to understand not only DNA’s form and function but how our understanding of these discoveries has affected the wider world. While this length may feel restrictive, the team found that this limitation acted as a lens, focusing the piece on the essentials.

The Explainer series is designed to intrigue and inform, encouraging those who discover the documentaries to further explore through links to additional information found on the BBC website.

Thanks to Jordan from sayitvisually.com for sending in the link!

Thursday
Apr042013

How Far is it to Mars?

How Far is it to Mars? motion infographic

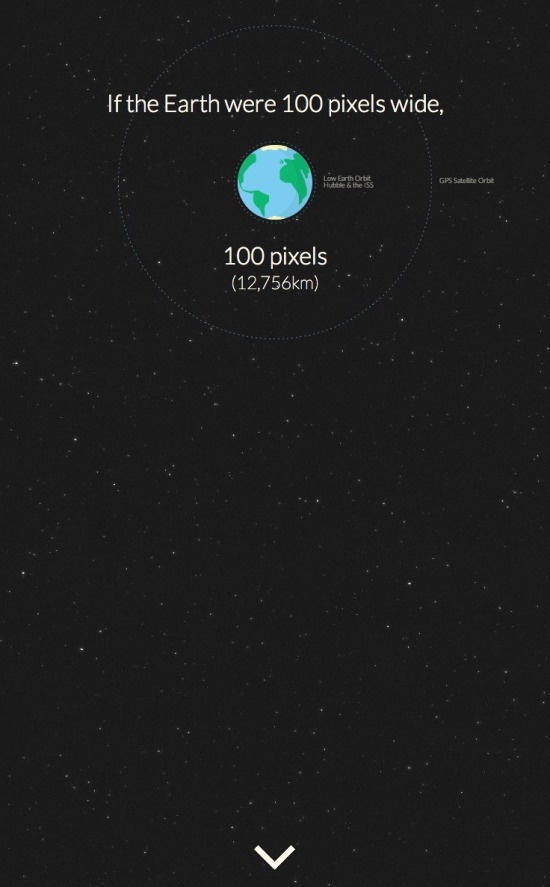
How Far is it to Mars? by David Paliwoda is a fantastic animated, interactive infographic website that shows the viewer the scale of the distance to the Moon and to Mars as measured in pixels.  David calls this a motion-infographic.

Click the image above to see the animated site.  Very cool! 

Found on Daring Fireball

Wednesday
Mar132013

Beautiful Animated Wind Maps

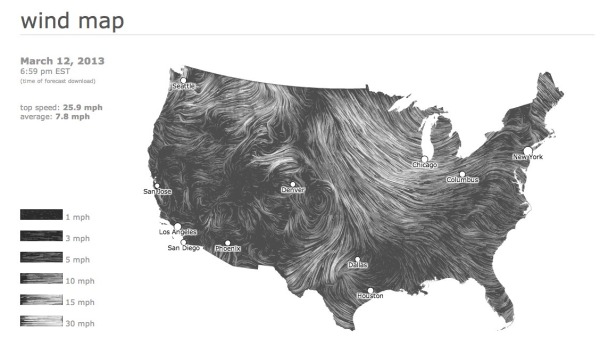
The static image above doesn’t do these maps justice.  Go see the Wind Map on the Hint.fm site to truly appreciate the design work from artists Fernanda Viégas and Martin Wattenberg.

An invisible, ancient source of energy surrounds us—energy that powered the first explorations of the world, and that may be a key to the future. This map shows you the delicate tracery of wind flowing over the US. 

The animation is mezmerizing, and the interactive piece allows you to click-to-zoom in closer to any part of the map to see much more detail in a specific region.  The main page shows the map based on the most current weather information, but the Gallery page has some snapshots linked to specific points in time (like Hurricane Sandy).  I love that even the speed legend on the side is animated!

You can also buy a poster version as an art print.

Thanks to Jeff Jarvis for sharing this on Google+!

Thursday
Jan172013

The Cheetah Animated Infographic

The Cheetah Animated Infographic

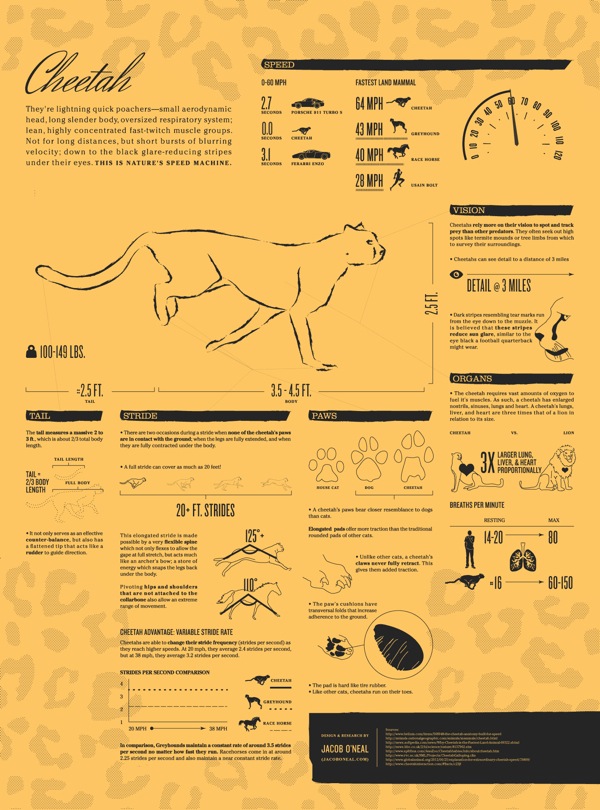
The Cheetah infographic introduces to you nature’s speed machine from Jacob O’Neal (jacobneal.com). Learn about how each body part is important to the Cheetah and why you don’t want to be on this mammal’s menu.

Did you know that cheetahs can accelerate from 0 to 60 MPH faster than a Ferrari? The amazing cheetah is the perfect example of natural specialization. They’re made for speed. Such a beautiful animal deserves a closer look!

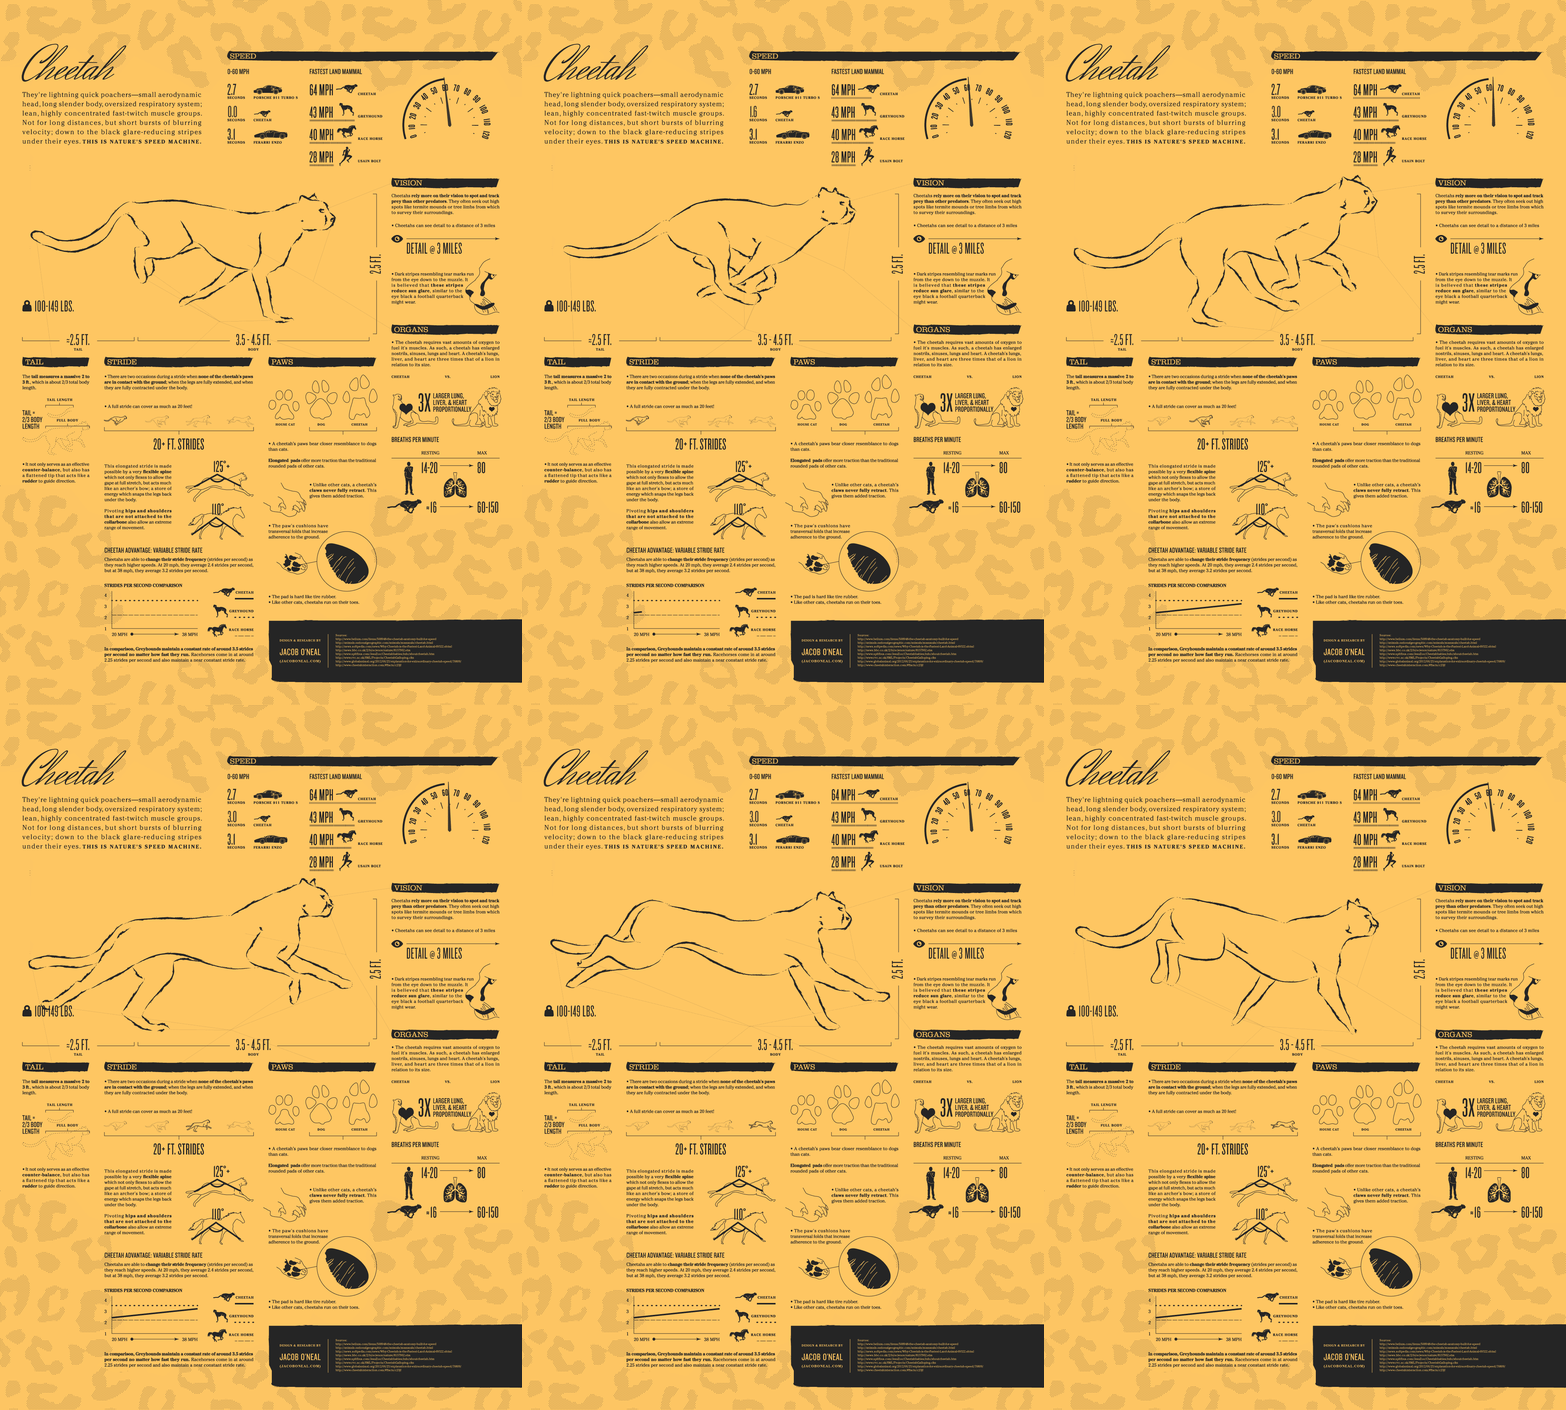
This is definitely a cool infographic design!  I really like this use of the animated GIF image file format.  Seriously!  I REALLY like this design.  Animated GIFs have been used and abused for decades, but the use of animation here is done in a way that is very visually appealing.  It actually adds to the value of the content, and catches your attention.

One issue with animated GIF image file infographics is social sharing.  Not all social media and photo sharing services can support the animated format, so you also need a static JPG image as a backup for anyone that want to share with those service.

Thanks to Chris for sending in the link!

Tuesday
Dec112012

The Ultimate Guide to Secret Santa

The Ultimate Guide to Secret Santa infographic

The Ultimate Guide to Secret Santa is a fun design for Christmas from MoneySupermarket.com in the UK (so the currency amounts are in British Pounds).  This office traditional strikes fear into many employees that fear getting the gift wrong.

Oh, the joys of working in an office at Christmas time.  Festive decorations, the office party and of course the exchange of “Secret Santa” presents make corporate Yuletide a truly eventful experience. 

Secret Santa involves the anonymous exchange of cheap gifts at Christmas time, typically between office workers.  It is a fun test of your resourcefulness and innovation as you endeavour to buy a present that your colleague will either love, or will find ironically hilarious.  If you go for the humorous option however, it is important to ensure that your colleague will understand and appreciate the joke!

If you are struggling for inspiration this year, hopefully our Secret Santa infographic will provide some ideas.  If you’d rather not play this year and make some savings on your Christmas present budget, we still think you’ll enjoy what we’ve come up with…

The first thing you’ll notice about this design is that it’s an animated GIF file.  A flashback to 90’s web design, this has been pretty tastefully done to only animate the characters eyes to blink and the title text.  You don’t see this in infographic design very often, and I think it was very well done here.

Both a copyright statement and the URL to the original infographic landing page should have been included in the footer space.

Thanks to Paul for sending in the link!


Tuesday
Jul312012

Evolution of the F1 Car: Video & Infographic

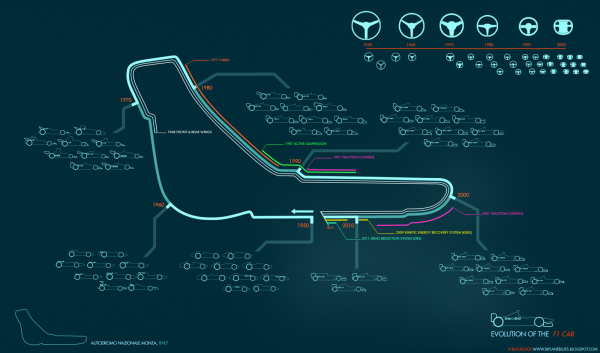
This is totally cool!  Here is an infographic animation created by Rufus Blacklock of his infographic Evolution of the F1 Car. You can find his original video on biplaneblues.blogspot.com.

All done :) here you can watch 60 years of F1 design condensed into a minute. Each car is the winning chassis from the respective seasons. The music is ‘Together’ by She.


Evolution of the F1 Car infographic 

Here is the original Evolution of the F1 Car infographic that the video was based off of. Found at biplaneblues.blogspot.com.

Woo finished! This map tracks the history of F1 cars across the circuit at Monza. Hopefully its clear enough… its my first infographic, let me know if you have any keen ideas to improve readability.

The cars are grouped into decades, around the track you can follow various innovations and driver aids, some which became banned. Top right is steering wheel development.


Friday
Jul062012

Informotion: Animated Infographics - Interview & Book Giveaway

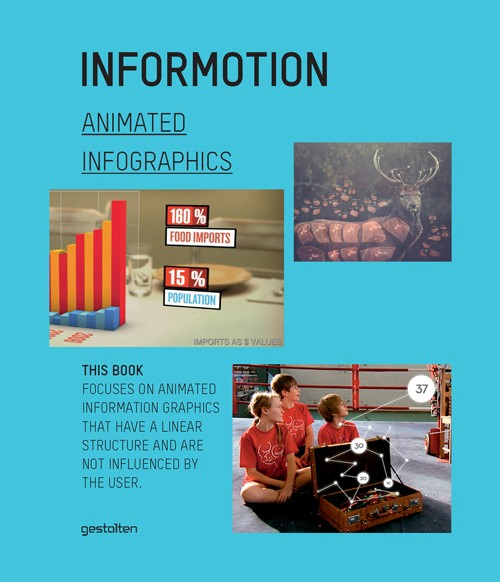
Informotion: Animated Infographicsfrom Informotion: Animated Graphics, Copyright Gestalten 2012

The Informotion: Animated Infographics book edited by Tim Finke, Sebastian Manger and Stefan Fichtel was just released from Gestalten, and only recently appeared in the U.S.  I also have a promotional copy of the book to giveaway!  So keep reading until the end to find out how to get a chance to win the book.
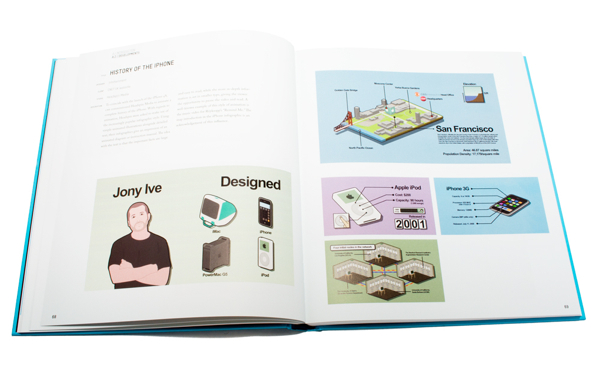
Informotion: Animated Infographicsfrom Informotion: Animated Graphics, Copyright Gestalten 2012

This is the only book I am aware of that focuses on infographic animation and video production.  The book covers topics like Forms of Representation, Storyboarding, Animation, Voice-Over Narration and Content.  The book also highlights at least 25 animated infographic videos, and takes a deep look at how they were made.

At the nexus of design and journalism, the field of information graphics offers some of the most exciting and dynamic work for creatives. Today, even more so than static versions, animated information graphics are serving to communicate complex correlations succinctly. The production of such animations on the basis of up-to-the-minute data is already common practice in select TV programs. Now, these moving formats are finding wider application in television and on the internet, as well as on an increasing number of mobile devices, and in public places. They can be seen in editorial contexts and in the areas of advertising and corporate communication.

Informotion is the first book to document the fundamentals needed to create compelling animated infographics and to explain them with numerous examples. It focuses on key aspects of visualizing data, current forms of information graphics, and future possibilities for moving images. The publication also outlines the factors that improve the viewer’s ability to absorb information.
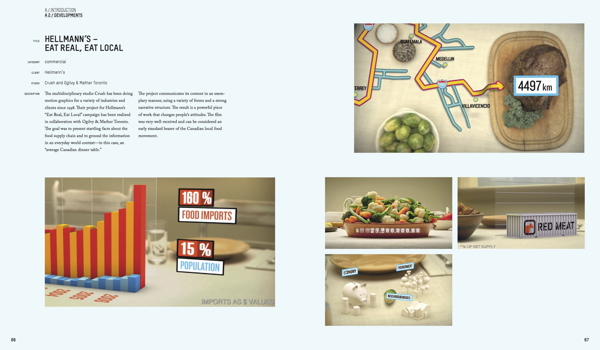

Informotion: Animated Infographicsfrom Informotion: Animated Graphics, Copyright Gestalten 2012


Sebastian Manger was kind enough to provide some of his time to answer a series of interview questions about the future of infographic videos and production of the book:

CI: What brought you, Tim Finke, and Stefan Fichtel together to collaborate on the book?

Sebastian

 Manger: Tim and I both studied communication design at the University of Applied Sciences in Potsdam near Berlin. Our collaboration on many projects during our studies welded us together as team, and so we decided to do our master’s thesis as a joint project as well. This thesis formed the initial basis for Informotion. During our research for the book we came into contact with Stefan Fichtel. We initially just wanted to interview him about his experiences in the field of information graphics, but we then wound up working with him more closely.

CI: You cover this briefly in the book, but how do you define the difference between data visualizations and infographics?

Sebastian

 Manger: Data visualization is mostly based on a very complex set of data, which is then transmitted by tools such as processing into a graphical representation. Examples can include user behavior in a certain context or the air traffic in a given airspace. In our opinion, an infographic is more concentrated on a particular piece of information that needs to be communicated. In contrast to data visualization, infographics often boil something down to one core message that is then conveyed.

CI: Who do you see as the primary audience for the book?

Sebastian Manger: The book is a guide for designing animated infographics. Therefore, the primary target group is, of course, designers who create those. But Informotion is actually also interesting for any designer who deals with the transfer of information through moving images because it deals with our general perception of animation. The book introduces the range of tools now available for implementing animated infographics and explains their appropriate use. 

In addition, Informotion is also very interesting for journalists. They can gain valuable insight into how the information they first researched can be processed into an animation. This insight can then help avoid misunderstandings in any future collaboration.

CI: How difficult was it to select the videos in the book and did you get support from the companies that produced the videos?

Sebastian Manger: In some cases, the choice was indeed very difficult—especially when we needed examples focusing on a particular means of implementation. In those cases, we needed scenes that showed exactly what was meant without getting overlayed by other effects or information. In our thesis, which was the original inspiration for the book, we simply created such specific examples ourselves. For Informotion, however, we wanted to always use current examples from actual practice.

Once we found a fitting example, it was usually quite easy to convince the agency or studio to participate in the book. It was, however, sometimes a bit difficult to figure out who exactly was the author of a certain animation.

CI: Based on what you have observed, is there a “best practice” method for releasing an infographic video on the Internet?

Sebastian Manger: As the field of animated infographics is still quite young, it is currently very difficult to speak of a “best practice” example. We do hope that our book can help generate such an example one day.

CI: Do you believe that infographic videos are a stronger tool than static image or interactive infographics? 

Sebastian Manger: Yes, we do. People’s viewing habits are changing more and more. Ever more videos are appearing on the internet (YouTube, Vimeo, etc). The viewer is already getting used to absorbing information more passively. This environment is very favorable for the use of animated infographics. A certain fact can be presented to viewers in a simple manner without the need for them to toil through charts or diagrams themselves.

But herein also lies a danger or a special responsibility for the designer of an animated infographic. Under these conditions, a given set of information must always be reduced to a few details. In a static infographic, a statistic for example, viewers can make conclusions by themselves—provided, of course, that they take the time to do so.

CI: How quickly are infographic videos growing as a communication tool?

Sebastian Manger: In our research over the last few years we have ascertained a clear increase in the use of animated infographics. A simple indicator of this, for example, is the increasing number of videos tagged as “animated infographics” on YouTube or Vimeo. The number of websites and blogs that feature animated infographics is also growing continuously.

In addition, infographic design elements are being used more and more frequently in music videos, commercials, main titles, etc. This paves the way for consumers to deal with infographics as a means of implementation. Of course, the use of graphic elements in these fields is currently mostly limited to decoration, but why can’t it expand over the next few years and become more professional? These circumstances are causing viewing habits to change. Designers not only have a significant interest in these changes, but are also a contributing factor to them.

CI: What do you see as the future of infographic videos?

Sebastian Manger: We expect that the trend just described in our previous answer will continue and that animated infographics will be used even more frequently—especially in fields such as reporting but also in advertising. For most people, the use of information graphics is an indicator of seriousness. However, interactive graphics and data visualization will certainly play a huge role too.

CI: How difficult was it to put together a paper book about the highly visual topic of infographic videos?

Sebastian Manger: Not very difficult. Informotion includes a login code for accessing a password-protected website from where you can watch all the referenced videos in full length. In the printed book we use screenshots from and explanations of these videos to identify and explain current theories and means of implementation.

CI: Do you have any plans for a video infographic about video infographics in the future?

Sebastian

 Manger: Not until you came up with this question, but we’ll surely think about now!


Free Copy of the Book:

I have two copies of the book to give away to readers of Cool Infographics.  To enter you name into the hat, tweet a link to this blog post on Twitter and include the hashtag #informotionbook so I can find the Tweets.  At noon on Friday, July 13, 2012, I will randomly choose two people from the Tweets to receive a copy of the book.  You need to be following me (@rtkrum) on Twitter so I can send you a Direct Message (DM) if you are selected.

Here’s an example Tweet that would qualify:

Check out Informotion, the new book about animated infographic videos bit.ly/OdaGTg #informotionbook

Thanks to Sebastian for all his hard work, and participating with the interview.

Wednesday
Mar142012

Romance Reboot: Safe Online Dating Tips from ADT

What did you do for Valentines day? Did you go on a date? Did you meet them online? The Romance Reboot: Safe Online Dating Tips from ADT infographic from homesecuritysource.com provides tips for the 5.5 million singles who use online dating on how to stay safe while finding their true love!

This one is cool because of the new, innovative way to animate the infographic.  You’ll have to view it on the original posting to see it, but the illustrations and visualizations are animated as you slowly scroll down the page.  This design itself is too gaudy for my tastes, but BIG kudos to the designers for trying something new to push the envelope of infographic design!

The bottom is missing the URL for the original posting, which is a big mistake because it makes it hard for readers to find the cool animated version.  It’s also missing a copyright statement and any mention of the designer(s).

Thanks to Andrew for sending in the infographic!

Friday
Oct212011

UN Against Corruption infographic video

This UN Against Corruption infographic video is actually a highlights overview of a six-part video series from the UNCAC (UN Convention against Corruption) Coalition.  This video does a good job of showing how corruption impacts societies, escpecially in third world countries.  You can view the complete series at http://www.uncaccoalition.org/en/uncac-review/uncac-review-mechanism.html

Highlights of the six-part suite of 2D infographics videos commissioned by Transparency International in collaboration with UNODC. This video infographic uses animated typography and simple, iconic animated graphics and pictograms to explain the effects of corruption on society. It also incorporates a short segment of live-action video, embedded within the context of iconic elements. It provides a compelling and fast-paced tutorial for organisations and activists on how to bring pressure to bear on governments to more effectively fight corruption.

Credits:

  • art direction: mariano leotta
  • motion graphics: alessandra leone
  • sound design: ex-directory
  • sound mixing: enrico anicito guido
  • voice over: tom tucker
  • shooting: luca fuscaldi
  • production: artereazione.org
  • commission: transparency.org

The full six-part series is now available on YouTube: