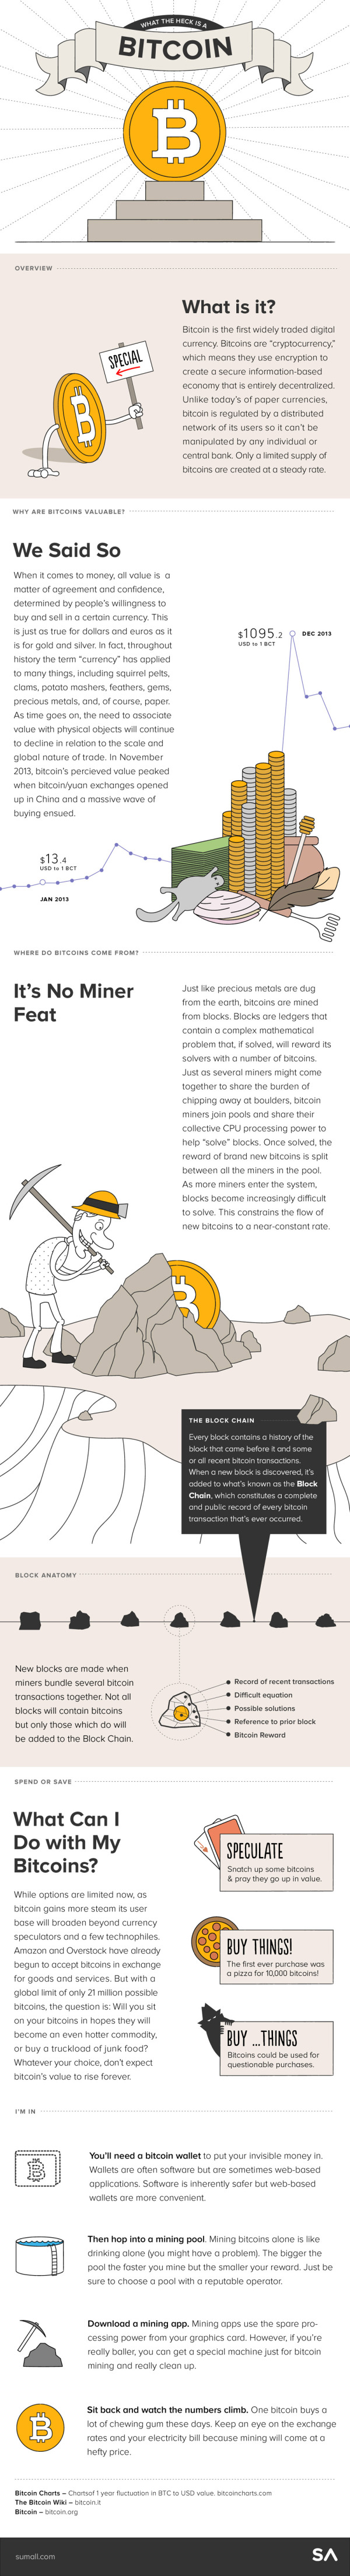
The Bitcoin is the first widely traded digital crypto-currency that is decentralized and unregulated. Find out more from the What the Heck is a Bitcoin infographic by SumAll.
Exchanges rising and falling, disputes over inventorship, wild accusations, rapid inflation and deflation, anger, confusion, and sadness. We’re talking about everyone’s favorite unicorn money: Bitcoin. Bitcoin’s six year road to the spotlight has been fraught with more turbulence than a flight through a hurricane in a Learjet, and since mid 2013 it’s only gotten more crazy.
SumAll has just added bitcoin exchanges, mining pools, and mining workers to our range of data platforms to allow our customers to keep tabs on the market and the progress of mining pools. For those who own or mine bitcoins, SumAll is now their one-stop-shop for keeping tabs on all things bitcoin, monitoring their mining efforts, and keeping a close watch over their investments.
For those who don’t own or mine bitcoins, chances are you have no idea what we’re talking about.
If you have an interest in bitcoins and don’t want to be that out-of-the-loop guy at the party who just keeps nodding his head in agreement and staring at your drink, we made this handy infographic to explain a few basic concepts to get you started. Soon you’ll be buying all your pizza–and rent–with bitcoins
Good design that tells a story to the audience, but this one uses too much text. I wish they had included some data visualizations about the difficulty to mine bitcoins or the strength of the encryption. The one dataset they did visualize was the value of bitcoins from Jan-Dec 2013. The value changes so rapidly, including that one data visualization can quickly make the infographic feel old and out-of-date. For a longer Online Lifespan, the design should focus more on the long-term, consistent information about bitcoins and not the most recent trending data.
This is a good example of the company, SumAll, using an infographic as part of their email marketing campaign. The infographic was included as the highlight in one of their email blasts to customers with a link back to the full design on their website!


 Randy
Randy