About
Randy Krum
President of InfoNewt.
Data Visualization and Infographic Design

Infographic Design

Infographics Design | Presentations
Consulting | Data Visualizations

DFW DataViz Meetup

Join the DFW Data Visualization and Infographics Meetup Group if you're in the Dallas/Fort Worth area!

Search the Cool Infographics site

Custom Search

Subscriptions:


Feedburner

The Cool Infographics® Gallery:

How to add the
Cool Infographics button to your:

Cool Infographics iOS icon

- iPhone
- iPad
- iPod Touch


Read on Flipboard for iPad and iPhone

Featured in the Tech & Science category

Flipboard icon

Twitter Feed
From the Bookstore

Caffeine Poster

The Caffeine Poster infographic

Entries in brand (49)

Friday
Jan302009

The Best Beer in America


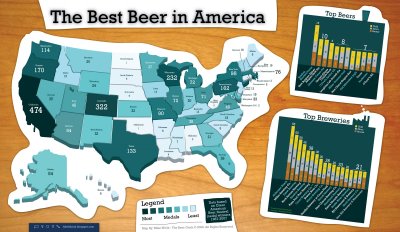
Mike Wirth, The Beer Geek, created this map of award winning beers using 20 years of data of the Great American Beer Festival medal winners from 1987-2007. Originally created for the Lyke 2 Drink blog, it also shows the breweries with the most medals and the specific beers with the most awards.

Great work Mike!

UPDATE: Mike has put up an updated version of the Best Beer in America map.

Tuesday
Jan202009

Dramatic Shift in Marketing Reality


Scholz & Friends: "Dramatic shift in marketing reality from Michael Reissinger on Vimeo.

Great little video from Michael Reissinger on the need for innovation and consumer interactions in today's marketing world.

Found through Twitter: @stonepayton

Thursday
Oct162008

Brand Tags


BrandTags.net is a project by Noah Brier that gathers user input to create tag clouds for many of the biggest brands in our culture.  You can add your own input into the project on the main page, or browse brand results.  The example above is for Velveeta.

Friday
Aug292008

Sony Walkman advertising


This may cross the lines between infographics, advertising and art, but I really liked these advertising posters.  They're real subway maps of New York, London and Sydney, with a little artistic twist to add the ear buds.


I found these on Ad Goodness, and they were created by Saatchi & Saatchi.

Friday
Aug082008

The Ropes at Disney


Found on CartoonBrew, this circular chart from 1943 shows the development process of an animated film through the different roles within the Disney organization.  Not exactly an org chart, this is more of a process map.

How do they make those drawings move?  This chart, an separate pull-out from the 1943 booklet, The Ropes At Disney’s (see below), explains the whole process.You’ll note that it all starts with “Walt”. And his main focus was “Story” and “Direction”.

Can you tell I’m going to Walt Disney World today?


Monday
Jul212008

When are you at risk online?

From the Mozilla website, and obviously a part of their sales pitch.  I picked up that the calendar arrangement of the squares is in fact correct for 2006.  Its getting the small things right that help make good infographics.

An independent study shows that, in 2006, IE users were vulnerable to online threats 78% of the time. Firefox users? Only 2%.

“At risk” defined as publicly available exploits with no patch. Source: “Internet Explorer users Unsafe for 284 Days in 2006” Brian Krebs, Washington Post, 1/4/2007

Monday
Jul072008

The iPhone Timeline

From iPhoneGold.org, is a cool little iPhone timeline.  I couldn't find an author to credit, just the website.

Found on digg.com

Thursday
Jul032008

Top 10 UK Brands 2007 Visualisation


Top 10 UK Brands 2007 Visualisation, originally uploaded by visual think map.
Inspired by the infographic "Who Owns the Car Companies" that I originally posted about in October 2007, Chris Watson, from Visualthinkmap.blogspot.com, has created a cool infographic showing the owners for some of the top brands in the UK.

Great job Chris!

Wednesday
Jun042008

Greenwashing


From Futerra Communications:

Our Greenwash Guide (PDF) was born out of a desire to help communications professionals get their green messaging right. The majority of Greenwash is the result of over-eager communications campaigns that lack environmental rigour rather than malicious intent.
Found on Melodies In Marketing, thanks Mario!

Tuesday
May272008

Approach to Creating Experiences


Found on Think>Draw>Make, the Approach to Creating Experiences is from David Armano from the very influential Logic + Emotion.

It’s a high-level attempt to document an approach to designing an interactive experience within an agency setting.