About
Randy Krum
President of InfoNewt.
Data Visualization and Infographic Design

Infographic Design

Infographics Design | Presentations
Consulting | Data Visualizations

DFW DataViz Meetup

Join the DFW Data Visualization and Infographics Meetup Group if you're in the Dallas/Fort Worth area!

Search the Cool Infographics site

Custom Search

Subscriptions:


Feedburner

The Cool Infographics® Gallery:

How to add the
Cool Infographics button to your:

Cool Infographics iOS icon

- iPhone
- iPad
- iPod Touch


Read on Flipboard for iPad and iPhone

Featured in the Tech & Science category

Flipboard icon

Twitter Feed
From the Bookstore

Caffeine Poster

The Caffeine Poster infographic

Entries in color (48)

Friday
Mar202015

The Top Color Trends of 2014

The Top Color Trends of 2014 infographic

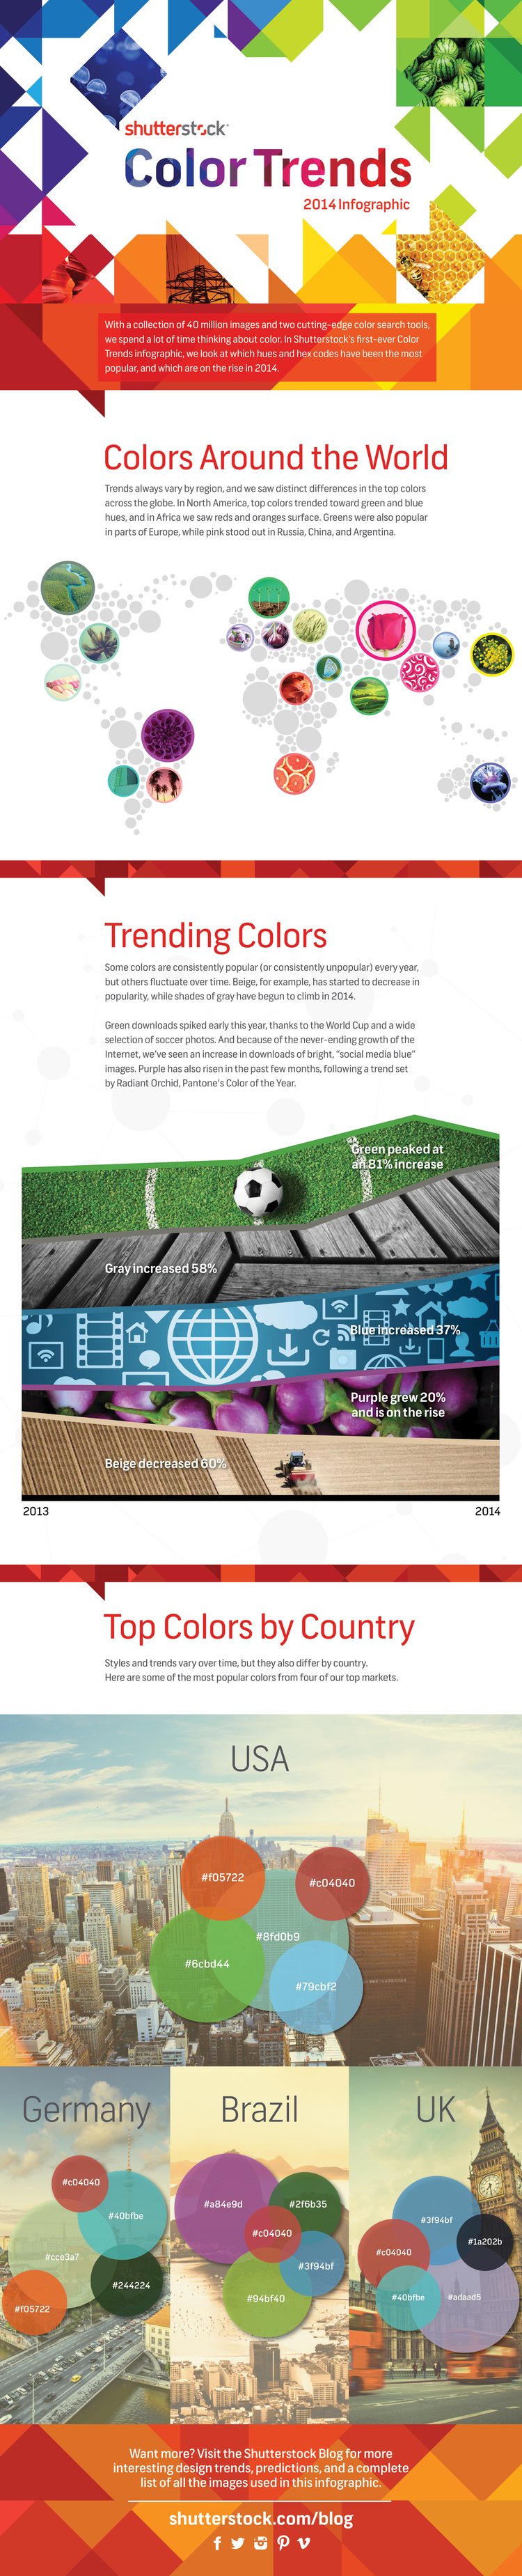
Shutterstock has analyzed it’s collection of 40 million images to track color trends through the years. The newest infographic release, The Top Color Trends of 2014  explores the trend change from 2013 to 2014, as well as identifies the most popular colors in the countries that are Shutterstock’s top markets.

Earlier this year, we brought you Shutterstock’s annual Design Trends infographic, and now we’re following up with some facts and figures that are all about color. Using data from our collection of 40 million images and our 400 million all-time downloads, we analyzed which popular colors are set to dominate design in the coming months.

We know how important color is to design — that’s why we created two innovative color search tools, Palette and Spectrum. Color impacts everything: web and graphic design, fashion fads, even home decor. Some of the trends we saw this year, like a change from natural palettes to gray tones, reflected similar trends seen on Fashion Week runways and in home design. Others were influenced by global events like the World Cup, the continued rise of social media, and Pantone’s Color of the Year, Radiant Orchid. 

Check out the infographic below to discover which colors are en vogue around the world, then scroll on to see which images we used to create it, and to explore six colorful image collections inspired by the 2014 Color Trends infographic.

In the Trending Colors section, the infographic chooses to use a photograph dominated by a specific color, then trimmed the edges of the photograph to represent a timeline of the downloads of that color throughout the year. The lines may also predict where the color trends may be heading for next year.

The use of hex color numbers in the Top Color by County section provides a precise color definition. By doing this, the viewer can accurately pinpoint which shade of “purple” that is popular and use it. The colors use values are diverse enough that the circle sizes are different enough for the reader to see the differences.

Found on Shutterstock

Tuesday
Sep162014

Beer Colors

Beer Colors Cans Visualization Infographic

Beer colors is a fun design idea that combines packaging design with beer label design, these beer label designs imitate Pantone® color chips.  Maybe more of a data visualization of colors than a true infographic, but I love it!

Concept and design based on the color of the beer. Each type of beer is associated with its corresponding Pantone color. The typeface chosen is HipstelveticaFontFamily in its bold version by José Gomes, thanks for sharing.

Designed by Spanish creative agency Txaber, this series of beer packaging labels show each brew type represented by its corresponding official color. 

Beer Colors Bottles Visualization Infographic

Found on creativebloq and BoingBoing


Friday
Jun272014

The Basic Wine Guide

Basic Wine Guide infographic

The Basic Wine Guide infographic from Wine Folly is full of the helpful tips one needs when trying to understand wine etiquette. This infographic has tips about what glass each wine should be in, what the wine should be eaten with, some tasting tips, and other things.

The infographic is now available for purchase as a poster for $24.

Wine is more than just a drink; it’s a lifestyle, a survey into history, a gastronomic adventure, a study in farming and a way to explore different cultures. But with so many different angles to approach wine, how do you get started?

Fortunately, there are only a few basic techniques to learn as well as some common wine knowledge. With a little practice you will be over the hump of being a rudimentary wine ‘dabbler’ to becoming an upstanding wino, capable of ordering wine like a pro.

The wine for beginners infographic has the answers to your questions. Learn the different wine styles, wine glasses and tips on tasting like a wine connoisseur.

This design keeps the types of wine in the same order all the way down the infographic, creating a nice and tidy visual for anyone who is looking for specific information on the infographic.

Found on winefolly.com

Friday
Apr112014

Color, Value, and Evolution of Logos

Color, Value, and Evolution of Logos infographic

Logos are very important to a business. A good logo can sell itself, especially if the colors match the product correctly. Color, Value, and Evolution of Logos infographic found on Finances Online.

Do you know how colors influence your buying decisions? Why the charging bulls in the Red Bull logo are red? Or why McDonald’s double arches are yellow? It’s because the emotional power of logos is closely tied to specific colors.

It turns out, our emotions are results of the precise science of effective logo design. In fact, psychologists proved that famous logos are so wired into our brains, that at the age of 2 kids can already link a product with its logo in 67% of cases. You can find even more interesting facts about logos in our latest 

The meaning behind logo colors is always a popular infographic topic, and you can see some prior posts here.  This design goes a bit further by also looking at brand values, the cost to design some of the more famous logos and how some logos have evolved over the years. 

Some portions of the design are too visually busy, and hard for the reader to follow.  Too many different fonts makes the information hard to read, and too much text detracts from the appeal of the visuals.  However, showing the actual logo images is key to sharing this information, and they do a good job of including relevant examples.

I really like that they added a few “Tweetable Facts and Figures” on the landing page below the infographic to help encourage readers to share the infographic.  They even have convenient “Tweet This” links that will fill in the Twitter post with the text for the user. 

Thanks to Alex for sending in the link!

Wednesday
Apr092014

Color: Profiles & Printing Explained

Color: Profiles & Printing Explained infographic

It is frustrating when you go to print an image and it doesn’t look right. Color: Profiles & Printing Explained infographic from The Logo Company explains the differences between CMYK, RBG, and Pantone as well as when to use them.

Whether you are printing a single logo or a full promotional brochure, you want your marketing products to look sharp. Given this, it is important to understand the science behind color creation and printing techniques, so you can make educated decisions about how to produce the best images for every project.

To keep your logo and other imagery looking bright and vivid, there are three basic color profiles with which you should become familiarized. What works for your web page will not necessarily work for printed postcards. Choosing the right color profile is the essential first step in creating a beautiful image.

A bright, colorful infographic design almost always grabs the audience’s attention, and this design does a great job of showing the readers the differences between color profile methods.

On the infographic landing page, the infographic image is actually below all of the more-detailed text descriptions, and readers have to scroll down to see that there is an infographic at all.  The image should be at the top of the page with the additional text below to add more detail for readers that want the additional information.

The footer should include the URL to the infographic landing page so readers can find the original, full-size version, and also a copyright or Creative Commons license.  How are people allowed to share and/or modify this design?  Could another printing company put their logo on the design and publish it?  It’s not clearly stated.  A standard copyright license is assumed, which would not allow other companies to modify the design, but it really should be explicitly protected.

Thanks to Matt for sending in the link!


Monday
Jan132014

What Does the Colour of Your Car Say About You?

What Does the Colour of Your Car Say About You? infographic

If you think picking a car color was hard before, this infographic could make your decision easier or even harder. The What Does the Colour of Your Car Say About You? infographic published by Motor Click gives meaning to your choice in car color.

The wide variety of colors available has some questioning whether consumers make their selection based on simple preference, or whether or not the color of their vehicle somehow reflects their psychology. Whatever the reason, it cannot be denied that color plays a huge role in sales.

This is a good infographic design that takes information from the following text-only article and makes it visual: The Psychology Behind the Color of Your Car.  This design tells one story really well, and only takes a few seconds for the reader to understand.  Designed by Attwood Digital.

A couple issues with this design.  Obviously from a car company in the UK, the spelling of color/colour is oddly mixed throughout the design.  Also the data is a little bit questionable.  The article referenced isn’t the original source of information, and that article includes claims and quotes from additional sources.  Definitely take this information with a grain of salt.  There may be underlying credibility issues.

The footer should include the URL link back to the infographic landing page so the audience can find the original full-size version when they come across it shared on other sites.  For example, it’s had over 5,000 views on the Visual.ly site so far, but that submission does not link back to the original on the MotorClick site. So, all of that good traffic to view the infographic is not benefitting the original publisher at all.

Found on Visual.ly

Tuesday
Oct152013

The Power of Colorful Customers

The Power of Color infographic

The Power of Color infographic from Pega is about treating each customer as an individual. Each individual has their own colors and CSPs can paint their customer processes to make them more specific, more relevant, more proactive, and more effective for the individual customer.

By applying color to all of their customer processes at the moment of truth, communications service providers can take the next best actions relevant to each customer. Doing this over the life times of their subscribers delivers exceptional value to both customers and service providers.

There’s a lot of text in this design, and the use of the colors as metaphor for specific customer attributes is a little bit confusing.  Otherwise this is fantastic information, and easy for the reader to follow.  The footer should include a copyright statement, and the URL link back to the infographic landing page som readers can find the full-size original version.

Thanks Caitlin for sending in the link!

Monday
Oct072013

The Color Emotion Guide

The Color Emotion Guide infographic

The Color Emotion Guide arranges well known company logos into a rainbow of emotion to help readers understand which logos are using color to create a perception of their brands.

Logo designers have several puzzles to solve when presented with a new logo design project. One of the main considerations that a designer must deal with is to understand what it is that the client wants to achieve with the logo design.

The designer asks the client a series of questions that illicit answers helping to bring the parts of the puzzle together. A typical question might be “What qualities does your business want to be known for?” The answer might be for a doctor for instance, “I want to be known as someone you can trust”. So the question and answer begs: How does the designer portray trust in the logo design?

Scientists have been studying the way we react to colors for many years.  Certain colors make us feel a certain way about something. As long as the designer knows what these colors and emotions are, the designer can use that information to help present the business in the right way. These are not hard and fast rules but smart designers use the information to their clients advantage.

This fun infographic lays out the emotions and qualities that well known brands like to be known for. The color psychology is only one part of the puzzle but I think you will agree it is a very important part of it.

As far as I can tell, this appears to be a design from The Logo Company, but it was very hard to track down.  Infographics are usually shared without the accompanying articles, so designs need to include basic information like their own company logo, a copyright statement and the URL back to the original design in the actual image file.

Found on Laughing Squid

Thursday
Sep192013

A Visual Guide to What Colors Communicate

The Essential Guide to What Colors Communicate infographic

When you are designing your blog or website, how do you decide what colors to use? Your choice will make a difference on how others receive and interpret your content. Dustin Stout from dustn.tv has created Color Sets the Tone: A Visual Guide to What Colors Communicate infographic to educate website builders and bloggers on how to communicate to their readers with color.

Did you know that colors communicate? The use of color in your blog design can be an essential part of how your personal brand is perceived. Color usage can either make or break your blog design, and I will show you how to choose your colors wisely by understanding what they communicate.

When new visitors land on your blog, the first things they interpret are colors. Before they read a single character, their brain is registering colors which are subconsciously (or consciously) tied to emotions, states of mind, or [preconceived ideas]. If you do a poor job at putting together the colors in your blog design, it can be detrimental to the growth of your brand.

I’ve come up with an essential guide to what colors communicate, as well as a quick infographic to reference that is free to download! 

Simple design that tells one story really well.  Quick and easy for readers to digest, and the text associated with each color is really short.  Less text is better for infographics.

The footer should include the URL back to the landing page to make it easier for readers to find the full-size original version.

Found on http://dustn.tv/what-colors-communicate/

Friday
Mar082013

Shutterstock: Annual Design Trends 2013 Edition

Shutterstock: Annual Design Trends 2013 Edition infographic

Shutterstock has created their Shutterstock: Annual Design Trends 2013 Edition infographic. From the infographic, we learn what was hot in 2012, as well as expected trend for the coming year of 2013. Interesting fact: Infographic downloads from Shutterstock are up 525% from 2011! 

Here at Shutterstock, if there’s one thing we obsess over as much as inspiring imagery, it’s data. Add that to the fact that we license more images than anyone else, and you have a recipe for some pretty insightful trend forecasting.

We created our first design-trends infographic last year; this time, we took things up a notch, incorporating a lot more data, a lot more images, and a more in-depth look at what we see heating up in the year ahead.


Check out the full infographic, then read on for 10 of our own favorite takeaways.

The use of stock vectors, especially for data visualizations, is on a huge upward trend as more and more people are designing their own infographics and data visualizations.  I am very excited about this trend, as people are breaking away from the chart templates in MS Office to visualize their new data in new and different ways.

I would prefer to see all of the statistics visualized using the stock vector data visualizations from Shutterstock.  That would have been more in line with the growth trend they are showing.  Much better than just showing the numbers in text they way they have in this design.

The footer of the infographic is missing both a copyright statement (or Creative Commons license), and the URL directly to the blog post with the high-resolution infographic.  The URL they did include is just to the main blog page, and six months from now the infographic will be buried in the past blog posts.

Thanks to Danny for sending in the link!