About
Randy Krum
President of InfoNewt.
Data Visualization and Infographic Design

Infographic Design

Infographics Design | Presentations
Consulting | Data Visualizations

DFW DataViz Meetup

Join the DFW Data Visualization and Infographics Meetup Group if you're in the Dallas/Fort Worth area!

Search the Cool Infographics site

Custom Search

Subscriptions:


Feedburner

The Cool Infographics® Gallery:

How to add the
Cool Infographics button to your:

Cool Infographics iOS icon

- iPhone
- iPad
- iPod Touch


Read on Flipboard for iPad and iPhone

Featured in the Tech & Science category

Flipboard icon

Twitter Feed
From the Bookstore

Caffeine Poster

The Caffeine Poster infographic

Entries in connections (69)

Wednesday
Oct132010

More Lawsuits in the Mobile Business

George Kokkinidis from Design Language News made another great infographic redesign of the Lawsuits in the Mobile Business.  A significant improvement over the original diagrams in The Guardian and the NYTimes.

An attempt at redesigning this chart from The Guardian to make the plaintiffs and defendants a bit more clear.

Although this doesn’t add the additional data dimensions of company revenues like “Who’s Suing Whom?”, this diagram is much easier to read and understand than the originals.

Great job George, and thanks for the link!

Wednesday
Oct062010

Who’s Suing Whom: Lawsuits In The Telecoms Trade infographic


Who’s Suing Whom is a great infographic design improvement by David McCandless from InformationIsBeautiful.net.  David took existing diagrams (which were pretty poor) from The Guardian and the NY Times, and created a much more compelling and information-rich infographic.  My feeling from the news is that there are many more lawsuits that these, but I don’t know the data.

Based on these diagrams from Guardian Tech and the NY Times.

I thought those charts generated more questions than they answered. So, as ever, I tried to answer the obvious questions and convey various contexts simultaneously.

I wondered, too, if I could design the connections so the lines didn’t cross. Almost managed it!

And see if there was a relationship between dropping revenues and litigiousness. What do you think? Is there?

Data: http://bit.ly/sosueme


Great job David!

Tuesday
Sep282010

The Display Ad Tech Landscape


Developed by Terence Kawaja of LUMA Partners, the Display Advertising Technology Landscape makes an attempt to map out the companies involved in this ever-changing business.  This is his latest version, but even he admits that his chart is far from perfect.

By definition the chart will never be final since the space is so dynamic. I am still discovering companies.

A few things to bear in mind. This chart is far from perfect. Organization of such a fragmented and dynamic industry is flawed by its very nature. Many companies operate across several categories and there are distinctions within categories. This chart does not include many of the search players which are increasingly overlapping with display nor does it reflect whole categories such as lead generation and ecommerce which likewise utilize display advertising in their funnel, not to mention international companies which are barely reflected. At some point in the future I may construct an uber landscape which captures these and other players.

I believe we are in for some interesting times as the space rationalizes and consolidates along with the advent of new strategic entrants.

I applaud Terence in his attempt to visualize this complicated business environment that he works with.  Even if it’s not perfect, it certainly helps readers understand this business better by making it visual.  You certainly don’t have to be a graphic artist to make useful infographic, and I think Terrance has made a step in the right direction.  I look forward to seeing future versions.

Found on AllThingsD.com and AdExchanger.com

Wednesday
Sep082010

The Most Widely Spoken Languages of the World

A subway map style infographic, The Most Widely Spoken Languages of the World, shows some of the primary countries and the languages they speak.  Each track is a different language, and the connection point are countries where that language is one of the dominant languages.  The actual number estimates behind how many people speak each of the top languages is listed in the legend.

I don’t know how accurate it is because the data source isn’t listed.  I would think that the U.S. would at least be a junction point between English and Spanish (and maybe others).

This infographic illustrates the most widely spoken languages in the world and some of the countries these languages are spoken in.  The station name indicates the language and the number of speakers that languages has and the map illustrates some of the countries these languages are spoken in.  The list of countries is not exhaustive but can help the viewer navigate the world of languages.
The inspiration for this map came from the London Underground map – which in fact is not a map but a schematic diagram. As a schematic diagram it shows not the geographic but the relative positions of stations along the lines, stations’ connective relations with each other and their fare zone locations.

This infographic has been commissioned by PS Translation to showcase their range of
translation services.

I also think this is a fantastic example of a infographic used for marketing purposes.  It’s not an outright advertisement, but it is certainly a related topic to a translation service done in a very appealing design style.

Thanks for the link James!

Monday
Aug022010

Automotive Family Tree: Update, Interview and Poster GIVEAWAY! #autotree

Andy Harris from TooManyCars.info has updated (a few times) his fantastic Automotive Family Tree map of who owns the car companies since the last time I posted about it a couple years ago.  The map is so big and detailed that you have to click on specific ownership corporations to zoom into just their connections.  The colored connection lines indicate the nature of each relationship (Joint Venture, License, Ownership or Sharing Technology).


You can enter to win a FREE copy of the printed poster by tweeting a link to this post on Twitter including the hashtag “#autotree” (without the quotes) by the end of the day on August 6th.  I’ve included the hashtag in the title, so you can enter by retweeting the post from my Twitter account.  One winner will be randomly chosen to receive a printed copy of the poster.  You have to be following me on Twitter so I can send you a direct message if you win.

The large version is available for a small donation to TooManyCars.info.  The PDF is available for $5, and the 36”x36” printed poster is available for $30.

Andy also agreed to answer a few interview questions about how he makes the Automotive Family Tree and it’s history.

Cool Infographics: What inspired you to create the Automotive Family Tree?

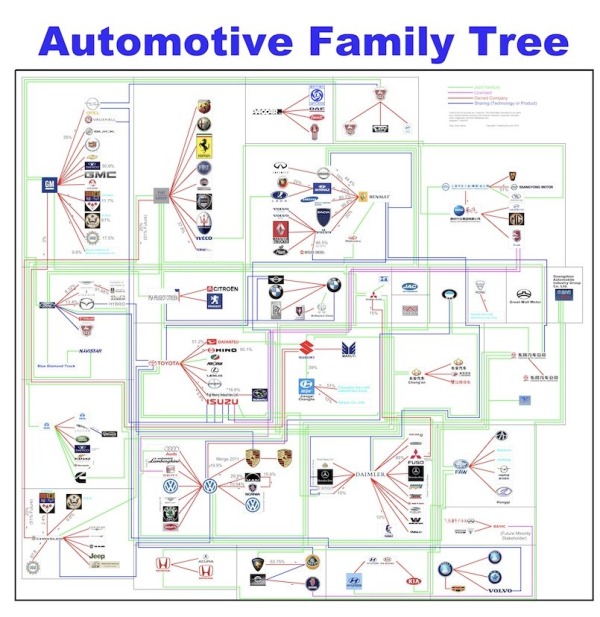
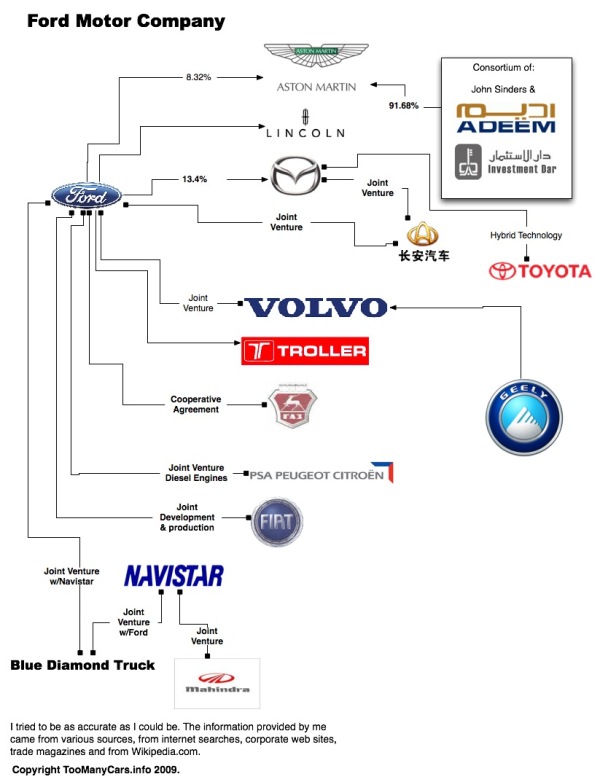
Andy Harris: About 8-10 years ago in a British auto magazine I saw a diagram showing the main connections between automotive manufactures (Ford owns Lincoln, GM owns Chevy, etc.). The more I thought about the diagram, the more info I wanted to know. I decided I want to learn HTML so I used the idea of the Automotive Family Tree as my learning curve.   


Cool Infographics: Do you do all of the design yourself?  What’s your background?

Andy Harris: I do all the design for the website and Automotive Family Tree myself. My day job is telecommunications engineering, however my background is in CAD. Bottom line, I draw maps showing where the telephone cable in the alley is located, type of cable, electronics, etc. I never really consider myself a design artist.   


Cool Infographics: What software applications do you use for the family tree?

Andy Harris: Because of my background in CAD, the large PDF is made using AutoCAD. But the smaller diagram for the website is done in OmniGraffle. So, my MacBook Air gets a work out switching between XP to use AutoCAD and OS X to use OmniGraffle.


Cool Infographics: How much traffic does having the infographic drive to your site, TooManyCars.info?

Andy Harris: When I first started my website, it was about car reviews. Then I switched to blogging a few years back. But the heart of my website has always been the Automotive Family Tree. This infographic is a major reason someone comes to my blog.


Cool Infographics: Are there any interesting places you know the poster is being displayed?

Andy Harris: The most interesting printed posted I sold to was someone in Russia and Turkey. My download PDF has also been sold around the world. But the most interesting request for the Automotive Family Tree was used in a Master Thesis from a student in Poland. However, one thing I’m proud of is being published in GQ magazine from Taiwan. The automotive industry is truly international!


Cool Infographics: What are some of the most surprising or interesting company relationships you’ve found by doing the family tree?

Andy Harris: I think the most surprising relationship in the family tree is the amount of change. There are joint-ventures everywhere because of the economy, and more and more sharing of technology between manufactures, making some strange bed-fellows. I’d say the new Renault-Mercedes-Benz connection is the most surprising.


Cool Infographics: How difficult is it to gather the company relationship data?

Andy Harris: I get this question many times, how long did it take you to make this? I really don’t like to think about it, but if I had to guess, 120 + hours in just gathering information, reconfirming, gathering more information, more confirmation and still gathering more information. I’ve recreated it two times. My first example was more simple and just using the major automotive manufactures from USA, Euro and Asia. Then as China grew, I added more automotive logos, more gathering of information and reconfirming. I’m not sure if it was difficult as much as time consuming. But putting this together became a labor of love.


Cool Infographics: What are the printing specs for the poster and why?

Andy Harris: I currently print at 36”x36”, I started as D-size or 24”x36”. As it grew 36”x36” was the most logical choice and the square print looks nice.


Cool Infographics: What’s the most interesting part of designing the Automotive Family Tree?

Andy Harris: I think one of the most interesting parts about the Automotive Family Tree, is the different types of people wanting to download the PDF. I’ve got request from a F1 engineering group, NUMMI manufacture marketing (before they closed), trading companies, automotive equipment manufacturers and oil companies. But not the petrol makers, think more like lubrications for engines and lubricants for manufacturing equipment. When I started this journey, I only wanted to inform the public that the automotive world is truly international, and now I get emails asking me to add more specialty manufacturers or even make custom inforgraphics.

Great job Andy!

Wednesday
Jul142010

Cool Infographics People on Web Trend Map!

As a visual treat, I took my Twitter list “Cool-Infographics-People” and visualized the entire list on the interactive tool Web Trend Map from iA and Craig Mod.  Visit often, and you can see the hot trends being tweeted that day by some of the best infographics people.

I don’t know how Twitter lists are doing in general, but I know that with 436 followers, the “Cool-Infographics-People” list is one of the most followed lists in the design community.  Out of the 228 lists I’ve been included on, this one is the most followed, and I see that for many other designers too.  I’d love to see (and visualize) the stats from Twitter, but most lists I see have under 10 followers.

Thursday
Jul012010

Visualizing the links between the WIG20

Łukasz Kostka designed this linking visual to show the connections between the board members in the WSE WIG20.

A map of connections between board of directors and supervisory board members in companies forming WSE WIG20 index. Connection is assumed if two people are members of the same board. Dot size reflects a number of boards. Link color reflects a number of connections.

I had to lookup what the WSE WIG20 was, and according to Bloomberg “The WIG20 index is a modified capitalization-weighted index of 20 Polish stocks which are listed on the main market. The index is the underlying instrument for futures transactions listed on the Warsaw Stock Exchange.

I wish there was a good way to also see which companies are represented along with their board members.

Thanks to Łukasz for sending in the link!

Thursday
Jun102010

A Visual History of the American Presidency - new infographic poster


Timeplots has released their second infographic poster, A Visual History of the American Presidency.  Timeplots was launched by Nathaniel Pearlman and Frank Hamilton in December 2009 with the release of the Visual History of the Supreme Court infographic poster, which is now hanging in many schools, law practices and political offices.

This large-scale print is like nothing else available on the history of the American presidency. It places each president in historical context, visualizing a remarkable range of political, social, and economic measures to succinctly tell the story of the presidency. Narratives are displayed within the larger context of American political history by aggregating and annotating hard data on population, presidential elections, Congress, the Supreme Court, the Cabinet, the U.S. economy, and the federal budget and debt. The Timeplot provides a new lens into American political history; it is not intended to be absorbed at a glance, but rather to be visited and revisited over time.


A beautiful poster, and a very impressive infographic design.  Very Tufte-like in its infographic design, which is no surprise since Nathaniel was a student of Edward Tufte at Yale.  

At its heart, this is a fantastic mix of timelines.  Additionally, the poster is an incredibly detailed infographic that includes things like the time period of each President, the balance of Congress during each term, approval ratings, population growth, the U.S. GDP, the Federal Budget, unemployment, election cartograms and statistics, a biography of each President’s political history and so much more.


The high-resolution infographic is available on the Timeplots site using Zoomify, but it really shines as the printed poster.  You can order the printed 32”x48” poster from the Timeplots.com site for $45, or a smaller 24”x36” version for $30. 


Great job to the entire team at Timeplots!  Later today, I’ll post a behind-the-scenes interview with Nathaniel.

Monday
Feb152010

My Digital Life 2.0: A Consumer Gadget Map

Presenting My Digital Life 2.0!  I’ve significantly updated the My Digital Life infographic I designed last year.  In addition to including many more gadgets and accessories in the graphic, I changed the connection lines to indicate either a constant or occasional connection.  The line arrows also indicate the direction of information flow (sometimes one-way, sometimes both ways).  You can see the high-resolution images on Flickr by clicking on the images.


The infographic highlights many of the decisions a consumer has to make with each new gadget they buy.

  • What kind of batteries should I use?
  • How much and what kind of memory will I need?
  • How do I connect to my existing gadgets and computers?
  • How will it work in my car?
  • Do I have an available connection?
  • Where can I add a new gadget (like a new hard drive)?

For the purpose of Product Development and Marketing, this is a fantastic way to map out the experiences a consumer faces and how new products will fit into their life.  For example, if you were at a company designing a new consumer electronic gadget how would your product fit into your target consumer’s life?  What decisions would they have to make about your product?  Is it easy for them to understand if your new product will work with their existing setup?

Even if you’re only a headphone manufacturer, it’s incredibly important to understand the whole consumer experience.


You’ll notice that the map began to form natural groupings that I call experience zones.  Here’s a modified version that highlights six specific areas of experience: video, audio, phone, photos, computing and mobile.  From an average consumer perspective, I know I’m missing two potential additional areas: Gaming and Reading.  I don’t own a gaming console (Xbox or Wii) and I don’t own an e-reader (Amazon Kindle or Sony Reader).

Since I’m a technology geek, I already understand how all of these connections work…in my head.  I’m the one who set them up and I use them every day.  However, imagine your parents or grandparents trying to understand all of these connections, and that doesn’t include the software communication between many of these gadgets.

I’ve added a few new types of connections, and included the different line types in the legend.  I also took a few liberties with the connection types.  “Snap Together” indicates any type of physical connection, like the Ear Jams snapping onto my Apple Earbuds and also the iPhone snapping into the car mount.  I left the camera memory cards as USB connections without getting into any more detail of the inner connections in the cameras.  The legend is not truly necessary because in true Tufte form, I included the connection icons in each of the connection lines, but I decided to leave the legend in to identify any icons that people aren’t familiar with.

The biggest challenge in designing the infographic, was arranging everything so that none of the lines crossed.  To make this happen, I ultimately had to skip a couple connections.  I have used the Etymotics earbuds with the MacBook occasionally, but that connection line would have been horribly ugly, crossing the entire graphic.

Thursday
Dec172009

The Simpsons 20th: Comedy [Family] Tree


The Simpsons celebrate their 20th anniversary this week on Thursday, and CNN Entertainment published this chart "The Simpsons Comedy Tree" on Monday.  A combination Nightingale Rose Graph (also called a polar area diagram), family tree and timeline, this simple chart connects the influences that impacted Matt Groening and the creators of the Simpsons as well as the shows that came after.
"The Simpsons" stands on the comedic shoulders of many that came before -- and has influenced countless works that have arrived since. Here are just a few of the roots of the "Simpsons" comedy tree and the branches of those it gave life to. (The following, illustrated by the doughnut at the top of the story, is by no means complete, and each member has its own, sometimes overlapping influences.) 
Thanks to Tony Hendra's "Going Too Far" for inspiration and cartoonist Art Spiegelman for having his fingerprints all over the place.
The article also includes descriptions of the actual influence for each of these shows.

Thanks for the link Matt!

Also:


For those Simpsons fans of you, here is also the poster created exclusively for Entertainment Weekly celebrating the release of the 20th season DVD set on Jan 12.  Dude, make sure to go look at the large, scrollable version.