About
Randy Krum
President of InfoNewt.
Data Visualization and Infographic Design

Infographic Design

Infographics Design | Presentations
Consulting | Data Visualizations

DFW DataViz Meetup

Join the DFW Data Visualization and Infographics Meetup Group if you're in the Dallas/Fort Worth area!

Search the Cool Infographics site

Custom Search

Subscriptions:


Feedburner

The Cool Infographics® Gallery:

How to add the
Cool Infographics button to your:

Cool Infographics iOS icon

- iPhone
- iPad
- iPod Touch


Read on Flipboard for iPad and iPhone

Featured in the Tech & Science category

Flipboard icon

Twitter Feed
From the Bookstore

Caffeine Poster

The Caffeine Poster infographic

Entries in connections (69)

Wednesday
Sep242008

Mashup DJ Girl Talk


From Wired.com, how do you visualize a music mashup of 300 different songs?
In the modern laptop era, any monkey with Pro Tools can make a mashup. But Pittsburgh-based computer maestro Girl Talk (known to the IRS as Gregg Gillis) has turned the cut-and-paste process into a jams-packed jigsaw puzzle. His latest album, Feed the Animals (released digitally in June with hard copies out September 23), brims with 300 song snippets in just over 50 minutes (compared to around 250 in his previous effort). "People want to see the bar raised," Gillis says. Below, a beat-by-beat breakdown of a single track.
Thanks Daniel for the link!

Wednesday
Jul092008

The Map of Scientific Paradigms


One of the projects from Information Esthetics, the Map of Scientific Paradigms by Kevin Boyack, Dick Klavans and W. Bradford Paley shows how scientific papers in different fields are connected through their citations.

As to what the image depicts, it was constructed by sorting roughly 800,000 scientific papers into 776 different scientific paradigms (shown as red and blue circular nodes) based on how often the papers were cited together by authors of other papers. Links (curved lines) were made between the paradigms that shared common members, then treated as rubber bands, holding similar paradigms closer to one another when a physical simulation forced them all apart: thus the layout derives directly from the data. Larger paradigms have more papers. Labels list common words unique to each paradigm.

 Thanks for sending in the link Alwyn!

Tuesday
Jul082008

The Internet's Undersea World

An infographic map from the The Guardian in the UK, a map showing the few underwater cables that connect the world.

Found on digg.com

Thursday
Jul032008

Top 10 UK Brands 2007 Visualisation


Top 10 UK Brands 2007 Visualisation, originally uploaded by visual think map.
Inspired by the infographic "Who Owns the Car Companies" that I originally posted about in October 2007, Chris Watson, from Visualthinkmap.blogspot.com, has created a cool infographic showing the owners for some of the top brands in the UK.

Great job Chris!

Monday
Jun232008

Obama Funding Graphic


A small poster from our friends at XPLANE,

How Obama Reinvented Campaign Finance Barack Obama is the first major candidate to decline participation in the public financing system for presidential campaigns. He’s found a more effective way to raise money — by leveraging the power of the American people through online Social Networks.
Available as a PDF formatted for printing on 11x17 paper.

Tuesday
Jun172008

Code Swarm: Eclipse


code_swarm - Eclipse (short ver.) from Michael Ogawa on Vimeo.

Created by Michael Ogawa. Check out the website describing the project here.

This visualization, called code_swarm, shows the history of commits in a software project. A commit happens when a developer makes changes to the code or documents and transfers them into the central project repository. Both developers and files are represented as moving elements. When a developer commits a file, it lights up and flies towards that developer. Files are colored according to their purpose, such as whether they are source code or a document. If files or developers have not been active for a while, they will fade away. A histogram at the bottom keeps a reminder of what has come before.
Thanks Alwyn for sending in the link!

Thursday
Jun122008

WarCraft III DotA Poster


Created by Alwyn B., this hierarchical tree shows the complex Hero Item recipes for the WarCraft III MOD "Defense of the Ancients". As a fan and a player of the game, Alwyn painstakingly created his own infographic and then posted in on the Internet to share with other players. This makes a fantastic poster!

More than just the item combinations, the poster shows:

  • Shows the basic items and how to combine them to form better items.
  • Shows where to buy them, and for how much.
  • Mini Map that shows shop locations
  • Shop Item Layouts
When I looked today, this chart had been viewed over 100,000 times. Great job Alwyn, and thanks for sharing.

Friday
Jun062008

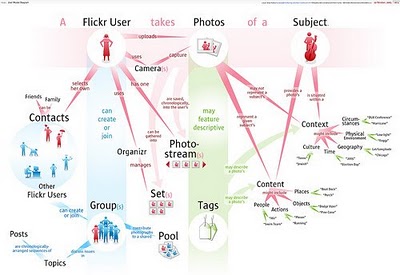
The Flickr User Model


Designed by Soldier Ant (his real name is Bryce Glass), the Flickr User Model attempts to map out the Flickr user experience. This is version 0.1, and I think he's working on version 0.3 now. Also linked on visualcomplexity.com

On his post on October 24, 2005, Bryce explains: "I've been doing some concept diagramming for work lately, and I've found myself enjoying it immensely. (...) However, since it's for work I can't share much of it. I did post some sanitized versions, with all the object-names obsfucated, but that just didn't seem wholly satisfying. So over the weekend I invested some time in a diagram that I can share with the internets: a simple Flickr user model (regrettably incomplete -- but I realized that if I tried to include the whole Flickr-verse that this diagram would go beyond labor of love and straight into excercise in folly)".
Thanks Rex for sending in the link!

Tuesday
May202008

TweetWheel


I just found TweetWheel, and its really cool. Made by Augusto Becciu.

Enter a Twitter ID (I used my ID: rtkrum), and in real time it will generate a connection wheel built from 100 people that person is following. Hover the mouse over any of the names, and it will show the connections that that person is also following on Twitter.

It takes a few minutes to load the user data.

Page 1 ... 3 4 5 6 7