About
Randy Krum
President of InfoNewt.
Data Visualization and Infographic Design

Infographic Design

Infographics Design | Presentations
Consulting | Data Visualizations

DFW DataViz Meetup

Join the DFW Data Visualization and Infographics Meetup Group if you're in the Dallas/Fort Worth area!

Search the Cool Infographics site

Custom Search

Subscriptions:


Feedburner

The Cool Infographics® Gallery:

How to add the
Cool Infographics button to your:

Cool Infographics iOS icon

- iPhone
- iPad
- iPod Touch


Read on Flipboard for iPad and iPhone

Featured in the Tech & Science category

Flipboard icon

Twitter Feed
From the Bookstore

Caffeine Poster

The Caffeine Poster infographic

Entries in connections (69)

Saturday
Dec122009

My Digital Life - personal infographic


My Digital Life, is an quick infographic by me!  A mindmap or network map of the digital products in my life, and how they all interconnect. Each connection is color-coded by the connection type (USB, wireless, ethernet, etc.) including its respective standard icon.  High-res version is on Flickr.

This started as a simple sketch to help me determine how to add a new external hard drive I got on Black Friday, but it quickly became much more fun to see how far out I could push the network.  I already know of some more that I want to add, so someday there may be a 2.0 version.  Apparently, I could use an IT manager at home.


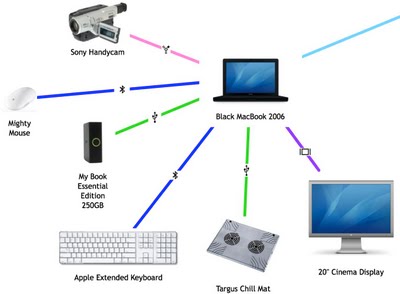
I did ignore some differences within the connection types to keep this fairly simple.  I don't distinguish between USB 1.1 and USB 2.0 connections.  I use "Display" as a connection type, but its a DVI connection for the MacBook, a HDMI connection from the AppleTV and a composite connection from the DVD player.  I also show only one "Wireless" connection, but I know that the iPhone only uses 802.11g and the laptop uses 802.11n.

I did this using OmniGraffle, with a little help from Pixelmator and Keynote to clean up the images.

Monday
Dec072009

A Visual History of the Supreme Court - New Infographic Poster!


Today, I want to share the launch of Timeplots.com.  A new infographic site focused on designing visual timelines by Nathaniel Pearlman and Frank Hamilton.  The Timeplots.com site launched today highlighting their first project; a poster called “A Visual History of the Supreme Court of the United States”.

This large-scale (48″x32″) print displays the full sweep of American federal judicial history from 1789 to 2009. It combines biographical information on every Supreme Court justice with a visualization of the influence of U.S. presidents and their political parties on the Court over time, and includes vote counts and summaries of landmark cases.

Months of work went into researching the history of the Supreme Court, and that effort really shows through in the level of detail in this poster.


It’s a good thing they offer this as a large format poster, because the detail draws you closer to discover the events and landmark decisions that are the colorful history of the SCOTUS (Supreme Court of the United States).


I love that even on their About page, they created small, infographic timelines as a visual of their individual experiences and career histories.  Here’s Nathaniel’s:


Timeplots has also started a new service, Timeplots on Demand:

Timeplots’ dedicated staff is ready to work directly with you to honor your own organization—your company, school, nonprofit, team, church, or family—with a custom Timeplot of your institution’s history. Let us help you collect data, create memorable images, and visualize the developments of your institution.

Congratulations to both Nathaniel and Frank!


Wednesday
Nov042009

XKCD: Movie Narrative Charts


Great post by the XKCD online comic series!  They occasionally post a infographic-style piece, and this one doesn't disappoint.

Created by Randall Munroe at XKCD, the Movie Narrative Charts plot the interactions between key characters on a timeline, grouping the character lines together when they are interacting in the movies.  He obviously spent some time working on these, and be sure to check out the detail in the full size version.


The last two are jokes, but the ones for Lord of the Rings, the original Star Wars Trilogy and Jurassic Park are real and very well done.  I love the Primer chart poke at trying to follow the movie!  Not as mainstream as the other movies, but it's definitely appropriate.  I'd love to see how Randall would chart Memento!

Thanks Tom for the email link!  Popular on the blogs, this was also found on Infothetics, FlowingData, SimpleComplexity, VizWorld and Fast Company.

Tuesday
Sep152009

Is the U.S. Too Dependent on Foreign Oil? (infographic)


The U.S. imports 60% of its oil requirements, and this infographic map shows the top 10 countries that are sending us their oil.  I think it will actually be quite surprising to most Americans how little is imported from the Middle East.
As much as 66 percent of all US crude oil is imported from other countries, and the amount of oil imported from OPEC nations is roughly equal to the amount of oil produced domestically. Petroleum, natural gas and coal are the primary sources of energy consumed in the United States because they are the most energy rich resources available. So far, renewables have only been capable of providing a small portion of total energy consumption, and their contribution to energy consumption has remained limited over the last two decades. However, with increasing government and private focus on green energy sources, renewables are likely to go from strength to strength in the near future.
Here's the original article by Callum James from ngoilgas.com.

Thursday
Sep032009

reMap: An Amazing Visual Browsing Interface to VisualCompexity.com


Bestario has created reMap, an interactive portal to view all of the infographics posted on VisualComplexity.com, and it's amazing.  They've created semantic connection between the different infographics using tags tat allow for an incredible browsing experience.

An interactive, visual browsing interface to an infographic archive.

reMap displays visualcomplexity.com projects allowing navigation using a semantic approach and depicting relations among them. All images and texts belong to vc portal. Tags are assigned using a semantic engine created by Bestiario.
Thanks Jose!  I love it!

Saturday
Aug222009

Create Your Own Facebook Network Graph


Create a graph of your own network of friends on Facebook with Nexus.  You've seen many visuals of Twitter and Facebook connections, but this one is especially cool because it's your own network.  That's my network chart is above, but you don't care about mine...go create your own!

Found on Twitter

Monday
Jul272009

Amazon Acquisitions infographic


Found on meettheboss.com, a decent infographic of the acquisitions that Amazon.com has made over the years.  Drawn like an org chart, I like that each branch represents another year, so it becomes a timeline.

Tuesday
Jun162009

The Conversation Prism 2.0 has been released!


Check out the new version of The Conversation Prism 2.0 by JESS3 and Brian Solis and theconversationprism.com.  Available as a poster for $20 US on thier website, and they also have some high-resolution versions available.

I love the design of this one.  It's seems to be essentially a mind map, but much easier to read and understand.

This is an update to the original Conversation Prism that you can see here on Flickr.

Thanks Dana!  I found the link to the 1.0 version on ON:Digital+Marketing

Friday
Jun122009

Web Trend Map 4.0


The great team at InformationArchitects.com released their updated version of the Web Trend Map 4. (They should call it 4.0)   You can buy it as a poster for $49 from their website, or they have also made a high-resolution version available.
iA's Web Trend Map plots the leading Internet names onto the Tokyo Metro system.
Paying attention to the intersections, we grouped associated websites and ensured every domain is on a line that suits it.  As a result, the map produces a web of associations: some provocative, some curious, others ironically accurate.
Why Tokyo Metro?  Because it works.

Friday
May222009

The Amazon Book Map


Now this is impressive.  Chris Harrison has created the Amazon Book Map using data scraped from Amazon and which books Amazon thinks are related to each other.
Aaron Swartz, who runs theinfo.org, contacted me back in January '08 with an interesting data set. He had built a list of 735,323 books by crawling Amazon. Of course a gigantic list is pretty boring, but Aaron had also captured similarity data between books. In particular, he had amassed a whopping 10,316,775 connections (edges) between books Amazon believed were related. This allowed me to throw the data into my old wikiviz engine to spatially layout a huge mosaic of books (I let it run for a 140 hours). Items that were noted as being similar had attractive forces, bringing them together, often into large groups. Unsurprisingly, when we color coded by Amazon book category, there was an obvious coalescence. The way various high-level categorizations mix and meet also seems fairly logical.
I produced a few versions of what I am dubbing the Amazon Book Map. The first visualization is a huge mosaic of book covers, tinted by their respective category colors. I can't produce this in one go at full resolution because the memory requires are enormous. The second version uses color-coded dots. 
As you zoom into the image, you can see its built using the book cover images with a color overlay depicting the category of the book.


Thanks to @anniesmidt on Twitter for the link to this one!