About
Randy Krum
President of InfoNewt.
Data Visualization and Infographic Design

Infographic Design

Infographics Design | Presentations
Consulting | Data Visualizations

DFW DataViz Meetup

Join the DFW Data Visualization and Infographics Meetup Group if you're in the Dallas/Fort Worth area!

Search the Cool Infographics site

Custom Search

Subscriptions:


Feedburner

The Cool Infographics® Gallery:

How to add the
Cool Infographics button to your:

Cool Infographics iOS icon

- iPhone
- iPad
- iPod Touch


Read on Flipboard for iPad and iPhone

Featured in the Tech & Science category

Flipboard icon

Twitter Feed
From the Bookstore

Caffeine Poster

The Caffeine Poster infographic

Entries in context (4)

Wednesday
Aug172016

The Fastest Men in the Olympics Since 1896

The Fastest Men in the Olympics Since 1896

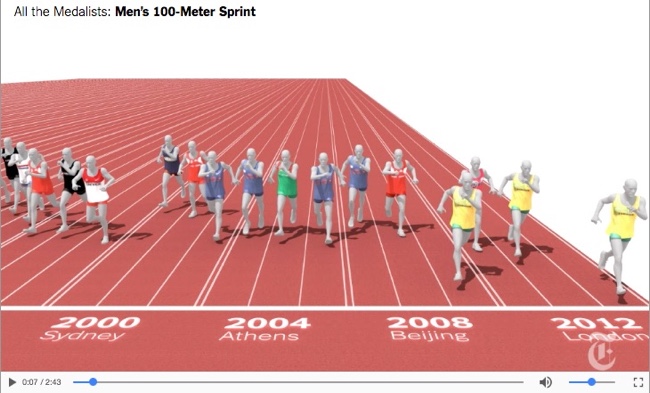
To put Usain Bolt's 3rd consecutive Olympic Gold Medal for the 100m dash into perspective, the NY Times designed this great graphic showing Usain Bolt and the Fastest Men in the World Since 1896 – on the Same Track.

Usain Bolt’s historic third consecutive gold medal in the men’s 100-meter dash cemented his status as history’s greatest sprinter and the world’s fastest man. He edged out Justin Gatlin, an American, and Andre De Grasse, a Canadian, on his way to the gold.

But how does Bolt compare to the full Olympic field in the 100-meter dash – not just this year, but against every Olympic medalist since 1896? To answer that question, we created a massive (and imaginary) track with 88 lanes – one for every medal awarded in the 100-meter dash in the modern Olympics.

We then pitted these runners against each other in an imaginary race, using their average speeds. We froze all the runners at the moment the winner crossed the finish line.

This is an update to the same graphic they created in 2012 when he broke his own World Record. The 2012 piece also included this great infographic video explaining the significance of his win:

Found on FlowingData

Tuesday
Oct292013

How Many Jelly Beans Do You Have Left?

The Time You Have (in Jelly Beans) is a great visualization in video of how many days are available to each of us during our lives.  Created by Ze Frank from Buzzfeed.com.  What will you do with the jelly beans you have left?

Found on Elite Daily.  Thanks to Mary Kaye for the link!

Friday
Oct182013

A Perspective on Time

A Perspective on Time infographic

A Perspective on Time is an infographic that puts large time scales into perspective using a series of stacked bar charts.  Starting with 24 hours, and building up to the life of the universe, each horizontal bar represents a new, larger time scale that incorporates the prior bar for context.

Humans are good at a lot of things, but putting time in perspective is not one of them. It’s not our fault - the span of time in human history, and even more so in natural history, are so vast compared to the span of our life and recent history that it’s almost impossible to get a handle on it.

Designed by Mayra Magalhães as a collaboration project between Visually and wait but why.  I love the building use of color throughout the design.  One bar’s color is then carried into the next bar for context.  The icons and minimal text for events also help make the design easy to read.

The footer should include the URL back to the original so readers can find the full-size version.  The scale of this design needs to be enlarged in order to read.

Friday
Sep062013

Visualizing the Microsoft-Nokia Deal

Visualizing the Microsoft-Nokia Deal

Good data visualization uses visuals to put data into context for the readers, making the information easier to understand.  This simple infographic takes a couple charts previously published by Nielsen, and uses them to provide context to the news story of Microsoft acquiring Nokia’s handset devices unit for $7.2 Billion.

Combining data visualization with text and images should make the information easier and faster to understand, and this design does a great job.

Designer unknown.  Thanks to Mike Elgan for posting on Google+ and Luke Millar (@ltm) for posting on Twitter.