About
Randy Krum
President of InfoNewt.
Data Visualization and Infographic Design

Infographic Design

Infographics Design | Presentations
Consulting | Data Visualizations

DFW DataViz Meetup

Join the DFW Data Visualization and Infographics Meetup Group if you're in the Dallas/Fort Worth area!

Search the Cool Infographics site

Custom Search

Subscriptions:


Feedburner

The Cool Infographics® Gallery:

How to add the
Cool Infographics button to your:

Cool Infographics iOS icon

- iPhone
- iPad
- iPod Touch


Read on Flipboard for iPad and iPhone

Featured in the Tech & Science category

Flipboard icon

Twitter Feed
From the Bookstore

Caffeine Poster

The Caffeine Poster infographic

Entries in history (262)

Tuesday
May232017

How Do You Spend the Days of Your Life?

How the Average Working Adult Spends Days

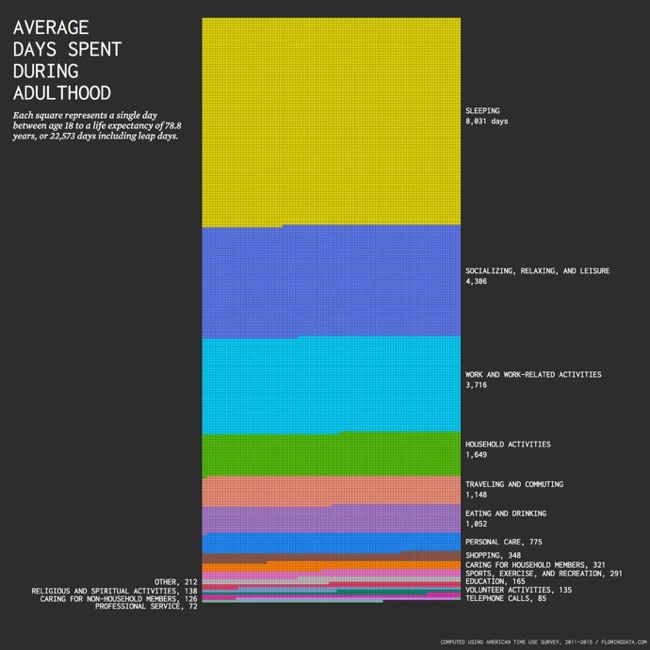
Nathan Yau from FlowingData has taken an in-depth look at the statistics behind How the Average Working Adult Spends Days in their lifetime.

There were some graphics going around that showed the total amount of time spent during an average person’s lifetime doing things. The numbers were pretty rough though.

For example, to calculate the number of days spent sleeping during a lifetime, it was assumed that the average person sleeps eight hours per day, and then estimates just extrapolated for life expectancy. But sleep patterns change as you age. You start to sleep less as you get older.

So I tried taking this into account using data from the American Time Use Survey. I still used averages, but I calculated averages for each year of life and then aggregated. Here’s what I got for adulthood (18 and older) — the time you’re presumably making your own choices. Employment and retirement are assumed.

Again, these are still averages for an adult who works and then retires around 65 years, so the same caveats apply as usual. Everyone’s own totals will be a bit different, especially as you compare across groups. For example, the time distribution for parents looks different from the distribution for those who never have kids. Similarly, some never enter the labor force whereas others work full-time.

The data is from the American Time Use Survey, which is made more easily available from IPUMS. After downloading data for 2011 through 2015, I tabulated and charted in R. Also, maybe you noticed that the number of squares doesn’t quite add up to 22,573. This is due to rounding, which offset the total above by three days.

I prefer data visualizations like this that show the actual number of days as squares (or other shapes/icons) instead of summarizing them together into a stacked bar chart or a doughnut chart. Seeing the full number of days represented gives the readfers a better understanding of the true magnitude of the values being shown

Found on Big Think

Thursday
May042017

Evolution of the Game Console

Evolution of the Game Console infographic

The Evolution of the Game Console infographic from OnBuy.com remembers our childhood with a timeline of the last 18 major game consoles.

Bound to bring back fond childhood memories, (for most of us!) our infographic takes you through the fascinating evolution of the home games console. Dating back to 1972 when the Magnavox Odyssey was released, our infographic will guide you through the technological advancements of the last 45 years, right up to Microsoft’s 4K-ready Project Scorpio, set to launch in December 2017.

Intrigued? We bet! Now, kick back, relax and enjoy the wonderful world of gaming.

As much as I like the content and remembering playing on the consoles, this timeline is not well designed. It's not that hard to actually line up the consoles with the correct years instead of just showing them in pairs no matter what the dates are. Why even bother putting them into chronological order if you're not going to line them up correctly?

For businesses, a timeline history of their industry is a great topic idea for an infographic.

Thanks to David for sending in the link!

Tuesday
May022017

A History of Space Travel infographic poster

A History of Space Travel is a new infographic poster from Pop Chart Lab that covers the spacecraft, launch vehicles, space suits and mission timelines from countries all over Earth. Prints of this 24"x36" poster are available for $35 unframed, or more for framed options.

Make some space on your wall for our second infographic foray into the final frontier! This timeline of crewed space missions maps out over 400 extraterrestrial expeditions, spanning 1961 to present day. From the inaugural space race of Vostok vs. Mercury to the famed Apollo program to the International Space Station, this giant leap of a chart features stellar annotations for each mission, including full-color illustrations of all spacesuits and spacecraft. A simply stunning celestial survey, this chronicling of cosmic voyages is sure to have starry-eyed enthusiasts totally over the moon.

Friday
Apr212017

534 Apple Products On One Giant Poster

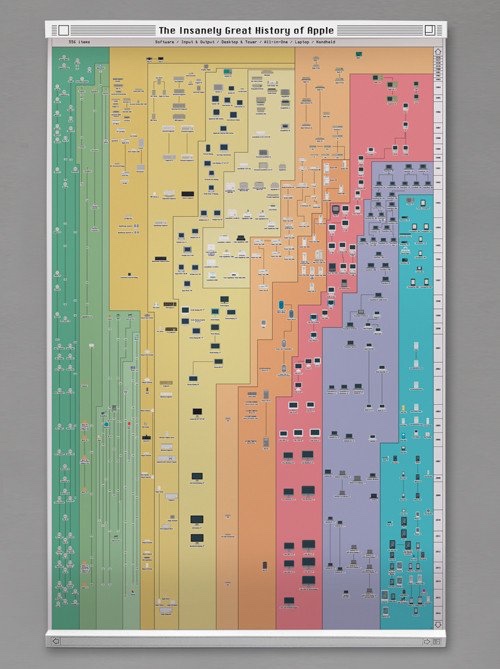
534 Apple Products on One Giant Poster are included in The Insanely Great History of Apple 3.0 poster from Pop Chart Lab. It is the new and improved list of all Apple products ever made! You can buy a 28"x 42" print of the infographic here.

Newly refreshed with recent Apple products including the 9.7" iPad Pro and the iPhone SE, the world's most comprehensive mapping of Apple products is back just in time for Apple's 40th Anniversary--and is now printed on demand on beautiful exhibition canvas! This classic gallery of proprietary gadgets displays every computer, handheld, peripheral, software, and operating system released by Apple from 1976 onward. Over 500 items in all, chronicling how Apple has invented—and reinvented—insanely great products.

What's more, this canvas print comes bundled with laser-engraved System 6 Window Bar Rails for a throwback-OS mounting solution.

Found on Fast Company Design!

Friday
Apr142017

The Best Times to Post to Social Networks

The Best Times to Post to Social Networks infographic

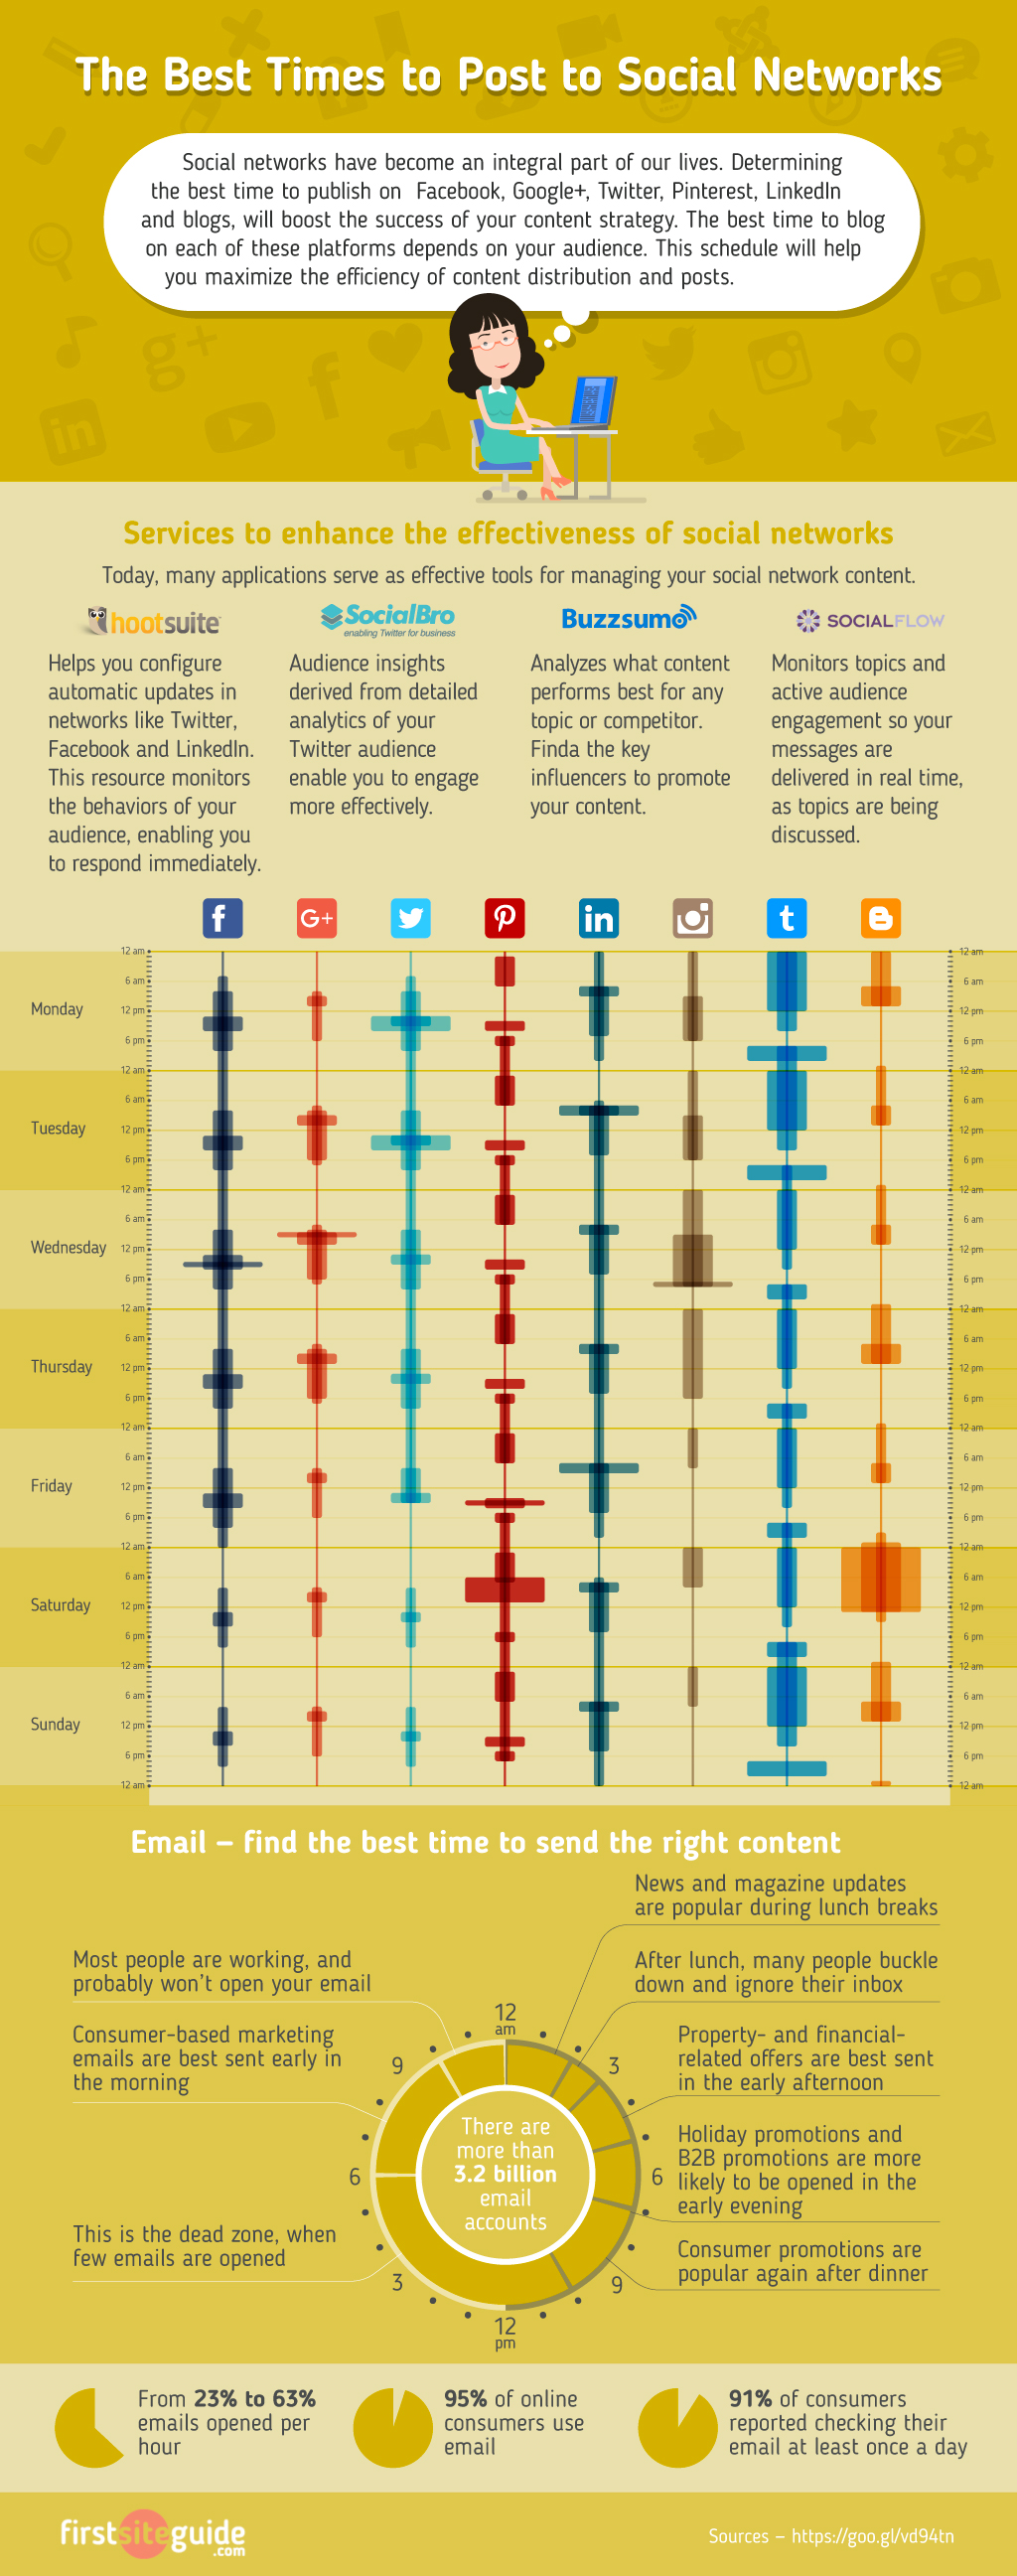
When you are promoting your product through social media platforms, you want to make sure you are setting yourself up for success. First Site Guide has published the The Best Times to Post to Social Media infographic cheat sheet gives you data on the daily high traffic times of each platform to increase the likelihood of your post being seen. It also gives tips on times to send emails based on your content. 

Social media’s all about throwing the metaphorical spaghetti at the wall and seeing what sticks, right? No. No, it’s not! Chances are good you saw that twist coming, but this First Site Guide cheat sheet is all about why time and type matter on social media. Believe it or not, there is a rhythm and a pulse to the tweets and the posts, and patterns of sharing and engaging with content which can be examined scientifically.

Why should you care, though? Well, as it turns out, knowledge is power and someone who knows when to post, where to post, what to post, and how often to post gets a lot more bang for their buck than someone who just sporadically adds random content to whichever social media platform has their attention.

Knowing your audience is an important part of the process. Did you know that emails containing news and magazine updates get opened more often during the lunch hour, but holiday promotions are best sent in the evenings?

There's some really good information here that was gathered from a number of different sources. However, I have a handful of serious issues with this design:

  • Is this data credible? I can't tell from what is shared on the infographic itself. The Sources link is just a shortened URL, so no visibility to where the sources of the data.
  • The Sources link is a downloadable Word DOC from a Russian cloud stoage site. The document includes nine links to data sources, but many of them are broken links.
  • Is the data visualization, I'm guessing the wider sections of the stream are the better times to post. There's no explanation.
  • For the Email section, the time wheel has the days and nights reversed (AM vs. PM). We don't all go to sleep for six hours after lunch.
  • A couple of text typos in the infographic.
  • The footer should include a copyright and the URL to the original infographic landing page so readers can find the full-size original when people don't share the actual link.
  • How do time zones play into these times and scheduling posts?

Thanks to Peter for sending in the link!

Wednesday
Mar292017

Visualising The Beatles Signed Book Giveaway

Don't miss your chance to register for the Giveaway in March! I have one SIGNED COPY of the new infographics book Visualising The Beatles by John Pring and Rob Thomas!

Register below by 11:59pm CT on March 31, 2017 to be entered. A winner will be randomly selected on April 1st.

This is the story of the Beatles told as never before.

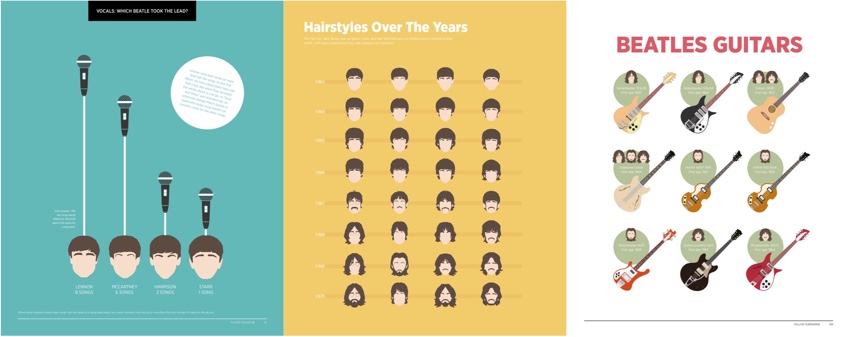
Explored visually, through stunning infographics and data visualisations, this book takes you on a vibrant ride through the Beatles years – from their first Cavern Club gig to the release of Let It Be.

Presenting unique, witty and surprising facts and stories, covering everything from their style to plans
for a Beatles Island, Visualising the Beatles charts how four young men evolved into one of the world’s greatest bands. It also includes beautiful visuals created from the data their music left behind, divided by album, to allow you to spot, in an instant, the patterns, anomalies and changes in the band’s lyrics, instruments, songwriting and performances.

The perfect gift for any fan of the Beatles or infographics.


Monday
Mar202017

What 770,000 Tubes of Saliva Reveal About America

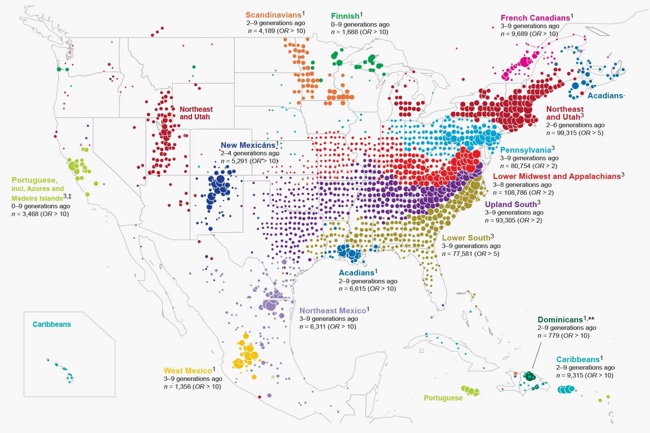
Yep, it's a Map of America’s Diversity using the genetic data from the analysis of saliva samples. Ancestry.com gathed the data from 770,000 salva samples.

This unique map shows this country’s great migrations, the echoes of our pioneer ancestors in our genes today.

Each color on the map represents a present-day community of individuals tied together through their genetics. And the location of the dots show where each community’s ancestors lived over generations.

People moved east to west, less so north to south. See how the differently colored clusters form distinct horizontal bands? The red, blue, purple, and green dots fan out from right to left. This pattern means DNA confirms the descendants of immigrants to the East Coast moved westward.

While people certainly moved back and forth from the north to south as well, if people had moved in the same volume from north to south, you’d see the bands fanning downward and not just from east to west.

But instead you can see powerful forces pushed people westward, even showing that the Mason-Dixon line separates some of the clusters.

Catherine Ball, chief scientific officer at Ancestry and the leader of the study, commented to Wired“I have to admit I was surprised by that. This political boundary had the same effect as what you’d expect from a huge desert or mountain range.”

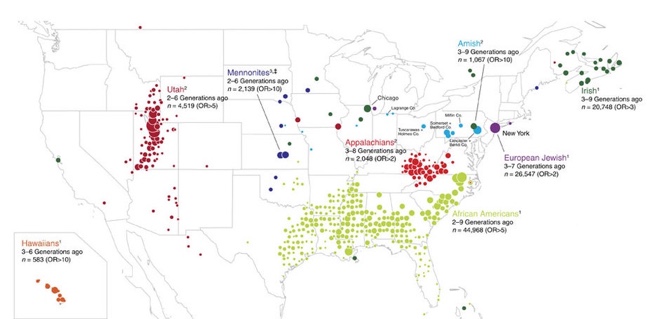
And not only can you clearly see the migration patterns westward, you can also see distinct communities of immigrants and their descendants.

Maps were generated with the maps R package using data from the Natural Earth Project (1:50 m world map, version 2.0). These data are made available in the public domain (Creative Commons CC0).

Also from the original study:


Saturday
Mar042017

Planes, Trains & Automobiles of U.S. Presidents

Official Vehicles of the President of the United States – TitleMax.com – Infographic

Official Vehicles of the President of the United States is an infographic from TitleMax showing the evolution of the vehicles used by Presidents throughout our history.

When the POTUS (President of the Unite States) has to get around, he usually does it in style. And if he’s not in style, at least we know that he’s often surrounded by millions of dollars’ worth of security detail.

Yes, for the U.S. president, cars and vehicles have always been expensive, as has been Air Force One. History has put a spotlight on the presidents’ one-of-a-kind planes: mobile White Houses, with all of the protections therein.

This information is much better shown visually like this infographic than a text bullet list. I would like to see them placed on a timeline to better line them up and show where their use overlapped.

The infographic itself is missing a copyright statement, a citation of sources, and the URL for readers to be able to find the origial full-size infographic published by TitleMax.

Found on Infographic Journal

Friday
Feb172017

A Year of Driving 2016

A Year of Driving by Automatic infographic

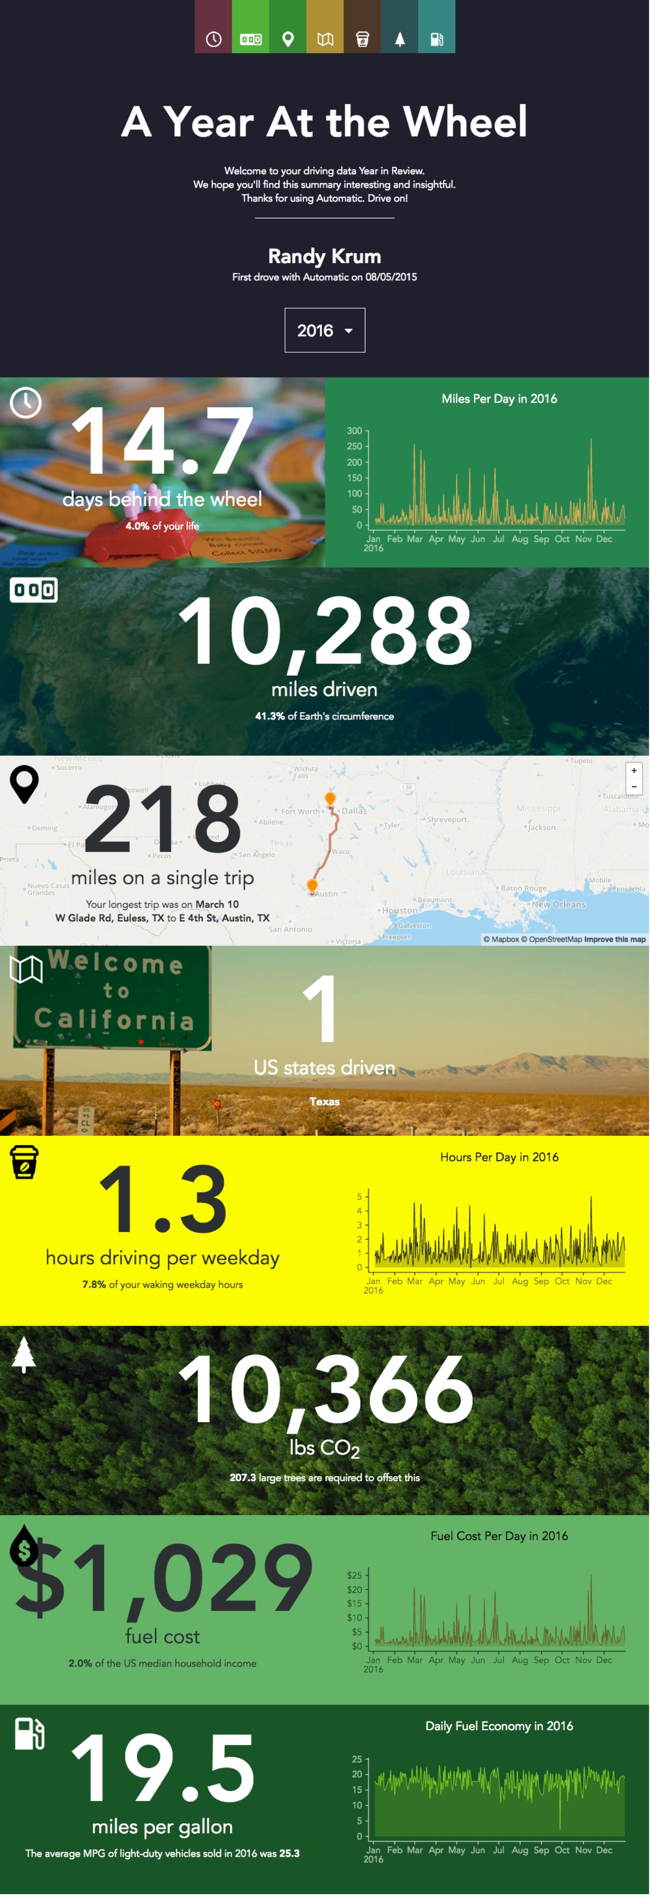
A Year At The Wheel. If you are an owner of an Automatic connected car adapter, they create a personalized infographic with your own custom data.

A number of companies have started creating personalized data visualizations and infographic for their customers, which is a trend that I really like. As part of Automatic Labs, the Year In Review graphics give you insights into your own personal driving history data that you couldn't see anywhere else. One of many ways they are experimenting making your personal big data useful.

Big fonts are not data visualizations! My biggest critique is that there are sections that just show the data value in a big font. They were too lazy to create visualizations for the comparisons. For example, they took the time to calculate that 10,366 lbs of CO2 would require 207 large trees to offset, but a visual of 207 tree icons would be way more impactful!

Wednesday
Feb152017

Bold & Justified: The Huge World of Typography

Bold & Justified: The Huge World of Typography infographic

Coulor Lovers has done some etensive research on typography and has compiled it into their Bold & Justified: The Huge World of Typography infographic. A lot has changed since 1452 when the first movable type was invented. Now every business and brand can have their own unique typeface.

Comic Sans is installed more on PCs. Why so serious Linux & Mac? That's just one of the many things we discovered while looking into the creative history of typography aka fonts. They play a huge part in branding and logos. They bring us the words in the stories we read. They add personality to a message. ... and with CreativeMarket.com, our new marketplace for beautiful design content like fonts launching soon, we wanted to bring the typographic history, usage & character to life. Get your typographic love on!

The content in this one is fantastic, but they took some creative liberties when it comes to visualizing the data. A common error is sizing circle incorrectly by changing the diameter to match the data instead of the area (See more HERE). The lengths of the ties in the Style section is just creative illustration, and doesn't match the data values. The doughnut chart on the "Type On The Web" section doesn't add up to 100%!

I love the depth of details they put together, but the data visualization details are disappointing.