About
Randy Krum
President of InfoNewt.
Data Visualization and Infographic Design

Infographic Design

Infographics Design | Presentations
Consulting | Data Visualizations

DFW DataViz Meetup

Join the DFW Data Visualization and Infographics Meetup Group if you're in the Dallas/Fort Worth area!

Search the Cool Infographics site

Custom Search

Subscriptions:


Feedburner

The Cool Infographics® Gallery:

How to add the
Cool Infographics button to your:

Cool Infographics iOS icon

- iPhone
- iPad
- iPod Touch


Read on Flipboard for iPad and iPhone

Featured in the Tech & Science category

Flipboard icon

Twitter Feed
From the Bookstore

Caffeine Poster

The Caffeine Poster infographic

Entries in holiday (42)

Thursday
Dec132012

The New Christmas Tradition...Artificial Christmas Trees!

The New Christmas Tradition...Artificial Christmas Trees! infographic

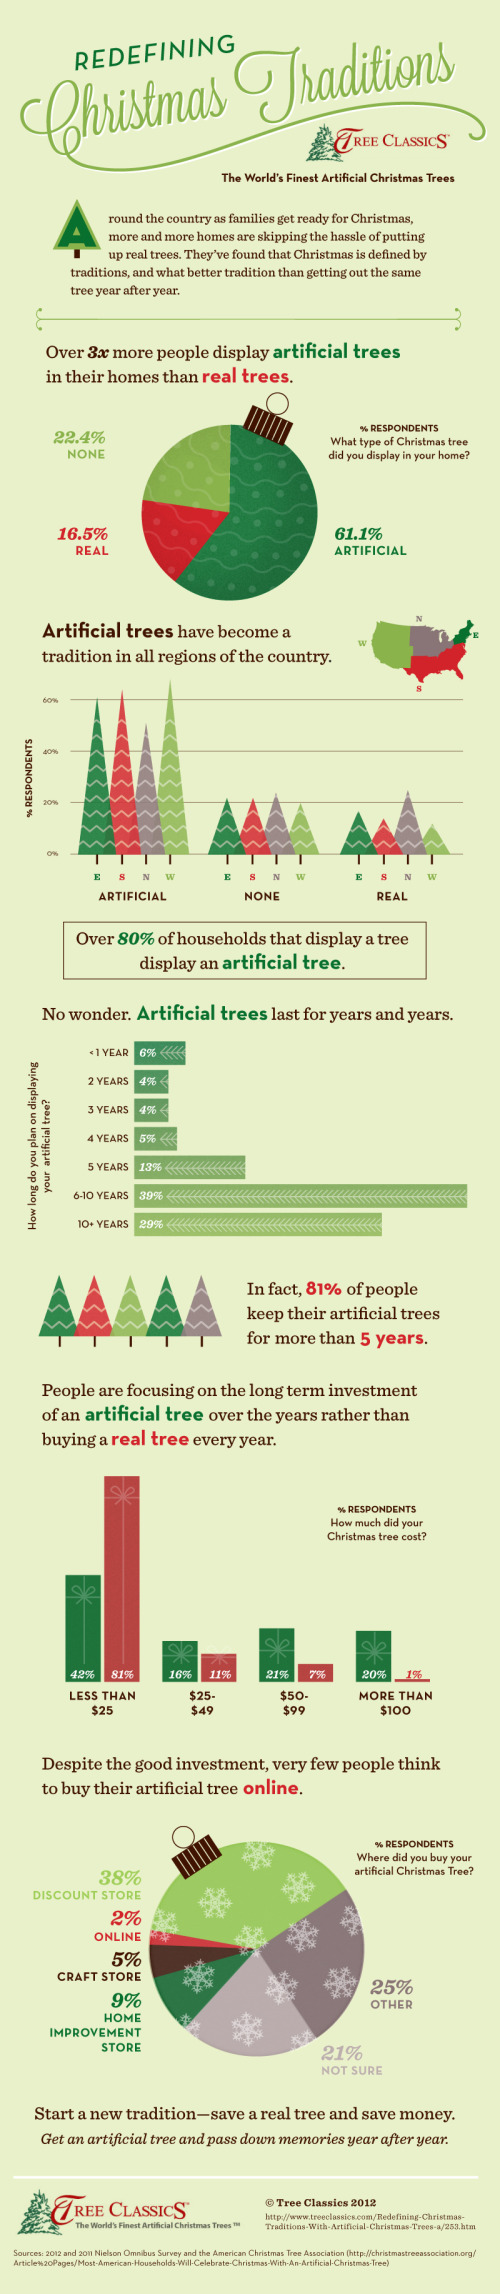
Wow!  Apparently the U.S. has completely converted over to artificial Christmas trees while no one was looking!  The Redefining Christmas Traditions infographic from Tree Classics is a summary of findings from two Nielsen studies in both 2011 and 2012 and information from the American Christmas Tree Association.

Every Christmas tradition begins somewhere, and those of us who follow Christmas tree trends know that more and more families are building their holiday traditions around artificial Christmas trees. Find out who’s buying artificial, where they live, and why more and more people are choosing artificial in our infographic of real vs fake artificial Christmas tree facts. If you’re thinking of starting a family tradition of your own, consider buying a Pre Lit Christmas Tree from Tree Classics and start making holiday memories that will last year after year!

The design does a great job of jumping to the main point right away.  A huge majority of homes in the U.S. use artificial Christmas trees for the holidays.  This is the Key Message of the design, and it communicates that fact in less than 5 seconds to the readers.  So even if they don’t read the rest of the design, they still understand the main point.  Also, what makes a popular infographic is bringing to light some surprising, unexpected information to the readers.

The shear magnitude of the number was surprising to me, and I think it will be to a lot of readers.  We see real live Christmas trees being the symbol of home and family traditions in the media, but the reality is that 3.5x more homes display artificial trees than live ones.

All of the important design elements are there.  Focused topic, clear data visualizations to support the Key Message, respectable sources cited, copyright statement and the URL to the original infographic so readers can find the full-size version.

Designed by InfoNewt with designer Jeremy Yingling

Tuesday
Dec112012

The Ultimate Guide to Secret Santa

The Ultimate Guide to Secret Santa infographic

The Ultimate Guide to Secret Santa is a fun design for Christmas from MoneySupermarket.com in the UK (so the currency amounts are in British Pounds).  This office traditional strikes fear into many employees that fear getting the gift wrong.

Oh, the joys of working in an office at Christmas time.  Festive decorations, the office party and of course the exchange of “Secret Santa” presents make corporate Yuletide a truly eventful experience. 

Secret Santa involves the anonymous exchange of cheap gifts at Christmas time, typically between office workers.  It is a fun test of your resourcefulness and innovation as you endeavour to buy a present that your colleague will either love, or will find ironically hilarious.  If you go for the humorous option however, it is important to ensure that your colleague will understand and appreciate the joke!

If you are struggling for inspiration this year, hopefully our Secret Santa infographic will provide some ideas.  If you’d rather not play this year and make some savings on your Christmas present budget, we still think you’ll enjoy what we’ve come up with…

The first thing you’ll notice about this design is that it’s an animated GIF file.  A flashback to 90’s web design, this has been pretty tastefully done to only animate the characters eyes to blink and the title text.  You don’t see this in infographic design very often, and I think it was very well done here.

Both a copyright statement and the URL to the original infographic landing page should have been included in the footer space.

Thanks to Paul for sending in the link!


Monday
Dec102012

The Christmas Bugs: Adopt-A-Bug this holiday

The Christmas Bugs infographic

The Christmas Bugs infographic from Adopt-A-Bug and ChristmasTreeMarket.com helps raise awareness of the plight many bugs face as the weather begins to get cold.  This Christmas bring some tiny friends in from the cold and into your warm home when you buy a live Christmas tree for the holidays!

Adopt-A-Bug this year for the holidays!  Bringing a live tree into your home is like inviting the great outdoors into your living room.  Here are a few new friends you can make that will decorate your tree and light up your life, plus some statistics to share over your eggnog.

The design combines facts and statistics about the different types of bugs that actually live in the trees that most people use as Christmas trees.  I love the fun approach to raise awareness that there is a real risk to bringing a live Christmas tree into your home.  Check out the Adopt-A-Bug site to see all of the party bugs that you can save this Winter by bringing them into your home!

Designed by InfoNewt with designer Ray Vella, this infographic gets all the key design points right.  Nice 3-part story throughout the design, including a clear call-to-action at the end.  Copyright statement, clear sources and the URL to the infographic landing site.

Monday
Dec032012

The History of the Christmas Tradition

The History of the Christmas Tradition infographic thumbnail

The History of the Christmas Tradition infographic timeline from Balsam Hill visually lays out the events from Culture, Decorations, Traditions and Historical Characters that over hundreds of years have shaped the current Christmas holiday.

Across the world, Christmas is celebrated in a multitude of rich and cherished traditions. Their origins are wonderfully varied, emerging out of cultures and beliefs throughout history. This illustrated timeline, brought to you by Balsam Hill, captures the flow of some of the most popular Christmas traditions and figures and traces their simple lineage from St. Nicholas’ humble beginnings to today.


The History of the Christmas Tradition infographic

This design is a great example of Online Lifespan for infographics.  The topic is timely and popular during the month of December, but not tied to a specific trending topic from 2011.  Therefore, this design will generate ongoing traffic, links and views every year for Balsam Hill as new readers discover it each year for years to come.

Designed by InfoNewt with designer Jeremy Yingling, the design takes a more classic approach the the illustrations on the timeline by using historical images that instantly make the events relevant and recognizable to the readers.  The four, parallel timelines show the reader how events combined over time, combined into the Santa Claus and Christmas we know today.  The layout makes it easier for the readers to see how separate songs, books and parades began to converge into one story.

Monday
Oct292012

Halloween Statistics 2012: Creepy Calculations

 Halloween Statistics 2012: Creepy Calculations infographic

It is that time of the year again! Halloween is the perfect time for costumes, scary movies, and Charlie Brown! How do you spend your halloween? Halloweencostumes.com has put together some Creepy Halloween Statistics to show some of this holiday’s most popular happenings. 

What are you most looking forward to this Halloween? Collecting copious amounts of your favorite candy? Dressing up in a trendy  costume? Enjoying a horror movie marathon? Find out what other Americans will be up to this year, with our Ultimate Visual Guide to Halloween Statistics! You’ll discover popular costumes for you and fido, a count-down of the best sweet treats, suggestions for a Halloween playlist and more spooktacular stats!

I really like this design.  The color scheme, the design style, and the easy-to-understand top-to-bottom progression of information.  There are a few statistics that I would like to see visualized, like the Trick-or-Treating By The Numbers section where the values are only shown in big fonts.  I really like the different moon phases to visualize the stats at the top.

The Top 5 lists are a little text-heavy, and it would have been nice to see movie posters or CD artwork to go along with the entries.

In the footnote at the bottom, missing are both a copyright statement (or Creative Commons) and a URL link to the original infographic landing page so readers can find the full-size version.

Thanks to Elise for sending in the link!

Tuesday
May292012

The History and Beginnings of Memorial Day

The History and Beginnings of Memorial Day

The History of Memorial Day does a good job of explaining the background history of the Memorial Day holiday in the U.S.  

Learn about how we celebrate memorial day and how it was formed in the United States.

We work hard to bring you insight to memorializing a loved one at In the Light Urns. Information provided through graphics can really help communicate the important points and we really enjoy using the infographic approach to discussing memorials. Visit our military urns page for more information on memorializing a veteran.

Nice, clean design that blends the use of data visualizations and icons to explain some of the history.  Some basic things are missing at the bottom of the design though: Company logo, copyright statement and the URL to the original landing page.  You can’t assume that people who share your infographic will also share additional information from your landing page.

Thanks to Susan for the link!

Wednesday
Dec212011

Christmas Drinks (alcoholic) from Around the Globe

Now here is a fun holiday infographic!  Direct from Kringle’s Bar at the North Pole is Christmas Drinks from Around the Globe, brought to us this holiday season by Treetopia.com.

Santa’s been throwing ’em back for a few centuries and has zipped around the world a thousand times, which has been plenty of time to pick up some wicked Christmas cocktail recipes. In this infographic from Treetopia are some of his favorite mixed drinks he’s collected from around the globe - complete with easy-to-follow mixing instructions. More than just your father’s traditional eggnog recipe!

Whether you have family coming to your house, or you’re going to visit family, you will probably have the opportunity to try one of these recipes out in the next couple of weeks.  Although, some of these recipes are a little more complicated than just mix & serve.

I love the color-coded pie charts to show the main ingredient proportions, especially the peppermint swirls in Candy Cane Eggnog.  The cocktail glass illustrations can be misleading though, since the eggnog recipe actually makes almost a gallon of nog.  What a fun idea for a Christmas infographic!

Thanks to Greg for sending in the link!

Please don’t drink and sleigh!

Tuesday
Dec202011

FREE Infographic Holiday Cards (LIMITED SUPPLY)

As they have for the past few years, our friends at FUNNEL have reserved 50 sets of FREE Infographic Holiday Cards just for readers of Cool Infographics!  (U.S. and Canada addresses only)  This year’s design is called “Snowplowed” (image above), and includes a 4-card pack that are blank on the inside.  You must request your free cards by Wednesday, December 21st!

Funnel’s Holiday Card Packs are ready to ship to clients, friends and fans of information design to show our appreciation. To get your free 4-card pack featuring this year’s illustration “Snowplowed” follow the link to our holiday sign up page at http://www.funnelinc.com/holiday/ (US/Canada only, while supplies last, offer good until 12/21/11). For all our wonderful fans around the world, please enjoy our free wallpapers to dress up your iPhone or monitor. Cheers!

Supplies are very limited, so when you enter your information, make sure you select “Cool Infographics Blog” under “How did you hear about us?” to get some of the cards reserved for you.

While you’re on the FUNNEL site, check out the FREE wallpaper images for iPhones and Monitors!

Thanks to Lin and Lori at FUNNEL for this special treat just for Cool Infographics readers!

Wednesday
Dec142011

Infographic Christmas Card from Australia

Lee Jackson is a freelance designer in Sydney, Australia, and sent out this infographic Christmas Card looking at the unique Christmas experience in Australia.

A shameless piece of self promotion for Christmas is always good. We call it a Christmas card. This year, I wanted to create something that would engage the reader in a in old fashioned way – reading! No bells, no whistles just a simple Infographic to display just how great it is being in Oz for Christmas…

- Lee Jackson

I love this idea for a Christmas card!  Shrimp on the barby sounds like a good Christmas meal to me too!

The sizes of the wildlife silhouettes aren’t accurate to the numbers, but the comaprison from 27 million to 138 wouldn’t actually be visible and the message would be lost.  I love the old-style airport/train station arrivals and departures board to show the top 5 countries travelling in each direction.

Based on Lee’s “My Day in Beverages”, I’m guessing Christmas will be a good day for him.  Cheers!

Friday
Dec022011

Client Infographic: The Visual History of Christmas Trees

The Visual History of Christmas Trees is a new infographic from ChristmasTreeMarket.com.  Designed by InfoNewt and designer Jeremy Yingling, this one creates a visual timeline of the major milestones for the Christmas Tree mostly focused on the last 100 years.

The history of the Christmas tree has garnered a lot of fascinating points over the years. A tradition with humble beginnings in 15th century Latvia, the festive tower of foliage has grown to be one of the holiday season’s most beloved symbols. From the first decorated tree in 1600 to Gubbio, Italy’s 650-meter tall wonder, get a glimpse of Christmas tree history through this handy visual guide from Christmas Tree Market.

This one was a lot of fun, and of course is timed to be appropriate for the holidays.  I love how this design turned out, and it was a unique topic that had not received a thorough infographic treatment before.  The design challenge was letting the images shine, keeping the text to a minimum, but still providing the reader with a lot of interesting information.

No matter which side of the Live Tree vs. Artificial Tree debate you fall on, you'll find lots of good information in the infographic.  I bet you'll even learn something you didn't know.  I'm still fascinated by the upside-down Christmas Tree!