About
Randy Krum
President of InfoNewt.
Data Visualization and Infographic Design

Infographic Design

Infographics Design | Presentations
Consulting | Data Visualizations

DFW DataViz Meetup

Join the DFW Data Visualization and Infographics Meetup Group if you're in the Dallas/Fort Worth area!

Search the Cool Infographics site

Custom Search

Subscriptions:


Feedburner

The Cool Infographics® Gallery:

How to add the
Cool Infographics button to your:

Cool Infographics iOS icon

- iPhone
- iPad
- iPod Touch


Read on Flipboard for iPad and iPhone

Featured in the Tech & Science category

Flipboard icon

Twitter Feed
From the Bookstore

Caffeine Poster

The Caffeine Poster infographic

Entries in holiday (42)

Tuesday
Nov222011

Crazy for Black Friday Deals


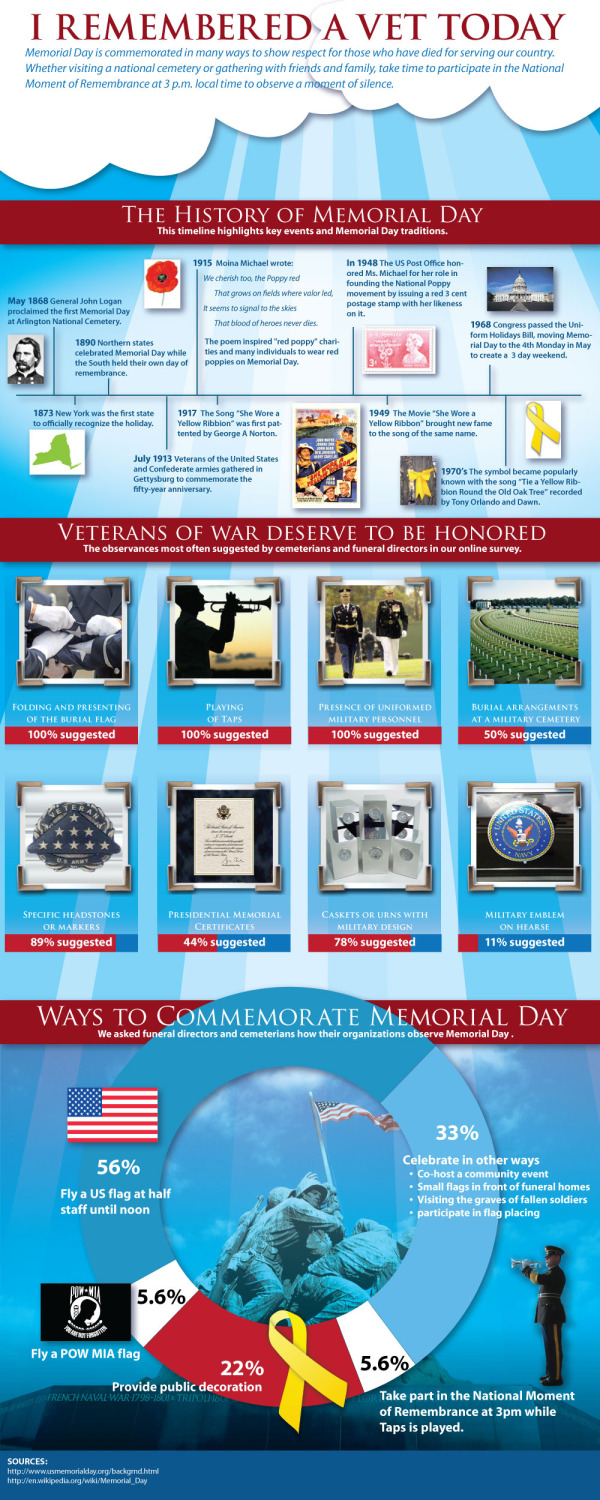
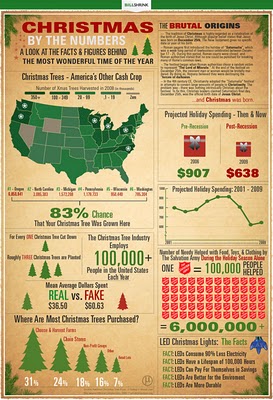
In honor of our upcoming shopping holiday, Crazy for Black Friday Deals from BradsDeals takes a look at some of the stats behind Black Friday (day after Thanksgiving) shoppers.

BradsDeals created a Crazy for Black Friday Deals infographic to illustrate historical Black Friday figures as well as the shopping trends and predictions for this year’s holiday.

If you live in Minnesota, congratulations, you live in the most Black Friday crazy state in the country. And while Black Friday fans in major cities like New York, Los Angeles and Chicago may be more likely to cruise Black Friday deals on their smart phones than shoppers in smaller towns, the Dallas suburb of Carrollton blows everyone out of the water with 60% of Black Friday searches happening on mobile devices. WOW.

I live near Carrollton, but I wouldn’t consider it a particularly tech-savvy area.  Apparently, they’re good with mobile shopping…who knew?

Of course, I get tons of Black Friday infographics submitted to the site, but I really liked the design of this one.  The information is visualized in a clear, easy-to-understand design. The visuals are simple and relate to the data.  Maps for cities, calendar for days shppers make plans, doughnut diagrams for percentages and silhouettes of top products.

On the other hand, there doesn’t seem to be a cohesive story to this infographic.  It’s a collection of disconnected data points about top cities, mobile trends, top products and when shoppers make plans.  Also, the design is missing a list of the data sources, the URL for readers to find the original posting, a copyright or creative commons claim and recognition of the designer.  Why should we trust any of these statistics?

Thanks to Amanda for sending in the link!

Thursday
Oct132011

Sukkot-A-Palooza

I didn’t know what Sukkot was, but I know much more now.  Sukkot-A-Palooza is a new infographic design from Mike Wirth and David Silverberg that tries to help explain the Jewish holiday of Sukkot to the rest of us.

Sometimes call the Jewish Thanksgiving, Sukkot, the Feast of Booths and Tabernacles, is a celebration of the harvest and autumnal season.  Families build a Sukkah, a basic walled structure, to eat, pray and sometimes even sleep in for seven days.

I’ll admit I still don’t really understand Sukkot, but I know way more than I did before.  How many people actually build Sukkahs?  I don’t recall ever seeing one before.  The design is very text-heavy, but it is very educational.

Thanks to Mike for sending in the link!

Monday
May302011

The History of Memorial Day #infographic


Appropriate and timely for the holiday today in the U.S., imortuary.com brings us I Remembered A Vet Today infographic about the history and ways to commemorate Memorial Day.

Memorial Day is commemorated in many ways to show respect for those who have died for serving our country.  Whether visiting a national cemetary or gathering with friends and family, take time to participate in the National Moment of Remembrance at 3 p.m. local time to observe a moment of silence.

Designed by the team at KillerInfographics.com.  Thanks to Charlie for sending in the link!

Thanks to all of our troops!

Thursday
Apr212011

Easter by the Numbers #infographic


A fun infographic from DegreeSearch.org, Easter by the Numbers takes an amusing look at chocolate Easter bunnies and other candy during the Easter holidy.

Here in the United States, we eat soooo much candy at Easter. Delicious chocolate eggs, chocolate bunnies, Peeps, jelly beans and more. It doesn’t take a healthcare degree to figure out what all that candy means for our bodies. If you want to keep the pounds off, stay away from the basket. But if you don’t care about the pounds, try the Cadbury Mini Eggs. Mmmm, delicious.

Can you find all 18 chocolate Easter bunnies in the infographic?

Thanks to Matt for sending in the link!

Friday
Dec172010

FREE Infographic Holiday Cards!!!


Once again this year, FUNNEL, Inc. is offering FREE 4-pack mixed sets of Infographic Holiday Cards, but quantities are limited (US & Canada only).  You won’t find them on the main site, because they’re only available on this secret page of their site for Cool Infographics readers.  When you enter your address, make sure you choose “Cool Infographics Blog” in the How did you hear about us? question.  There are 50 packs of cards reserved just for Cool Infographics readers!

This year brings a new infographic called “Delivery” to the mix:


Also on the page are seven infographic holiday desktop backgrounds available for free download.  They have multiple screen resolutions, and the new one even has iPhone versions.


Thanks to Lin and Lori at FUNNEL for this special treat just for Cool Infographics readers!

Tuesday
Dec142010

Christmas in the World 2010


20 fun Christmas fact rolled into the Christmas in the World infographic, from the Venere Travel Blog.

I didn’t remember that the Statue of Liberty was a Christmas gift…

Tuesday
Nov302010

What Is The Deal With Hanukkah Anyway? [infographic]

What Is The Deal With Hanukkah Anyway? is a new infographic by Mike Wirth.  Just in time for the holidays, this one does a good job of explaining the basics and some of the numbers behind it.

I love that Mike gave credit to “My Nana” in the sources!  Great job Mike.

Friday
Dec252009

Christmas by the Numbers!


BillShrink.com presents this holiday infographic, Christmas by the Numbers, visualizing the decline in holiday spending in the U.S. and some other fascinating holiday figures.  Click the link to see the high-resolution version.
‘Tis the season for Christmas trees, lights and gifts, and in the past that has also meant the season of outrageous spending. While the holidays may not be cheap, hard times sometimes call for desperate measures and drastic budget changes. Here’s a look at the hard facts and numbers of this most wonderful time of the year.
Merry Christmas from Cool Infographics!

Thursday
Dec242009

The Holiday Economy


Our Present Economy is a look at holiday spending from 1997-2007 with some specifics about 2007.  It doesn't say explicitly, but I believe this is for the U.S. only.  From GOOD Magazine, this Good Sheet was available at Starbucks during the holiday season in 2008.

I wonder how 2009 compares?

Tuesday
Dec222009

Holiday Cliché Find-It Graphic from Xplane.com


Check out this fun Holiday Cliché Find-It graphic from Xplane.com!  It's available as a 11x17" sized PDF so you can view or print it out.

“Get your ducks in a row” so that you aren't “caught with your pants down” this holiday season! After all, it can be like “herding cats” out there this time of year, and you definitely don't want to get stuck “in the weeds.” So, go ahead and take a minute to “shop this around,” “see if it sticks” and celebrate from a “10,000-foot view.” It's all “blue sky” from here on out, nothing but a “win-win situation!”

Think you know your business clichés? Find where they're hiding in this holiday XPLANATiON™ created by your friends at XPLANE! Just click the image above to download the tabloid-sized 11x17" PDF.
Thanks to Parker at Xplane.com