About
Randy Krum
President of InfoNewt.
Data Visualization and Infographic Design

Infographic Design

Infographics Design | Presentations
Consulting | Data Visualizations

DFW DataViz Meetup

Join the DFW Data Visualization and Infographics Meetup Group if you're in the Dallas/Fort Worth area!

Search the Cool Infographics site

Custom Search

Subscriptions:


Feedburner

The Cool Infographics® Gallery:

How to add the
Cool Infographics button to your:

Cool Infographics iOS icon

- iPhone
- iPad
- iPod Touch


Read on Flipboard for iPad and iPhone

Featured in the Tech & Science category

Flipboard icon

Twitter Feed
From the Bookstore

Caffeine Poster

The Caffeine Poster infographic

Entries in interface (67)

Tuesday
Mar032009

TimeSpace - World


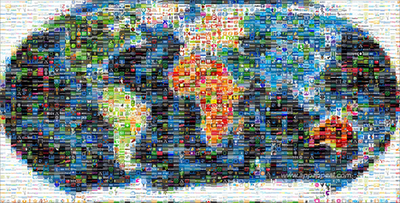
From The Washington Post, TimeSpace-World is an experiment in a visual way to see news stories from around the world.  You can specify the time period during a day that you want to see with the slider, and then click the stories to zoom into the map.  You can also enter search terms to view a smaller set of relevant stories.

TimeSpace is an interactive map that allows you to navigate articles, photos, video and commentary from around the globe. Discover news hot-spots where coverage is clustered. Use the timeline to illustrate peaks in coverage, and customize your news searches to a particular day or specific hour. (Many Washington Post stories appear at midnight; others are published throughout the day as news happens). Click the ? In the upper right for help.

 Link found from Mitul69 on Twitter

Friday
Feb202009

Google Data Visualization Concepts


Check out GridPlane.com.  JD Hooge has posted images of some data visualization concepts he worked on with Google to look at aggregating social media topics.


I collaborated with Instrument to develop a series of data visualization concepts for Google. These interface sketches are are all based around a concept of aggregating and visualizing online media buzz across various social media outlets.


Thanks Edial for sending in the link!

Wednesday
Feb182009

Mapped Up - Visual News ScreenSaver


From lifehacker.com, MappedUp is a visual RSS Reader/ScreenSaver that displays the location of news stories on a pixel map of the world.  MappedUp is a free download for Windows and Mac OS X.

Monday
Jan192009

This Is Now!


Take a few minutes to enjoy the Sprint website http://now.sprint.com/widget/, a collection of widgets showing seemingly real-time information.

Found on See What You Mean

Friday
Dec262008

Anamorphic Parking Garage Signage


These are images from the Eureka Tower in Melbourne, Australia.  Emery Studio (look at the "Placemaking" link) had the opportunity to use both the horizontal and vertical surfaces to design some anamorphic signage in the parking deck.  When viewed from the correct direction as you're driving, the words appear legible and lead you in the correct direction.  Viewed from another angle, the words appear as abstract lines and colors.


Thanks Ethyl for sending the link on Twitter!  Images are from the Kosmograd blog.

Monday
Dec152008

Ben Fry's Zipcode Project


Ben Fry is the author of Visualizing Data, and describes the ZipCode project in his book.  Each dot on the map is one zip code, and as you type a zip code, it highlights all of the dots that share that portion of the zip code.  You can turn on the "zoom" feature that zooms farther into the map for each digit you add.

This is built with the open source Processing tool that was recently released to the world as version 1.0.

Here are all of the zip codes that start with "6"


Thanks Steve for sending the link!

Here's a link to Ben's book on Amazon:

Wednesday
Aug202008

Olympics Schedule Tracker


The Olympics Tracker is an interactive schedule of the events.  It now only shows which events are scheduled each day and hour, but you can drag them to rearrange your favorites to the top.  Clicking on past events shows the results, and clicking on future events shows the upcoming event details.  Medal awarding events marked with a small medal icon.  You can even download a desktop version for Mac or Windows.

Tuesday
Jul152008

Map of the World 2.0


This world mosaic is created from 1,001 Web 2.0 icons/logos and each one is a clickable link to its respective site.  It was created using AndreaMosaic photo software, by the team at AppAppeal.

Thanks Jelle for sending in the link!

Wednesday
Jul022008

Map of Local Gas Prices

GasBuddy.com has a cool interactive temperature map of gas prices across the U.S. and Canada that allows you to zoom in to the street level to see prices at specific gas stations.  Prices are all removed from the database when they become over 72 hours old to keep the map current.


Thanks for sending in the link Karen!

Wednesday
Jun182008

Car HUD from the future


From the January 2008 (16.01)Wired Magazine; Artifacts from the Future, by Chris Baker. This future automobile HUD has some really cool features like a DUI driver identified ahead, in-car video chat, live GPS map with directions and a coupon for the Starbucks at the next exit. He's doing 90MPH, eating an energy bar and he's in the slow lane! For California, there definitely aren't enough cars on the road!

Looks a lot like a bunch of widgets on the desktop of your PC. It definitely seems too cluttered, but I think it was necessary to fit it on a narrow magazine page. I love that it seems to use a multiple-blink interface. Check out the calendar appointment in the top left: "...blink 3 times to reschedule."

If only this future were closer. I'm a real fan of car HUD interfaces. It's one of those promised technologies that still haven't become reality.