About
Randy Krum
President of InfoNewt.
Data Visualization and Infographic Design

Infographic Design

Infographics Design | Presentations
Consulting | Data Visualizations

DFW DataViz Meetup

Join the DFW Data Visualization and Infographics Meetup Group if you're in the Dallas/Fort Worth area!

Search the Cool Infographics site

Custom Search

Subscriptions:


Feedburner

The Cool Infographics® Gallery:

How to add the
Cool Infographics button to your:

Cool Infographics iOS icon

- iPhone
- iPad
- iPod Touch


Read on Flipboard for iPad and iPhone

Featured in the Tech & Science category

Flipboard icon

Twitter Feed
From the Bookstore

Caffeine Poster

The Caffeine Poster infographic

Entries in internet (195)

Friday
Mar222013

460 Million Connected Internet Devices

Beautiful data visualizations of some very scary data!  

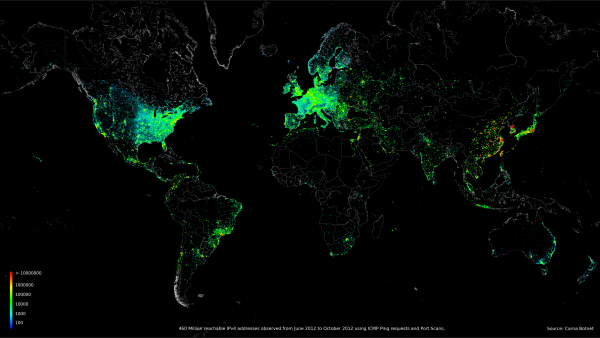
An anonymous hacker under the pseudonym of “Carna Botnet” has posted a comprehensive Internet Census 2012 report of over 460 million internet connected devices that responded to PING requests or were found to have open ports.  He was able to create a botnet using over 30,000 Internet devices that had remote administration available using the Telenet and still had the factory installed standard passwords.  He found several hundred thousand open devices, but didn’t need that many.

Abstract: While playing around with the Nmap Scripting Engine (NSE) we discovered an amazing number of open embedded devices on the Internet. Many of them are based on Linux and allow login to standard BusyBox with empty or default credentials. We used these devices to build a distributed port scanner to scan all IPv4 addresses. These scans include service probes for the most common ports, ICMP ping, reverse DNS and SYN scans. We analyzed some of the data to get an estimation of the IP address usage. 

All data gathered during our research is released into the public domain for further study. 

The visualizations he was able to create using the gathered data are fantastic.  Check out the IMAGES page of the report for beautiful, high-resolution images.

The map visualization above shows the geolocation data of all 460 million devices that responded to the queries from the botnet, clustered around population centers as you might expect.  The animated GIF below shows the geolocated devices that responded during the course of a day, showing that many devices are turned off overnight but many more are just left on constantly.
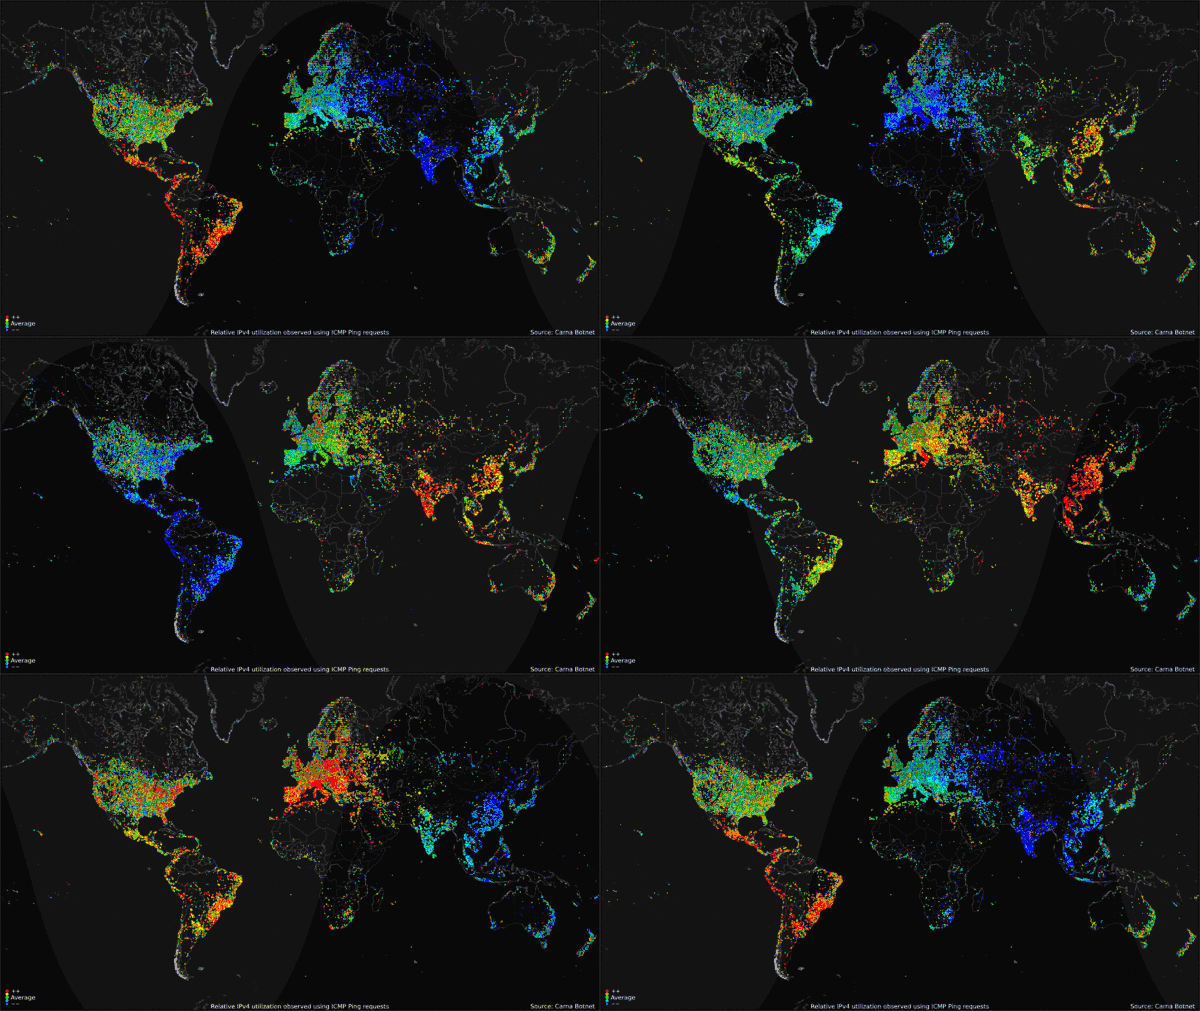
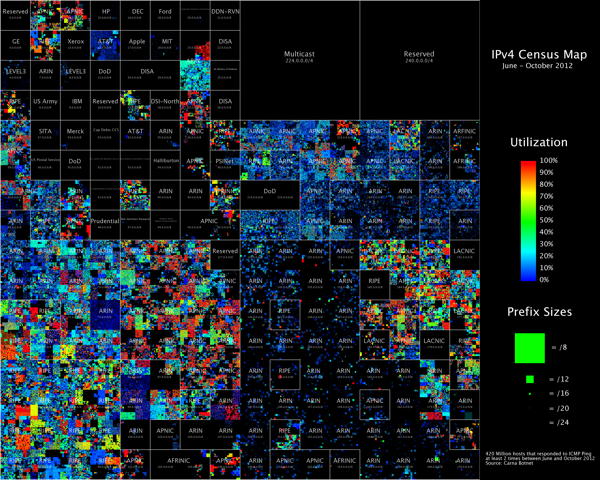
My favorite visualization from the data is the Hilbert Map, which uses the a 2-dimensional Hilbert Curve to map out the continuous sequence of IP4 addresses into a square area, and then color-codes the address blocks that responded to a PING request.  There’s even a cool zoomable viewer of the Hilbert Map that lets you drill into the details.


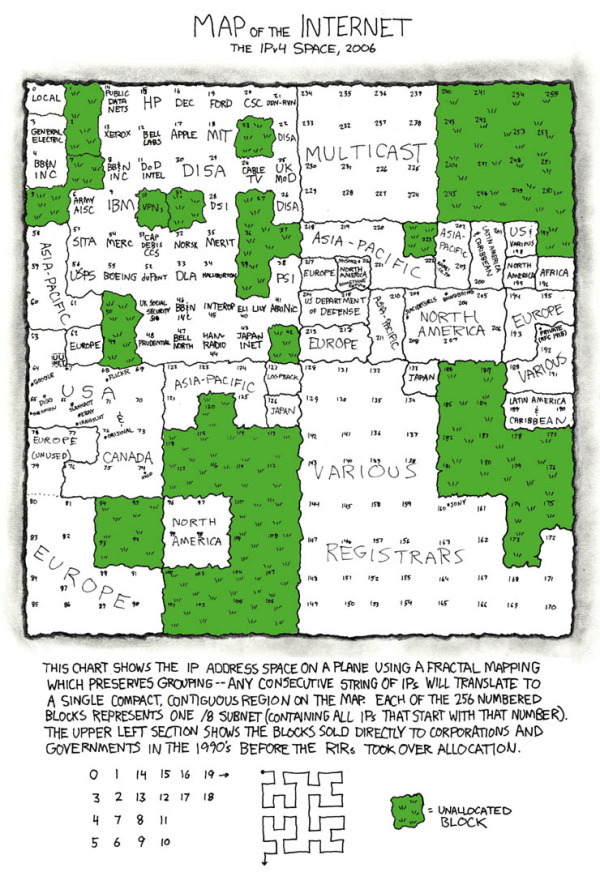
This form of mapping was inspired by the xkcd Map of the Internet, which shows the Internet addresses that were distributed to major corporations in the 1990s before the Regional Internet Registries took over the allocation.


Found on the Security Now podcast #396 and FlowingData

Friday
Feb222013

Cloud Computing: Fact or Fiction?

Cloud Computing: Fact or Fiction? infographic

Cloud Computing: Fact or Fiction? is a new infographic from Devry University helping to explain the basics about cloud computing, and the clear up the common misunderstandings people have about the Cloud.

Cloud computing allows you to store, access and share data from Internet-connected devices in one central location.  As technology careers continue to grow across the U.S. and cloud computing creates nearly 14 million jobs by 2015, the Cloud is more important than ever.  Here are the fact you need to know about the Cloud - and the fiction than many believe.

This is a really clean and easy-to-read design, with a great color scheme.  The statistics to support each section are good, and clearly sourced in the long list of data sources in the footer.

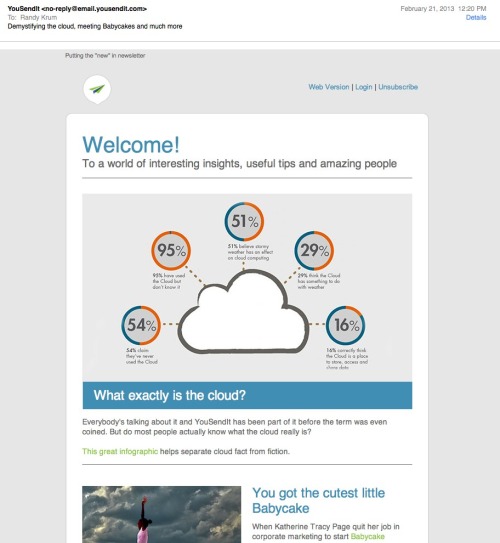
The data visualizations are a mixed bag.  The doughnuts are easy to read and the percentage bars are clearly visualized as portions of 100%.  The 24% doughnut in the top visualization is wrong.  That will catch many people’s eye, and cast doubt on the rest of the visualizations.  Once you get one data visualization wrong, you lose credibility and people will more closely scrutinize the rest.

Why are other numbers not visualized?  The “cyber attacks” and “people using the cloud” statistics would have been easy to visualize, but now seem unimportant to the reader because they are just shown in text.


The most interesting thing is that I got this promotional, marketing email (image above) from YouSendIt.com highlighting this infographic and showing the top portion with the incorrect visualization.  As far as I know, Devry and YouSendIt are not related in any way, so this is just using someone else’s work for their own purposes.  

Of course, infographics are meant to be shared, but you shouldn’t claim credit for someone else’s work, especially in an email promoting your own commercial services.  By omitting any design credit to Devry in the email, the message implies that the infographic is coming from YouSendIt, so it looks like the YouSendIt designers messed up the data visualization.  The negative impression created by the false visualization will now also create a negative impression of the folks at YouSendIt.  Oops.

Friday
Feb222013

Top 250 Internet Retailers Q3 2012 Update

Top 250 Internet Retailers Q3 2012 Update infographic

Top 250 Internet Retailers Q3 2012 Update infographic from the Campalyst blog

Back in May we published an infographic about Top 250 Internet Retailers’ presence on social media. The infographic was perceived really well by our readers, customers and the media; thanks a lot to all the people sharing it on Facebook, Twitter, Pinterest and their blogs!

Now we are happy to present you with the Q3 update! Spoiler: those were two incredible quarters for Pinterest! Amazing growth in terms of the number of brands building their presence on Pinterest and the size of their communities!

I like the color scheme and the variety of data visualizations used in this infographic.  Bars, icons, arcs and proportional circles.  The use of the Internet retailer logos in the circles is especially effective.

I wish the Social Media site logos had been used, especially in the first three sections.  I shouldn’t have to read the text and match the color to figure out what the visualization represents.  That’s too much work for the reader.  How many people does each of the people icons represent in the “How Many Followers Do They Have?” section?  The lines look “relatively right”, but the number of icons seems to have no relationship to the actual numbers shown.

The footer needs both a copyright statement (or Creative Commons license) and the infographic landing page URL so readers can find the original when they see this posted on other sites (like this one!).  Many bloggers are not good about linking back to your original site correctly, and you want your audience to be able to find it easily.

Found on Fresh Peel and Visual Loop


Wednesday
Feb132013

The Geosocial Universe 3.0

The Geosocial Universe 3.0 infographic

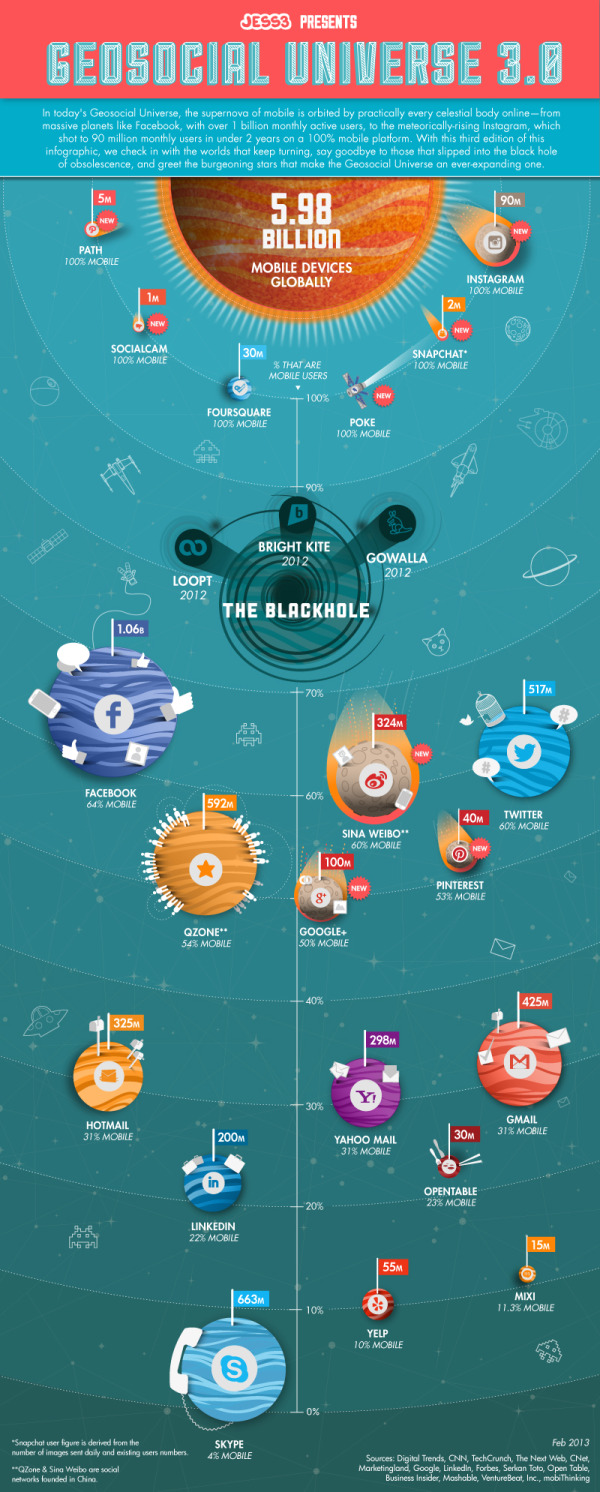
Last week design firm JESS3 released The Geosocial Universe 3.0, an update to their prior infographics about the size of the major social media networks.

In a time not so long ago, in a galaxy not so far away, a little phenomenon was born that united the people of cyberspace through geographic services and social networking.

With changes to the social landscape occurring at lightspeed, JESS3 presents its third iteration of The Geosocial Universe, charting the latest monthly active user data for various social networks, along with the percentage of users who access each network via mobile devices.

Take a look below to discover more about the ever-expanding geosocial universe and the course of its objects.

I really like the changes to this version of the design.  They kept the same philosophy of relatively sized circles to represent each of the main social networks.  However, I’m confused by the placement of the Black Hole on the vertical scale meant to represent the percentage of mobile users.  Why does more mobile users place a network closer to the Black Hole of Obscurity?  It’s placement around the 80% mark visually implies that has meaning, but I don’t think that was the intention of the design.  Is Facebook close to obscurity?

Both a copyright (or Creative Commons) license and the URL to the infographic landing page are missing from the design.  You want readers to be able to find their way back to the original when they find the infographic posted on other sites.

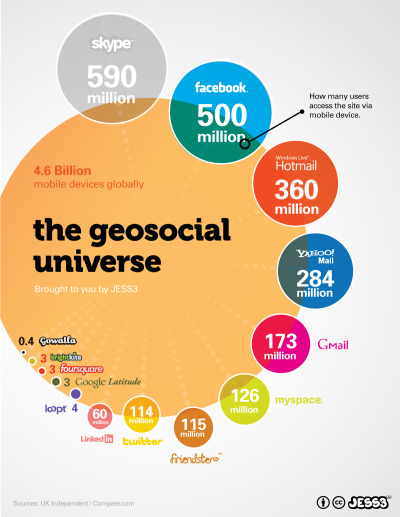
This is an update to the original design from 2010:

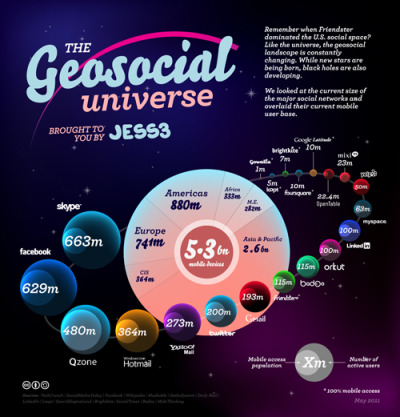
And version 2.0 in 2012:

Monday
Feb112013

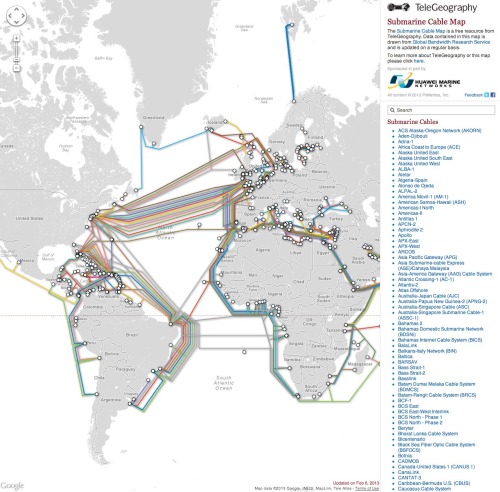
The Submarine Cable Map 2013

The Submarine Cable Map 2013 infographic poster

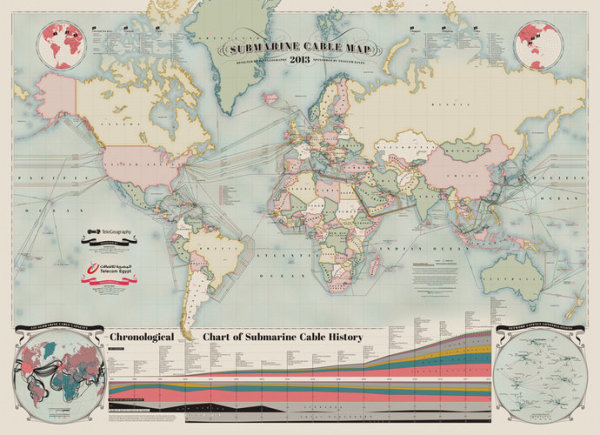
A beautiful map of the World’s undersea Internet cables, The Submarine Cable Map 2013.  Brought to us be TeleGeography, sponsored by Telecom Egypt and design credit is listed as Nick Browning, Markus Krisetya, Larry Lairson, Alan Mauldin.

Cables depicted include all active international and U.S. domestic cables.  In-service cables have an announced Ready for Service (RFS) date by December 31, 2012.  Planned cables include those actively under construction and those that have announced they were fully funded as of year-end 2012.  Map does not depict proposed cables that have not announced landings or configuration.  Cable routes are stylized and do not reflect physical cable location.

I love the hand-drawn design style, meant to pay homage to old maps, but overlaid with very current information.  This is also available for purchase as a poster 36” x 50” for $250.

An interactive website with more information about all of the cables is also run by TeleGeography and can be found at submarinecablemap.com

Found on FastCoDesign.


Tuesday
Jan292013

How Social Sites Make Money

How Social Sites Make Money infographic

The number of social media followers are growing. But how do the sites make a profit? How Social Sites Make Money infographic from usbundles.com tells you which social media websites make money with ads, or paying customers, or mobile apps, or affiliates.

We turn to social media services to stay connected more and more each day. But even with hordes of devoted followers, how do these social sites manage to turn a profit?

Here’s a quick look at which revenue streams help major social networking companies go from social service to successful business.

Nice use of a Venn Diagram.

The doughnut charts aren’t accurate.  Like the designer eye-balled them instead of doing the calculation.  For example, the 71% doughnut is actually visualizing a value of 66.6% (2/3).

Found on http://socialtimes.com/how-social-sites-make-money_b91551

Tuesday
Nov132012

Which Social Networks Take Home the Gold?

Which Social Networks Take Home the Gold? infographic

How popular is your favorite social network?  It is important to know if it is on the rise or decline because well, what is the use of a SOCIAL network with no one on it?  See which are on the rise and some interesting facts about who is on which social network with mashable.com’s Which Social Networks Take Home the Gold?

We love the Olympics, but an international social media showdown is a little more our speed.

Ignite Social Media is back with the 2012 Social Network Analysis Report, breaking down demographic, geographic and search data that shows which networks are the underdogs and which are mounting the winners’ podium.

Here at Mashable, we can’t get enough GIFs and hashtags. We’re excited to see that this type of digital currency is gaining value — Twitter and Tumblr are among the top five networks with the strongest rate of growth.PinterestReddit and LinkedIn round out the pack.

Launched just over a year ago, Google+ was included in the report for the first time this year but is notably absent from the list of fastest growing platforms. And while Facebook is actively continuing its quest for world domination, it’s hard to improve your growth rate when practically everyone’s already joined the club.

Check out the graphic below, with data based on a report from Ignite Social Media. It also features statistics about men versus women, the youngest skewing networks and which sites are luring in the whiz kids. The researchers at Ignite point out that social network search interest continues to remain stagnant, as it has since 2009.

The timeline trend charts are especially effective showing the rise (and fall) of many of the most popular and well-known networks.  Even though these are “simple bar charts”, they are incredibly effective in making the data easy to understand to the readers.  Although its explained in the footer, it would have been better to explain the  y-axis unit of measure along with the charts.

Found on mashable.com

Thursday
Nov012012

Finding the Productivity Sweet Spot at Work

Finding the Productivity Sweet Spot infographic


The Finding the Productivity Sweet Spot infographic from NICE.com takes a close look at how employees waste their time online at work, but offers a better solution to manage employee productivity.  Don’t cut off Internet to your employees!  Instead, manage their personal time online to a reasonable level and everyone wins!

Everyone wastes a bit of time at work, and some of the key sources may surprise you. It’s not just the internet that can cost employers time at work. Read our infographic on time wasting at work to understand if fantasy football or facebook causes us to procrastinate more.

There is an ideal balance of non-work activity that keeps people refeshed and employees engaged. It’s just unrealistic to expect 100% efficiency through the day. Distractions at work existed before the Internet. The key for companies is to manage these time wasters at work to an ideal level. 

Designed by InfoNewt, the infographic walks the reader through a 3-part story…


  1. How much time is being wasted at work?
  2. What are employees doing during this wasted time?
  3. What’s the ideal amount of time to let employees have personal time online?


 Big thanks to the team at NICE!

Wednesday
Sep262012

How Much Does SEO Cost?

How Much Does SEO Cost? infographic

How Much Does SEO Cost? is generally a mystery in the online marketing world.  The range is certainly big, from under $50/month up to the unbelievable price of over $250,000/month!  This informative infographic shares the results of custom research from SEOmoz, and was designed by AYTM.

How much does SEO cost? How much time do you have to discuss the various models and prices out there! However, a new survey sheds some light on the subject.

Over 500 people and companies who offer search engine optimization services were asked about how their models. Turns out, it’s most common to charge $100 to $150 per hour, in the US. But by-the-hour consulting is only one of four nearly co-equal ways of charging.

Also popular is project-based pricing, where the average price is between $2,500 to $5,000, in the US. That’s also the same average price for those who buy on a monthly retainer basis. Fixed prices on a contract basis is also a popular way that SEO is sold, but no averages were provided.

The survey was conducted by SEOmoz and compiled into the infographic below by AYTM:

From a design standpoint, there are a lot of things I like about this infographic.  

The consistent columns for regions of the world make the layout very easy to follow.  The data is also organized nicely by starting with basic demographic data to provide a foundation to the reader before getting into “The Main Event” - the main research results.

The data visualizations are fairly simple, and very easy for the reader to understand.  I also like the variety of data visualization methods; no one wants to see all bar charts.  The color scheme is also simple, which visually implies a certain level of authority.  By taking complex data and designing simple visualizations, the design shows the readers that SEOmoz has a clear understanding of the content.

The actual values are not included in the design, which is disappointing.  Since this was custom primary research, I have no way to validate the data visualizations without seeing the data, and that reduces the credibility of the entire design.  From a sharing perspective, it’s hard to quote interesting statistics in a text Tweet or Facebook post without having the numbers to work with.

Legends are Evil!  My biggest complaint is their use of legends in a few sections.  In those charts, the colors are visually hard to differentiate, and the reader has to work very hard to understand which pie slice or bar goes with each color.  This is only a problem in the Agency Type and Common Client Types sections.  The rest do a good job of connecting the data labels directly to the visualization.

The footer should include some type of copyright statement, and the URL for readers to find the original infographic landing page.

Found on Visual Loop

Tuesday
Jul172012

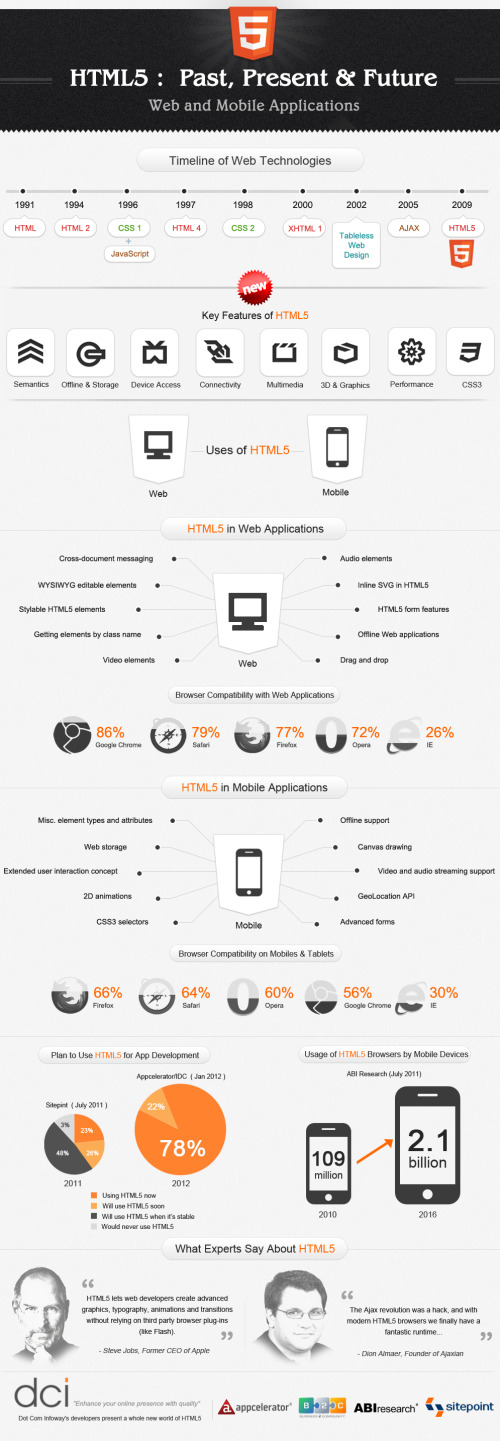
HTML5: Past, Present, Future

HTML5: Past, Present, Future infographic

The future is now! HTML5: Past, Present, Future infographic from Dot Com Infoway takes a trip trough time to explain how evolutionary HTML5 is.

HTML5 is the next evolutionary step for the Web world. With HTML5, the possibilities for Web usage are endless. At DCI, we are proud to be ahead of the game in offering HTML5 development for our many clients.

The published HTML5 infographic elucidates the history of HTML through an appealing timeline from its inception in 1990 to HTML5 in 2009. It also lists out the key features, uses and the role of HTML5 in Web applications in a captivating manner. The infographic also illustrates the compatibility of Web applications with various web browsers. It is interesting to note that Chrome and Safari maintain a higher compatibility rating than that of Opera and Internet Explorer.

Mobile applications are what we excel at. We understand how to create the most advanced apps through our development and work with our clients. Research indicates that by 2016, HTML5 usage with mobile browsers will surge to 2.1 billion. And by this year alone, the use of HTML5 in mobile application development has increased to 78%.

It is evident from the research data that HTML5′s trajectory will continue to grow to unbelievable heights in the near future.

This is a beautiful, clear infographic design.  The color palette is kept simple, and the use of icons is fantastic.

From a data visualization perspective, there are a couple of things that would make the design even better:

  • It might be just my own taste, but I think the timeline should be laid out to match the correct spacing of the years.  Visually it looks like some something happened every year on the timeline, when in reality each step jumps a different number of years.
  • Most of the data sources are cited in among the the visualizations, but no source is cited for the Browser Compatibility numbers.  Where do these values come from?  Are they believable?
  • Also in the Browser Compatibility, the shaded portion visualizations are wrong, and don’t match the values they are supposed to represent.  First, because the icons are circles, you have to shaded the AREA of each shape to be true to the data.  If you shade the height of a circle based on the data, the visual doesn’t match the values.  Second, even shading them by height was done incorrectly.  For example, Opera compatibility on Mobile is listed as 60%, but the visualization shows some number under 50%.

Found on Infographics Archive