About
Randy Krum
President of InfoNewt.
Data Visualization and Infographic Design

Infographic Design

Infographics Design | Presentations
Consulting | Data Visualizations

DFW DataViz Meetup

Join the DFW Data Visualization and Infographics Meetup Group if you're in the Dallas/Fort Worth area!

Search the Cool Infographics site

Custom Search

Subscriptions:


Feedburner

The Cool Infographics® Gallery:

How to add the
Cool Infographics button to your:

Cool Infographics iOS icon

- iPhone
- iPad
- iPod Touch


Read on Flipboard for iPad and iPhone

Featured in the Tech & Science category

Flipboard icon

Twitter Feed
From the Bookstore

Caffeine Poster

The Caffeine Poster infographic

Entries in programming (8)

Monday
Apr032017

The Data Visualization Toolkit signed book giveaway

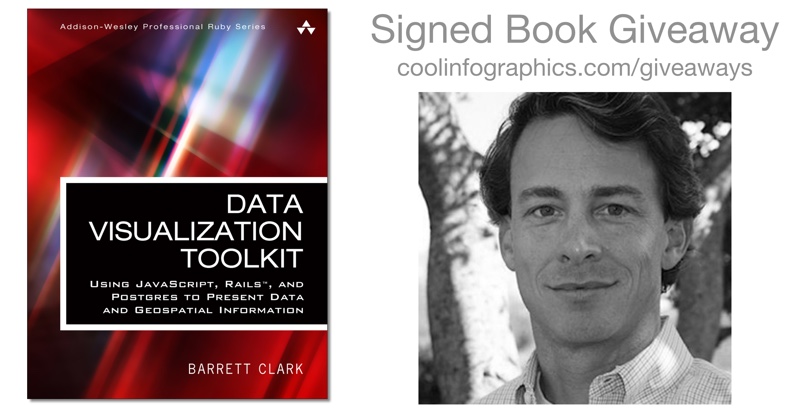
For the April Giveaway, I have a signed copy of the Data Visualization Toolkit by Barrett Clark.  Register on the Giveaways Page by April 30th to be entered. 

From Amazon:
Data Visualization Toolkit is your hands-on, practical, and holistic guide to the art of visualizing data. You’ll learn how to use Rails, jQuery, D3, Leaflet, PostgreSQL, and PostGIS together, creating beautiful visualizations and maps that give your data a voice and to make it “dance.”
 
Barrett Clark teaches through real-world problems and examples developed specifically to illuminate every technique you need to generate stunningly effective visualizations. You’ll move from the absolute basics toward deep dives, mastering diverse visualizations and discovering when to use each. Along the way, you’ll build three start-to-finish visualization applications, using actual real estate, weather, and travel datasets.
 
Clark addresses every component of data visualization: your data, database, application server, visualization libraries, and more. He explains data transformations; presents expert techniques in JavaScript, Ruby, and SQL; and illuminates key concepts associated with both descriptive statistics and geospatial data. Throughout, everything is aimed at one goal: to help you cut through the clutter and let your data tell all it can.

Barrett recently gave a talk called "Making Data Dance" at the DFW DataViz Meetup event, and I had a chance to ask him a few quesitons:

What does it mean to make your data "Dance”?

Barrett Clark: I think data wants to tell a story. Our job is to figure out what that story is and how to best present it. Seeing the data in a visual way can make it come to life and dance.


Who is the book written for?

Barrett Clark: Data Visualization Toolkit focuses on looking at data from the perspective of a web developer. More specifically, I speak from the perspective of a developer writing Ruby on Rails apps. There is a fair amount of JavaScript and SQL throughout the book, and I try to explain what I am doing throughout the text. My goal was to make a book that is accessible to anyone while still giving more experienced developers something valuable.


Can readers get all of the data and code you reference in the book?

Barrett Clark: Absolutely! There are 3 different applications that readers will build throughout the book. The code and data for the applications are available on GitHub at http://DataVisualizationToolkit.com. I also have checkpoints throughout the text where you can see what the application should look like at that point. Those are enumerated in the README for each application.


Why do you prefer PostgreSQL as your database platform of choice?

Barrett Clark: I have worked with several databases. PostgreSQL, or Postgres as it is often called, is by far my favorite. It is a robust database that is easy to use, has a wide array of functions and data types, and is also extendable. You can easily add to the functionality of a Postgres database with an extension. In fact, the core database ships with dozens of extensions that you don't need to install. PostGIS, which allows you to store geospatial data and perform geospatial queries, is one of my favorite extensions.


Why is the database and transforming your data before your create the visualizations so important?

Barrett Clark: I have seen very few data sets where you can take data directly from the database into a chart -- especially with transactional data. You can perform the data transformations in the database using SQL, in the application server using the application's prorgamming language, or in the browser using JavaScript. Databases are really good at dealing with data, so I encourage people to not be afraid to write SQL to pull out the data in the format that you need it.


What are the challenges for visualizing data on websites?

Barrett Clark: Speed. When you have a lot of data you need to be thoughtful about how quickly you can get the data and display it in a meaningful way. This may require some additional setup to store data for reporting in a separate format so that you don't have to do the transformations in real time. Another challenge is that you have no control over the end user's viewing experience. Something that you think looks brilliant on your laptop may look awful on someone else's screen.


What’s different about visualizing geospatial data?

Barrett Clark: Geospatial data is a lot of fun! When you add location to the mix you open up a whole new arena of things that you can do visually with your data, and questions that you can ask of the data. I love maps. I take readers through the creation of one of my favorite types of map -- the choropleth. That's where you color areas (counties, states, etc) in a map based on the data.


Are your visualizations mostly static or interactive data visualizations?

Barrett Clark: There are some mouseover effects in my visualizations that help add more context to the graph or highlight something.


What are your thoughts on D3.js and its future?

Barrett Clark: I love D3, and I also love what Mike Bostock has done to build such a deep assortment of examples. Between the examples and the documentation I find D3 really fun to work with. The library is also very actively maintained. As soon as I shipped Data Visualization Toolkit a new version of D3 dropped. There are branches in all 3 sample project repositories on GitHub with the updates required for D3v4.


Are you speaking at any upcoming presentations or webinars?

Barrett Clark: In the past few months I've spoken at PGConf Silicon Valley in San Francisco and RubyConf Australia in Melbourne. I'll be taking a break from travel for a bit and focusing on local meetups. I try to get out to the Dallas Ruby meetups whenever possible.


What’s the best place to follow you online?

Barrett Clark: I'm @barrettclark on Twitter.

Monday
Feb202017

Millions of Lines of Code

Codebases: Millions of Lines of Code infographic

Codebases: Millions of Lines of Code is another great infographic from David McCandless and Information Is Beautiful showing the massive complexity of today's modern apps and programs.

Is a million lines of code a lot? How many lines are there in Windows? Facebook? iPhone apps?

Great use of the matrix of squares to represent scale. I do think the users can lose their perception of scale when the section changes jump different values. If it was always a factor of 10, that would be clearer.

Monday
Mar282016

BallR: Interactive NBA Shot Charts

BallR: Interactive NBA Shot Charts

BallR: Interactive NBA Shot Charts is a tool built by Todd W. Schneider that takes the NBA's Stats API data and creates a visual representation of an NBA player's season. You can pick any NBA player and season to create the shot chart. The above infographic is an example of a hexagonal chart of Stephen Curry's Field Goal Percentage (FG%) relative to the league average within each region of the court during the 2015–16 season.

The NBA’s Stats API provides data for every single shot attempted during an NBA game since 1996, including location coordinates on the court. I built a tool called BallR, using R’s Shiny framework, to explore NBA shot data at the player-level.

BallR lets you select a player and season, then creates a customizable chart that shows shot patterns across the court. Additionally, it calculates aggregate statistics like field goal percentage and points per shot attempt, and compares the selected player to league averages at different areas of the court.

Hexagonal charts, popularized by Kirk Goldsberry at Grantland, group shots into hexagonal regions, then calculate aggregate statistics within each hexagon. Hexagon sizes and opacities are proportional to the number of shots taken within each hexagon, while the color scale represents a metric of your choice, which can be one of:

  • FG%
  • FG% vs. league average
  • Points per shot

Scatter charts are the most straightforward option: they plot each shot as a single point, color-coding for whether the shot was made or missed. Here’s an example again for Stephen Curry


Heat maps use two-dimensional kernel density estimation to show the distribution of a player’s shot attempts across the court.

Anecdotally I’ve found that heat maps often show that most shot attempts are taken in the restricted area near the basket, even for players you might think of as outside shooters. BallR lets you apply filter to focus on specific areas of the court, and it’s sometimes more interesting to filter out restricted area shots when generating heat maps. For example here’s the heat map of Stephen Curry’s shot attempts excluding shots from within the restricted area (see here for Curry’s unfiltered heat map).

Built using R's Shiny framework, I really like this interactive dataviz. The code designed to create this was also published on GitHub so anyone can check it out and try your own modifications. Very cool!

Found on Flowing Data.

Monday
Jul132015

A Brief History of Open Source Code

A Brief History of Open Source Code infographic

Learn about the last 20 years of collaborative software development, language relationships, and the current state of the art with A Brief History of Open Source Code infographic. Kinvey, a company that helps its clients create mobile apps, published the infographic designed by Beutler Ink back in 2013. For more in-depth reading, check out this article at Read Write.

We were able to visualize the percentage of total commits in a given quarter for the top 16 programming languages from 1993 until today. We hope you’ll find this image—a provocative pattern of dips and spikes—to be as interesting as we do. It truly shows how dynamic the world of programming is. We’ve also included a few graphs on other interesting data points: total number of languages by year, average lines of code per commit, and tracking which languages influenced the development of others.

There is good use of colors and charts to tell the story of the 16 different source code languages. No numbers were needed to show the popularity of each language, only distances between the colors. The colors are similar, but not to the point where we would have trouble telling them apart. I like the gradual color gradient in the infographic. Too many different colors would make the graphic look too busy.  

Found on http://readwrite.com

Thursday
Jul092015

How to Pick Your First Programming Language

How to Pick Your First Programming Language infographic

Udacity presents, How to Pick Your First Programming Language infographic. Your decision depends a lot on where and the job you are aiming for. Check out the graphic for some tips.

If you haven’t picked your first programming language, the programming world is your oyster. Yet with evangelists for every language telling you their language is the best, choosing one to start with can be incredibly overwhelming. We’ve looked at the data for the top ten programming languages in the US (based on IEEE Spectrum data) to help you pick the best language to start with based on your priorities in lifestyle, location, and career potential.

Python is a popular, well-paid language, being versatile enough to be used in many different applications, while Javascript is used widely across the country, and can be a good choice if you don’t want to relocate for a job. Although some newer programming languages, such as Swift, are not included, you shouldn’t discount the growth of their popularity. Career opportunities in iOS development using Swift, similar to Android development using Java, will increase as the field of mobile app development continues to expand.

There are many factors involved in choosing your first programming language. This data can help you figure out what works for you.

Good rundown of the stats behind the programming language careers. I'm not sure that Google searches in the best gauge of language popularity. Maybe something like number of projects on GitHub might have worked better.

The footer should include the URL back to the original infographic landing page, not just the main front page for Udacity.

Thanks to Lindsay for sending in the link!

Thursday
Oct032013

Agile Development Methodology Talent Gap

Agile Development Methodology Talent Gap infographic

Who’s Hiring & Who is Hirable? The Agile Development Methodology Talent Gap infographic from Yoh points out why it is so hard to find agile developers and why the pros get paid the big bucks.

The rapid adoption of the agile development methodology has created a sizable talent gap. The INFOGRAPHIC from Yoh uncovers the impact: 

  • Demand outstrips supply by nearly 4x
  • Companies have to pay a premium for Agile expertise
  • The agile talent gap is most significant in thePacific Northwest
  • Labor pressure for agile talent goes from bad to worse
  • Competition for agile talent is fierce

Good design, and certainly eye opening for agile developers and employers.  The only visualization I struggled with was the Experience stacked bar, because the bar sizes don’t match the data shown.  Not even close.

Thanks to Stephen for sending in the link!

Tuesday
Jul172012

HTML5: Past, Present, Future

HTML5: Past, Present, Future infographic

The future is now! HTML5: Past, Present, Future infographic from Dot Com Infoway takes a trip trough time to explain how evolutionary HTML5 is.

HTML5 is the next evolutionary step for the Web world. With HTML5, the possibilities for Web usage are endless. At DCI, we are proud to be ahead of the game in offering HTML5 development for our many clients.

The published HTML5 infographic elucidates the history of HTML through an appealing timeline from its inception in 1990 to HTML5 in 2009. It also lists out the key features, uses and the role of HTML5 in Web applications in a captivating manner. The infographic also illustrates the compatibility of Web applications with various web browsers. It is interesting to note that Chrome and Safari maintain a higher compatibility rating than that of Opera and Internet Explorer.

Mobile applications are what we excel at. We understand how to create the most advanced apps through our development and work with our clients. Research indicates that by 2016, HTML5 usage with mobile browsers will surge to 2.1 billion. And by this year alone, the use of HTML5 in mobile application development has increased to 78%.

It is evident from the research data that HTML5′s trajectory will continue to grow to unbelievable heights in the near future.

This is a beautiful, clear infographic design.  The color palette is kept simple, and the use of icons is fantastic.

From a data visualization perspective, there are a couple of things that would make the design even better:

  • It might be just my own taste, but I think the timeline should be laid out to match the correct spacing of the years.  Visually it looks like some something happened every year on the timeline, when in reality each step jumps a different number of years.
  • Most of the data sources are cited in among the the visualizations, but no source is cited for the Browser Compatibility numbers.  Where do these values come from?  Are they believable?
  • Also in the Browser Compatibility, the shaded portion visualizations are wrong, and don’t match the values they are supposed to represent.  First, because the icons are circles, you have to shaded the AREA of each shape to be true to the data.  If you shade the height of a circle based on the data, the visual doesn’t match the values.  Second, even shading them by height was done incorrectly.  For example, Opera compatibility on Mobile is listed as 60%, but the visualization shows some number under 50%.

Found on Infographics Archive

Tuesday
Jun262012

Ruby on Rails Popularity Index 2012

Ruby on Rails Popularity Index 2012

Ruby on Rails isn’t about the gem, but to some people it is just as valuable. It allows people to enter the basic programming world as painless as possible. The Ruby on Rails Popularity Index 2012 infographic created by exist.com (found on infographicjournal.com) illustrating its popularity!

Ruby on Rails has taken the web development world by storm since its first full release in 2005. Yet with new web platforms arriving each day, usage share of frameworks has become quite fragmented. So in this post, I compiled the latest trends and figures of Ruby on Rails from different sources, as well as some stats of the Ruby language.

Here’s an infographic we’ve created that visualizes how far Ruby on Rails has gotten since its release in 2005.

This design from Exist.com comes from Philippines, so there are a couple English grammars errors like “oftenly”, which isn’t a real word.  The design does a good job gathering a number of stats from different sources together to show the general trend of growing usage of Ruby on Rails over the last 5 years or so.