


BallR: Interactive NBA Shot Charts
 Randy
Randy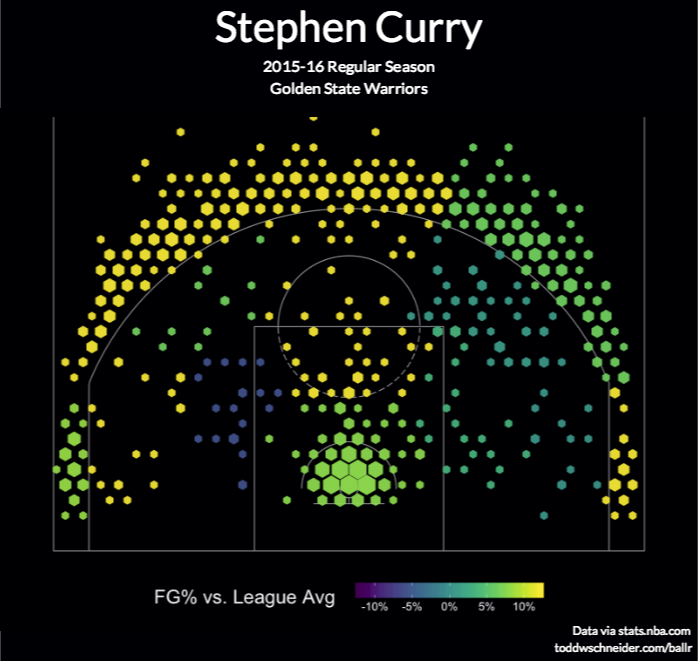
BallR: Interactive NBA Shot Charts is a tool built by Todd W. Schneider that takes the NBA's Stats API data and creates a visual representation of an NBA player's season. You can pick any NBA player and season to create the shot chart. The above infographic is an example of a hexagonal chart of Stephen Curry's Field Goal Percentage (FG%) relative to the league average within each region of the court during the 2015–16 season.
The NBA’s Stats API provides data for every single shot attempted during an NBA game since 1996, including location coordinates on the court. I built a tool called BallR, using R’s Shiny framework, to explore NBA shot data at the player-level.
BallR lets you select a player and season, then creates a customizable chart that shows shot patterns across the court. Additionally, it calculates aggregate statistics like field goal percentage and points per shot attempt, and compares the selected player to league averages at different areas of the court.
Hexagonal charts, popularized by Kirk Goldsberry at Grantland, group shots into hexagonal regions, then calculate aggregate statistics within each hexagon. Hexagon sizes and opacities are proportional to the number of shots taken within each hexagon, while the color scale represents a metric of your choice, which can be one of:
- FG%
- FG% vs. league average
- Points per shot

Scatter charts are the most straightforward option: they plot each shot as a single point, color-coding for whether the shot was made or missed. Here’s an example again for Stephen Curry
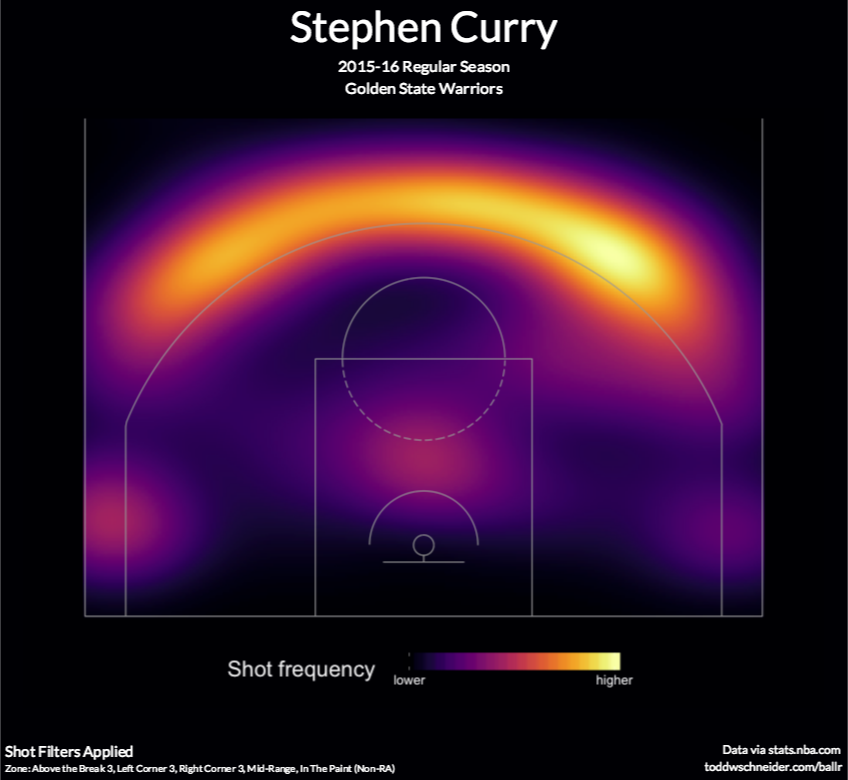
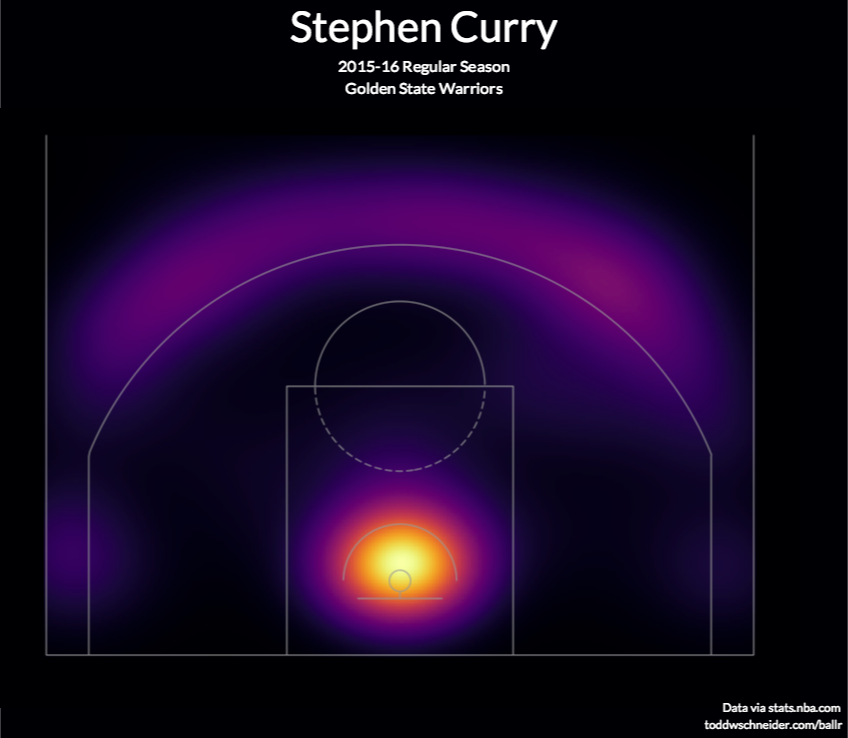
Heat maps use two-dimensional kernel density estimation to show the distribution of a player’s shot attempts across the court.
Anecdotally I’ve found that heat maps often show that most shot attempts are taken in the restricted area near the basket, even for players you might think of as outside shooters. BallR lets you apply filter to focus on specific areas of the court, and it’s sometimes more interesting to filter out restricted area shots when generating heat maps. For example here’s the heat map of Stephen Curry’s shot attempts excluding shots from within the restricted area (see here for Curry’s unfiltered heat map).
Built using R's Shiny framework, I really like this interactive dataviz. The code designed to create this was also published on GitHub so anyone can check it out and try your own modifications. Very cool!
Found on Flowing Data.
