About
Randy Krum
President of InfoNewt.
Data Visualization and Infographic Design

Infographic Design

Infographics Design | Presentations
Consulting | Data Visualizations

DFW DataViz Meetup

Join the DFW Data Visualization and Infographics Meetup Group if you're in the Dallas/Fort Worth area!

Search the Cool Infographics site

Custom Search

Subscriptions:


Feedburner

The Cool Infographics® Gallery:

How to add the
Cool Infographics button to your:

Cool Infographics iOS icon

- iPhone
- iPad
- iPod Touch


Read on Flipboard for iPad and iPhone

Featured in the Tech & Science category

Flipboard icon

Twitter Feed
From the Bookstore

Caffeine Poster

The Caffeine Poster infographic

Entries in news (62)

Thursday
Mar062008

Design Journal interview


Design Journal is the magazine for members of The Society of News Design (SND). The Editor, Jonathon Berlin, approached me a while back for a quick interview to include in an upcoming issue. The interview was just published in the Winter 2008 issue (#105), which has a whole theme about data and graphics.

Unfortunately, the magazine is for members of SND only. However...


...Jonathon also published most of the interview on the SND Update blog, so you can read the interview online.

Jonathon, thank you very much for the visibility and the press!

Saturday
Mar012008

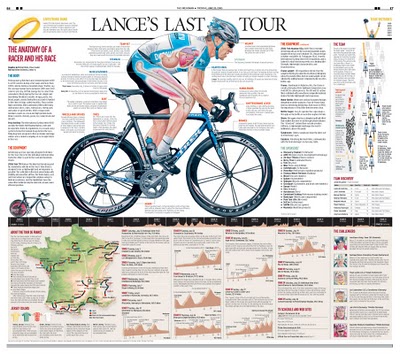
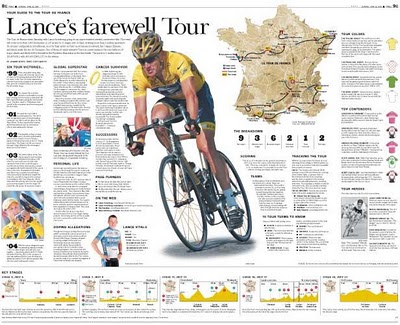
Lance's Last Tour


I found two good newspaper infographics from 2005 covering Lance Armstrong's last Tour de France on newsdesigner.com where you can get larger PDF files that make good posters. Both are two-page graphics (doubletrucks). The first is from The Oregonian (above), and the second is from the St. Pete Times (below).


Found on NiXLOG.

Tuesday
Feb262008

Infographics for Advocacy


I got a note from John Emerson, the author of Visualizing Information for Advocacy, and I wanted to share that his booklet on using infographics for NGO's and advocacy organizations is now available online as a free PDF (6.9MB) at apperceptive.com. Although geared to advocacy groups, the information is definitely relevant to everyone.

John also has a blog post up on Social Design Notes.

Outstanding job John!

Saturday
Feb092008

Concentric Circle Disaster


Breaking News: Series Of Concentric Circles Emanating From Glowing Red Dot

This had one had me laughing out loud. From theonion.com, a news parody of how disasters are covered on TV using infographics. Watch out for those circles!

Found on Infosthetics.

Monday
Feb042008

Who has the Nuclear Weapons?

An infographic video from GOOD Magazine, a quick 3-minute video that shows who has the nukes, how many they have, and how much damage would one nuke hitting the Empire State Building cause.

Found on tunequest.org

Tuesday
Jan082008

One Year in Iraq


New infographic from nytimes.com depicting the 2,592 deaths in Iraq over the course of the entire year of 2007. The graphic is credited to Alicia Cheng, a graphic designer at mgmt. design in Brooklyn.

The chart below — compiled from data provided by the American and Iraqi governments and news media organizations (the independent Coalition Casualty Count in particular) — gives information on the type and location of each attack responsible for the 2,592 recorded deaths among American and other coalition troops, Iraqi security forces and members of the peshmerga militias controlled by the Kurdish government.

I think this is an improvement over the "31 Days in Iraq" graphic because the new graphic identifies every death as a separate figure instead of grouping some together. There are also some differences in data, as the new graph doesn't include the Iraqi civilian deaths. So the "31 Days in Iraq" graphic showed over 1,900 deaths in January 2007, this new graphic only shows 163 deaths in January.
And, sadly, civilian fatalities in Iraq last year were simply too numerous to represent on a single newspaper page.

I'll keep an eye out in early February to see if they publish one for the month of January as they have the last couple of years.

Thursday
Nov222007

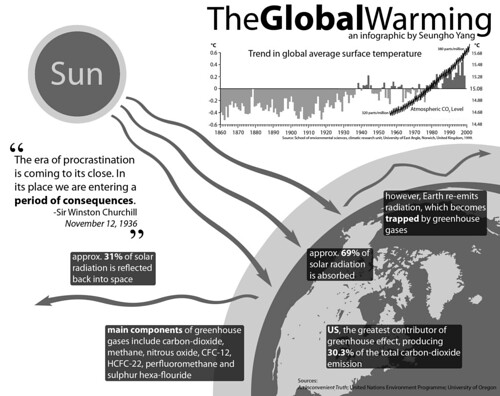
TheGlobalWarming Infographic


TheGlobalWarming Infographic, originally uploaded by Seungho.

Found on Flickr by Seungho.

Friday
Nov022007

The President's Entourage


Found on Digg, a quick graphic showing the massive entourage that travels with the President.

Monday
Oct222007

Wikipedia Activity Visualization


From A Beautiful WWW, this image is a pretty good attempt to visualize the article revision activity on Wikipedia. An article explaining the visualization is here, but the image is a combination of images are from the most linked-to articles, and the size of the colored dots represent the amount of revision activity in the linked articles.

A really cool interactive version was made using the Google Maps API so you can zoom in and move around the graphic.

Wednesday
Oct172007

Americans Remain Woefully Ill-Informed


Wired magazine calls infographics like this "infoporn". I guess you could call this a version of a bubble chart, but it shows a comparison of what people knew in 1989 vs. 2007. Separately it shows knowledge of three questions based on the respondent's usual source of news.

I can't tell how big the sample size was, or what type of people they interviewed. It quotes the source as the Pew Research Center for the People & the Press, but that alone isn't enough to make it credible.

Page 1 ... 2 3 4 5 6 ... 7 Next 10 Entries »