About
Randy Krum
President of InfoNewt.
Data Visualization and Infographic Design

Infographic Design

Infographics Design | Presentations
Consulting | Data Visualizations

DFW DataViz Meetup

Join the DFW Data Visualization and Infographics Meetup Group if you're in the Dallas/Fort Worth area!

Search the Cool Infographics site

Custom Search

Subscriptions:


Feedburner

The Cool Infographics® Gallery:

How to add the
Cool Infographics button to your:

Cool Infographics iOS icon

- iPhone
- iPad
- iPod Touch


Read on Flipboard for iPad and iPhone

Featured in the Tech & Science category

Flipboard icon

Twitter Feed
From the Bookstore

Caffeine Poster

The Caffeine Poster infographic

Entries in Online Lifespan (4)

Wednesday
Dec302015

Designing Infographics That Last

The web is inundated with new content on an hourly basis. So much so that it can be hard for any content to stand out. Readers have an attention span shorter than a goldfish! With trending hashtags, sponsored posts and the brevity of posting with fewer than 140 characters, hot trending topics often play a factor in the success of your infographics. But it doesn’t have to. 

While we’re busy flitting from one project to the next, always looking ahead, it’s possible to lose track of our content once it has passed the design phase. But the long-term success of your content relies on more than just good design. I define the Online Lifespan of your infographic as the amount of time it remains relevant to the audience, and it plays a huge role in the measurable success of your content. 

First, you need to determine your project’s goals. What is your goal for this infographic? Are you looking for a short-term boost in traffic? Or are you looking to post content that readers will view and share for years to come? 

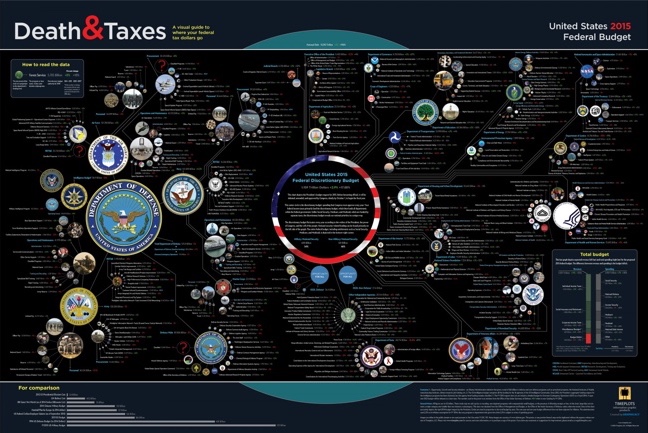
Sometimes your infographic works with an online lifespan somewhere in between. For example, the annual “Death & Taxes” poster visualizes the Federal Budget and has a lifespan of a year before its information becomes outdated when a new budget is released.

Death and Taxes poster infographic

SOURCE: Timeplots

If you’re looking for longevity, however, choosing a lasting topic for your content can work to your advantage. Here are just a few of the benefits:

  • More bang for your buck: It essentially costs you the same amount of time and resources to design an infographic with a short online lifespan as it would for a design with a long lifespan. You spend the same amount of time and effort in your design and research, but gain two very different results.
  • Visibility: No one will be searching for the Top 10 Christmas Traditions in 2015 after December 25, 2015, so all of your traffic needs to happen within a short period of time. A longer-lasting way to frame this infographic would be to create a timeline of Christmas traditions over the last few hundred years. Although this isn’t typically “evergreen” content, you’ll see a resurgence of traffic every year around Christmas time. Without a hard end-date, your infographics can live on driving views, backlinks and social shares for years to come.

History of Christmas Traditions infographic

SOURCE: Balsam Hill

  • Less maintenance: Once you’ve created a piece of evergreen content, there’s little to no maintenance necessary to keep your content relevant.

While there are situations where trendy and timely content can work in your favor, creating content with a longer online lifespan can lead to longer lasting success. It all comes down to the topic choice and the type of data.

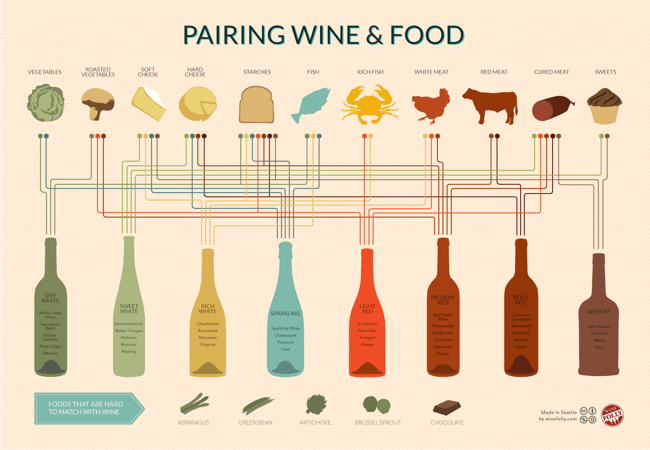
Selecting your topic is the most important factor in determining the online lifespan of your infographic. Jumping on a breaking news topic is a great way to get your client some quick visibility, but does little to increase its long-term exposure. However, coming up with truly evergreen content like the infographic below will keep your content relevant long after you’ve created it. 

Wine and Food Pairing Chart infographic

SOURCE: Wine Folly

Keep these goals in mind when selecting a topic for your next infographic. A blend of trending topics and evergreen content can build a very robust content strategy.

Tuesday
Nov262013

Thanksgiving Timed Right

Thanksgiving Timed Right infographic

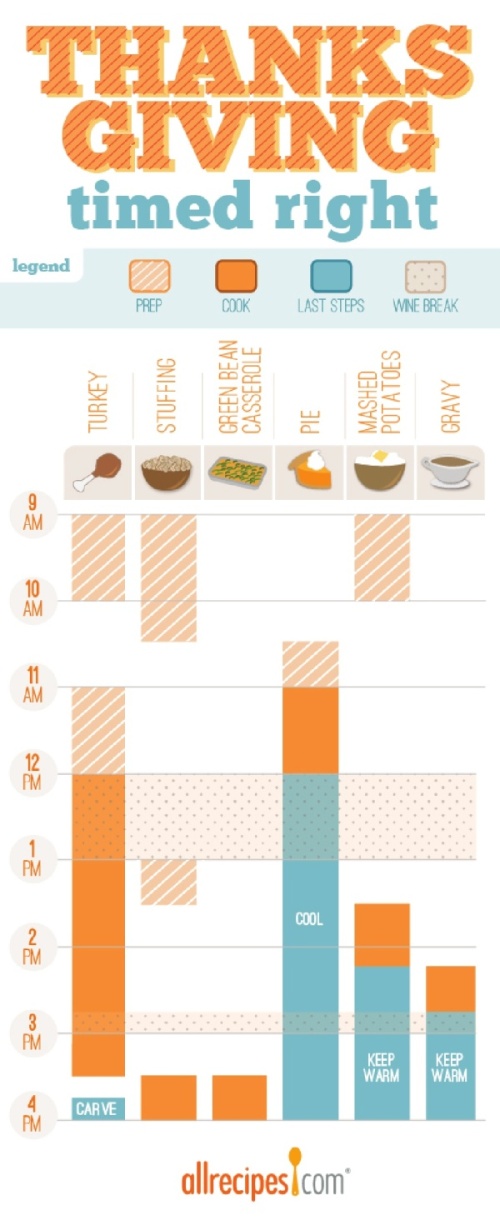
Thanksgiving Timed Right is a timeline infographic from allrecipes.com that helps everyone plan when to start cooking each dish for Thanksgiving dinner.  You want everything to make it to the table at the same time right?  I especially appreciate the Wine Breaks!

Great idea, and I know many, many people that struggle to figure this out on their own.  As an infographic released on the web, it really needs to have the URL back to the original full-size version included in the footer.  Many people are going to share this infographic with friends and family, but very few with correct link back to the Fresh Bites Blog where you can find the original.

The topic choice here is fantastic!  This design will have an Online Lifespan of many years as people go looking for this information every November.

Also found posted on Scribd by StephanieRobinett

Monday
Sep302013

10 Things You Probably Didn't Know About the iPhone

10 Things You Probably Didn't Know About the iPhone infographic

10 Things You Probably Didn’t Know About the iPhone from NextWorth takes a look at some of the amazing stats and facts about Apple’s flagship product.

Designed by InfoNewt, this infographic is a good case study in topic selection and release timing.  September was a month full of Apple iPhone news and hysteria surrounding the release of the new iPhone 5S, the iPhone 5C and the major upgrade to iOS 7.  There were a bunch of infographics released about the rumors surrounding the new phones, but as soon as the new iPhones were officially announced all of the rumor designs became obsolete.

The topic choice and data visualized in this design has a much longer online lifespan.  The content about the history and growth of the iPhone will be relevant for at least a year, maybe longer.  The infographic will continue to drive traffic and links to the NextWorth site.

Tuesday
Oct252011

What is a Stock?

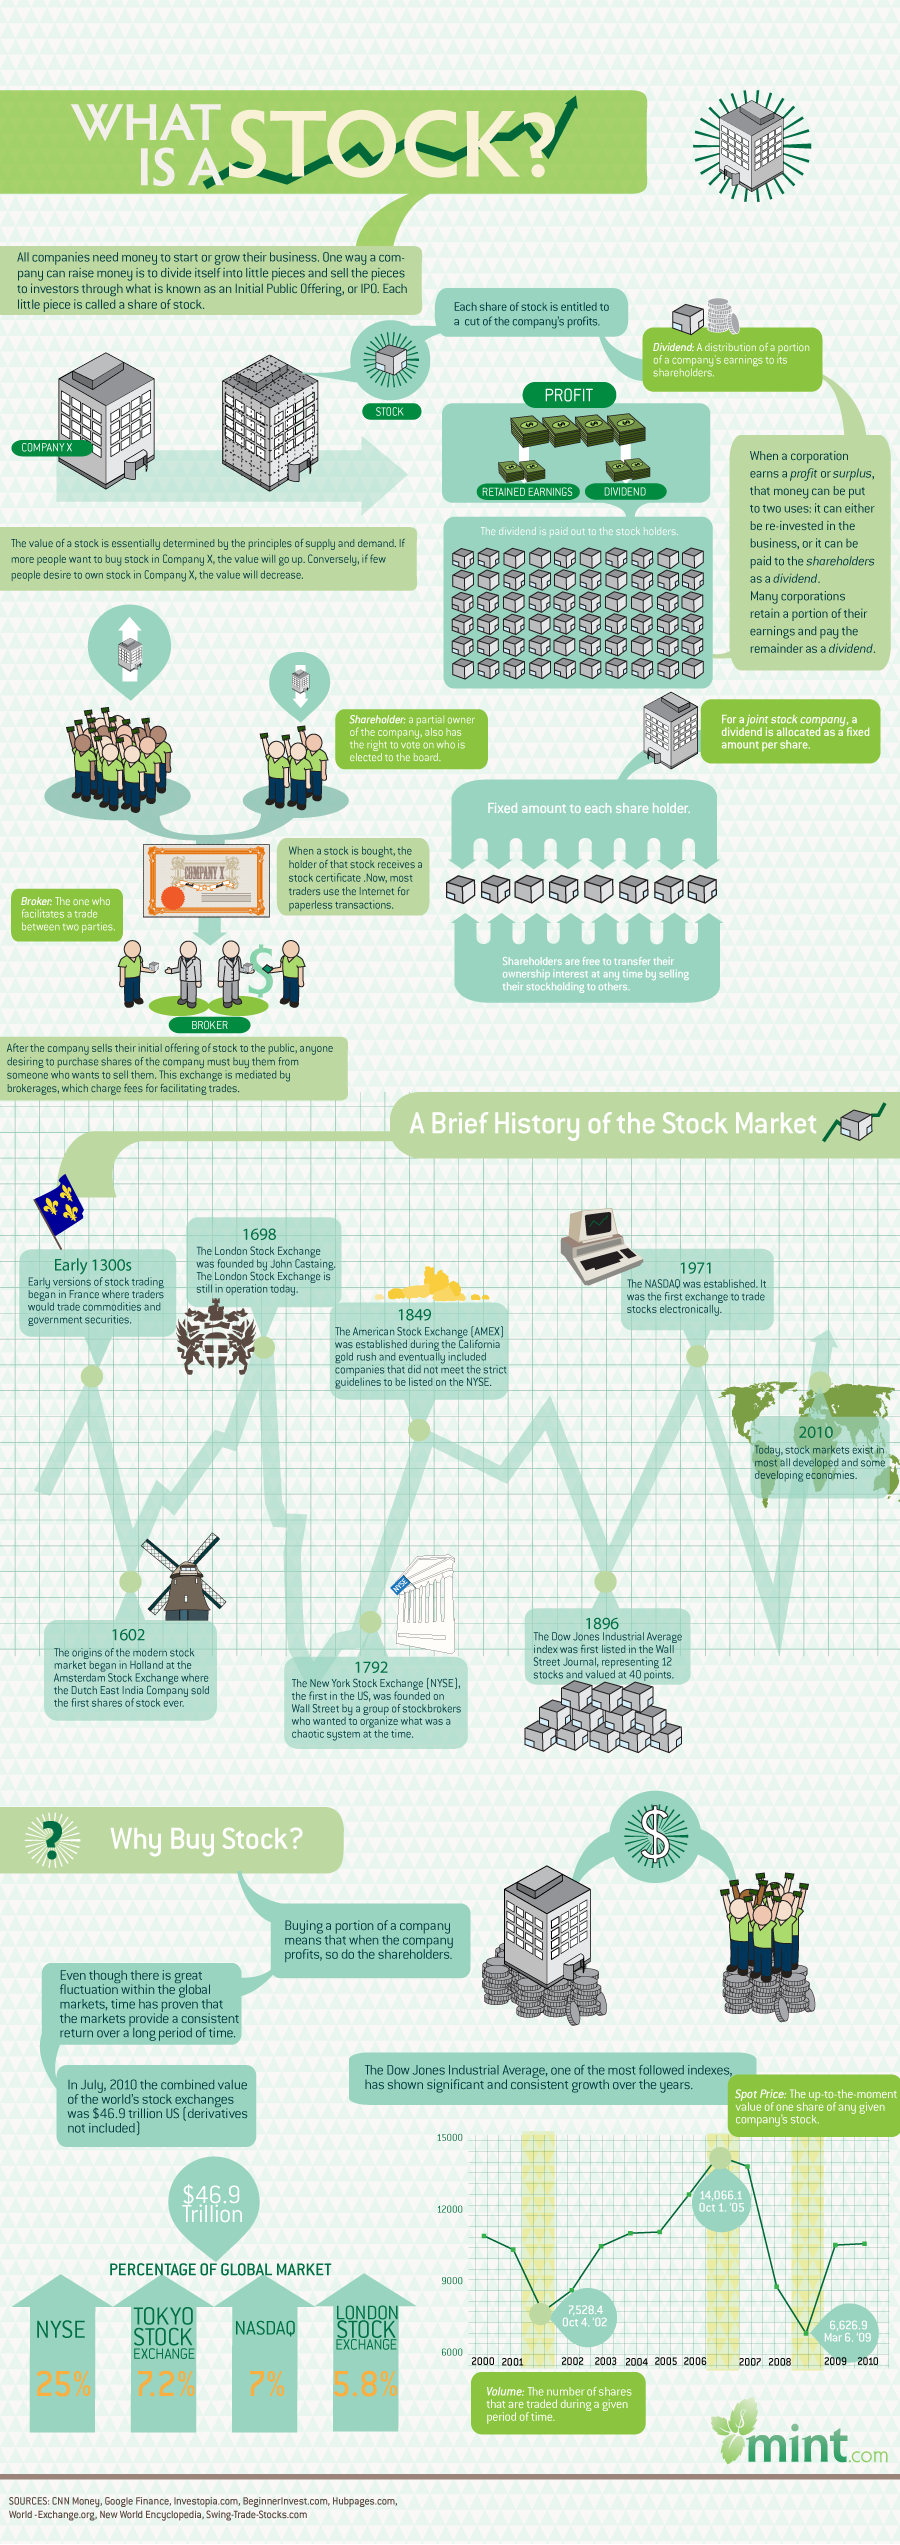
What is a Stock? from Mint.com explains what stock ownership is.  It’s informative to the readers (a little text heavy), and doesn’t come across like an ad.

To make investment choices that ultimately pay off, you need to start by knowing the fundamentals. It’s a step many investor wannabes skip, since… well, studying the basic terms and trends is not exactly entertaining. We thought one way of helping you get a jumpstart on your basic investing terminology is a series of infographics that explain, visually, basic concepts. First up: what is a stock?

This is a good example of what I call the Online Lifespan of an infographic.  Instead of an infographic about a recent news topic, this one covers an informational topic that doesn’t change or drop out of the news cycle.  It’s more than a year old, but the information is still relevant, and continues to drive traffic for Mint.  This design probably has an Online Lifespan for 4-5 years before the Dow Jones chart at the bottom makes the whole infographic feel dated.

What’s the line chart in the middle?  It’s a timeline, but the height of the line chart has no meaning whatsoever.  This should have shown some type of information, but instead is just confusing to the reader.

Thanks to Dawn for sending in the link!