About
Randy Krum
President of InfoNewt.
Data Visualization and Infographic Design

Infographic Design

Infographics Design | Presentations
Consulting | Data Visualizations

DFW DataViz Meetup

Join the DFW Data Visualization and Infographics Meetup Group if you're in the Dallas/Fort Worth area!

Search the Cool Infographics site

Custom Search

Subscriptions:


Feedburner

The Cool Infographics® Gallery:

How to add the
Cool Infographics button to your:

Cool Infographics iOS icon

- iPhone
- iPad
- iPod Touch


Read on Flipboard for iPad and iPhone

Featured in the Tech & Science category

Flipboard icon

Twitter Feed
From the Bookstore

Caffeine Poster

The Caffeine Poster infographic

Entries in search (22)

Wednesday
Jun302010

Google(graphic) - How Google Works


PPCblog.com brings us the Google(graphic) flowchart that documents what happens in the fraction of a second after 300 million people press the Search button every day.  Created by infographic designer Jess Bachman at WallStats.com.

So here is my latest infographic, hot off the press.  How Google Works.  It’s a flow type chart that diagrams the process of how google gets it data and what happens in the second after you search.  It’s a $20 billion a year process for google, and pretty interesting.

Wednesday
Apr212010

The Social Media Effect

This was the original infographic, The Social Media Effect, from InfographicWorld that inspired part of yesterday’s post, The Visual FAQ of SEO.  This infographic maps out the process of what happens when social media gets excited about your posted content.

A great example of why I started the Cool Infographics blog in the first place.  Create a great place to find inspiration to create your own infographics.

Tuesday
Apr202010

The Visual FAQ of SEO infographic

A Visual FAQ to SEO is a great infographic from Matt at Datadial.net covering many of the different aspects of Search Engine Optimization for your web pages.

Images are a fantastic way to present data and abstract concepts, they’re a much clearer way of getting information across and more people take the time to digest it. I thought it would be a good idea to try to present solutions and explanations to the more common SEO questions that we hear from our clients.

The image covers everything from basic keyword research concepts, through site architecture, page optimisation, link building, SEO tactics, social media, and some basic SEO and PPC clickthrough stats and explantions.

Portions appear to be inspired by The Social Media Effect from Infographic World.  (Look for tomorrow’s post)

Found on Social Media Graphics

Wednesday
Mar312010

The World Christianity Maps

From FloatingSheep.com, this is the Christianity Map that maps the volume of searches related to the different branches of Christianity across the globe.  The great cartographers from Floating Sheep published three maps showing the world, the U.S. and Europe.

…discovered patterns that are incredibly clear. Catholics are most visible in much of the Northeast and Canada, with Lutherans taking the Midwest, Baptists the Southeast, and Mormons unsurprisingly taking much of the mountain states. Methodists, interestingly, seem to primarily be most visible in a thin red line between the Southern Baptists and everyone else.

Taking a closer look at Europe, there is a fascinating split between Orthodox Eastern Europe, Protestant Germany, and Catholic everywhere else. In places such as the UK that contain more Protestants than Catholics it is likely that people aren’t using the actual term “Protestant” as a signifier of their religion.

These are a more detailed look specifically at Christianity after some of their earlier work on the Google Geographies of Religion that look at searches for the different figures of religion across the globe.

Found on the GOOD Blog and The Atlantic.

Wednesday
Mar102010

What Do You Suggest? A Visual Search Interface

Using a mindmap-style visual interface, WhatDoYouSuggest.com shows you the search results from Google in an easy-to-use interface.  Created by Simon Elvery, the interface returns the top words that Google suggests based on your initial query.  By clicking on the relevant words, the search becomes more relevant, and more words are suggested to narrow your search.

Both the order of words and the thickness of the lines are meaningful.  More detailed information is available on the Simon’s blog.


What Do You Suggest takes a seed from you (or gives you something random) then guides you on a journey through language and the collective lives of Google users.

Using data from Google to make suggetions on where you might like to go next, What Do You Suggest is an experimental and interactive environment designed to explore how we use language and search on the internet.

  • The words that appear first in each set of options are the words Google thinks are most likely to be what people are looking for.
  • The words joined by the thickest lines are ones which will produce the most results if you searched for them on Google.


Of course, I had try see what “infographics” cam up with…

Found on Information Aesthetics and Gizmodo.


Tuesday
Jan192010

6 Twitter Topic Visualizations for "Caffeine Poster"

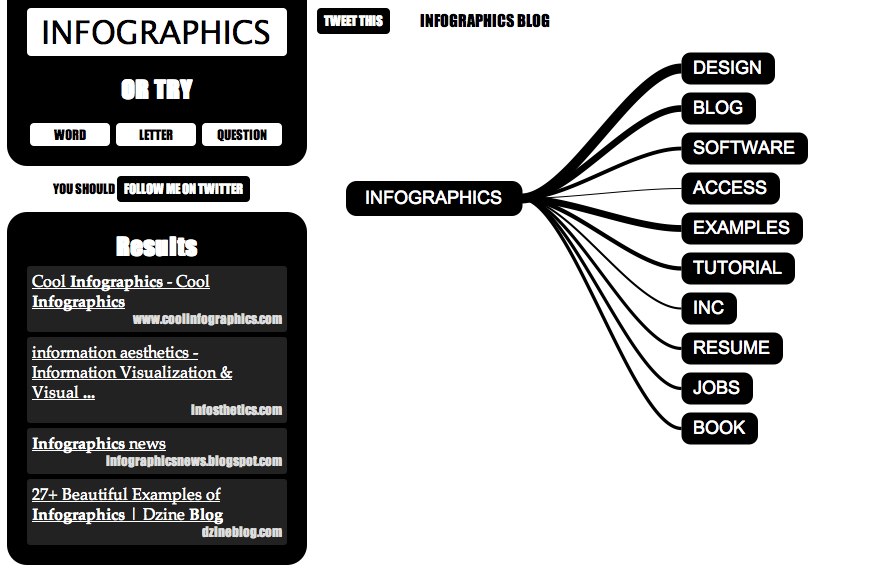
The Caffeine Poster got a huge amount of traffic, specifically on Twitter, so I thought this would be a good chance to share a collection of the available, interactive twitter visualizations.  Although there are many visuals that show a Twitter user’s network of connections, these are visualizations that show conversations based on the search topic “caffeine poster” on Twitter.

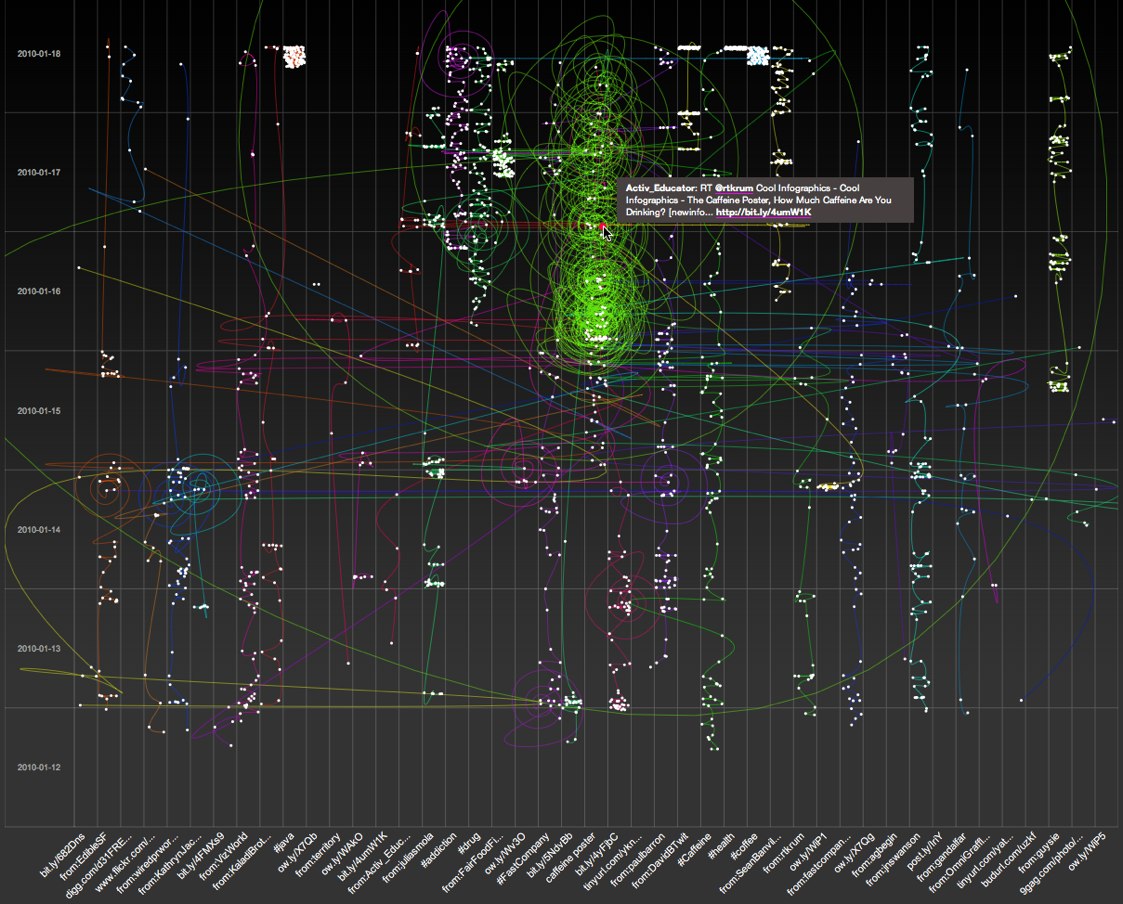
SocialCollider.net, by Karsten Schmidt and Sascha Pohflepp, maps the connections within a conversation starting with a Twitter stream or search topic.

This experiment explores these possibilities by starting with messages on the microblogging-platform Twitter. One can search for usernames or topics, which are tracked through time and visualized much like the way a particle collider draws pictures of subatomic matter. Posts that didn’t resonate with anyone just connect to the next item in the stream. The ones that did, however, spin off and horizontally link to users or topics who relate to them, either directly or in terms of their content.


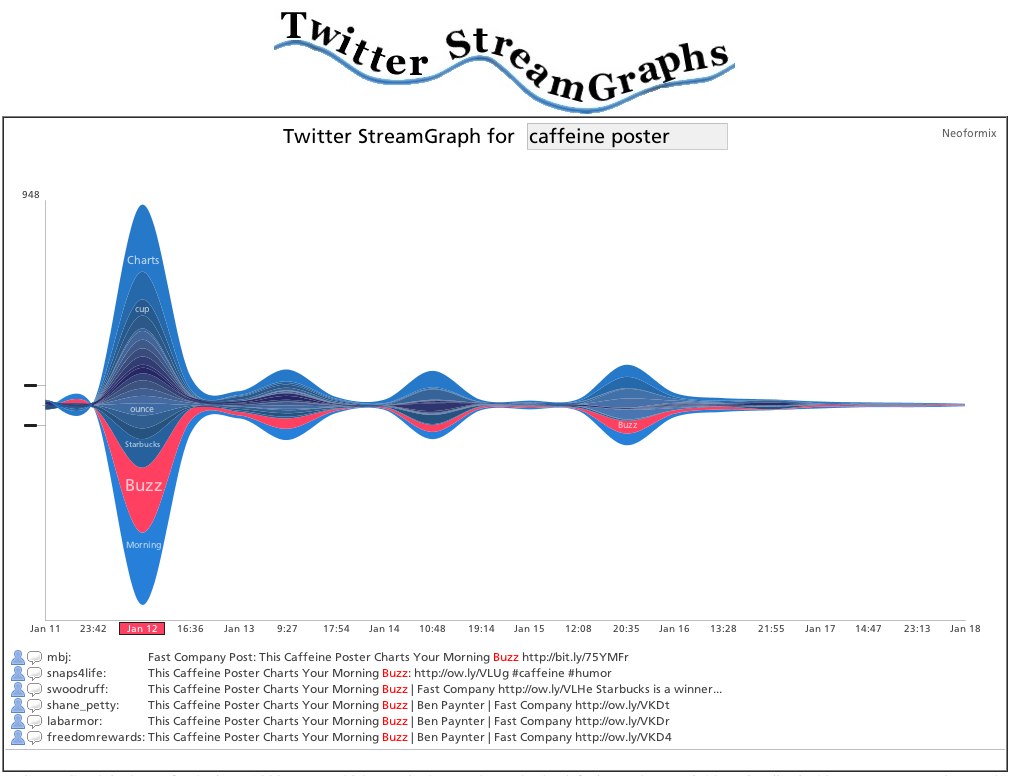
The Twitter Streamgraph from Jeff Clark at Neoformix.

The StreamGraph shows the usage over time for the words most highly associated with the search word. One of these series together with a time period are in a selected state and coloured red. The tweets that contain this word in the given time period are shown below the graph. You can click on another word series or time period to see different matches. In the match list you click on any word to create a different graph with tweets containing that word. You can also click on the user or comment icons and any URL to see the appropriate content in another window. If you see a large spike in one time period that hides the detail in all the other periods it will be useful to click in the area to the left of the y-axis in order to change the vertical scale.


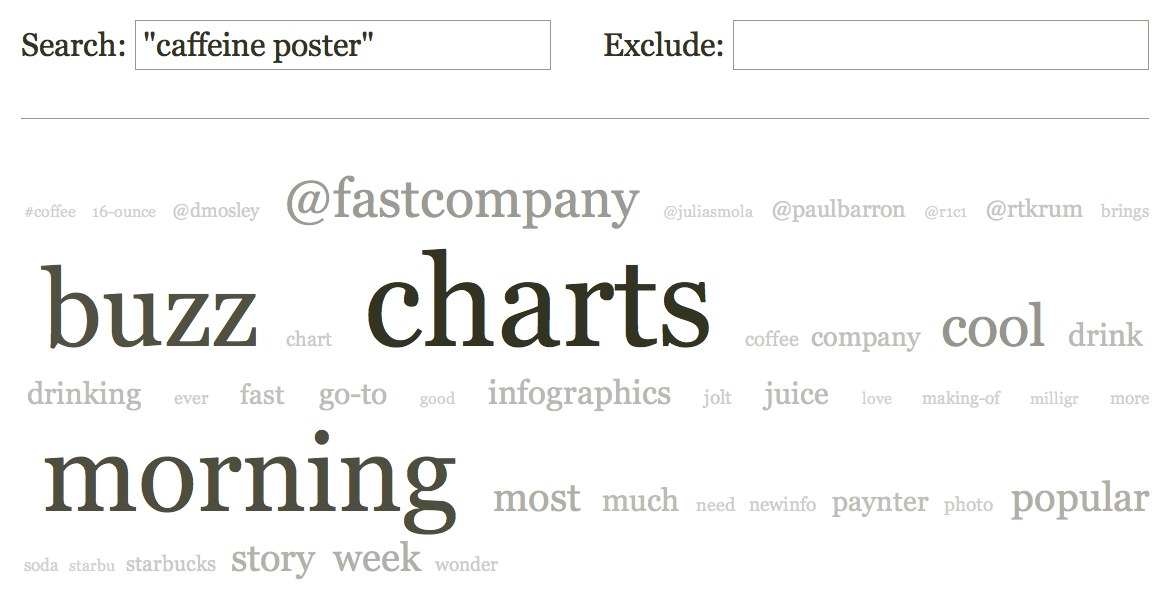
Cloud.li, by Elbert F, creates a word cloud based on your search terms.


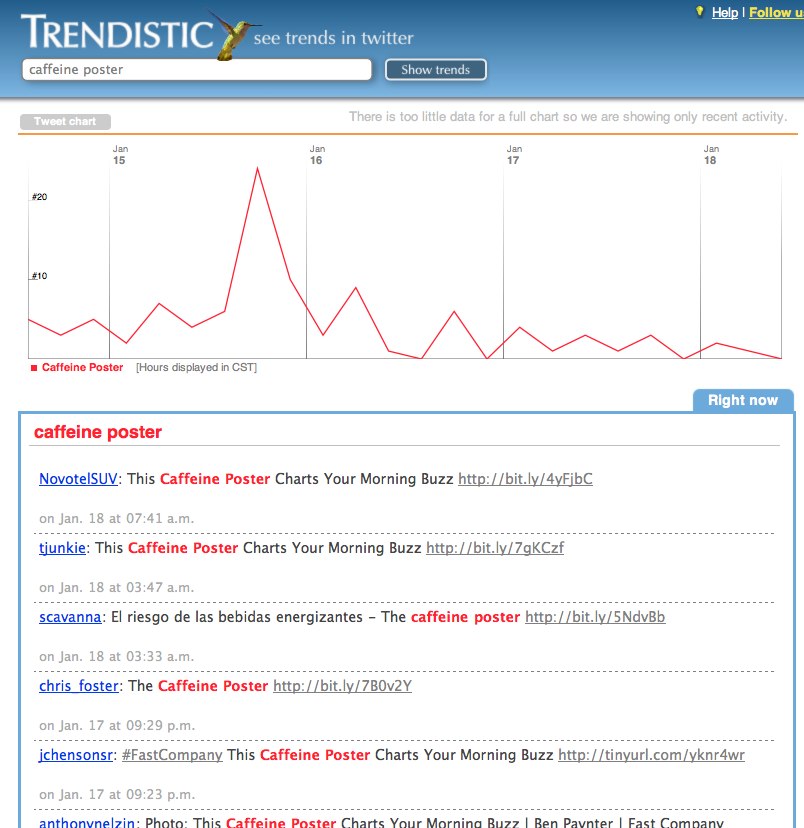
Trendistic will plot the tweet volume on a timeline based on your search terms.  You can click anywhere on the timeline to see the specific tweets for that time too.

Trendistic is a tool that allows you to track trends on Twitter, similarly to what Google Trends does for Google searches. It gathers tweets as they are posted, filters redundant ones and compiles the rest into one-hour intervals.

This way, it shows how the frequency of one, two, three and four-word phrases fluctuate over time. The result is a visualization of what is popular and what is not among Twitter users, and how certain events are reflected or even predicted by themicroblogosphere.

You can enter a phrase (topic) in the 
Trendistic search box to see how its frequency varies over time, or several different topics separated by commas to see how they relate (each topic will show in the chart with a specific color): try comparing ‘dinner’ and ‘breakfast’ or ‘morning’ and ‘night’ for instance, to see how powerful it can be. 


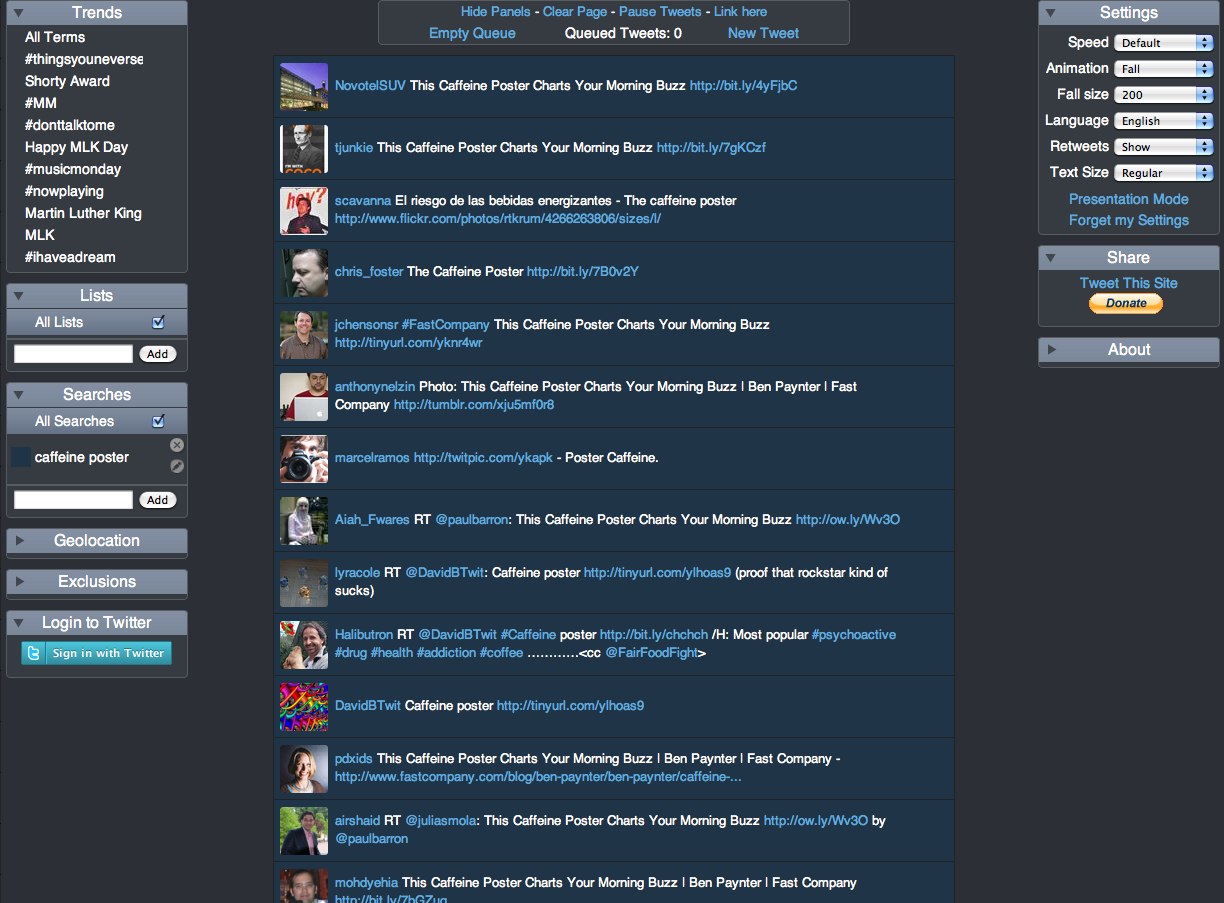
TwitterFall shows you the tweets based on your search term, and presents them as an animated waterfall.

Twitterfall is a way of viewing the latest ‘tweets’ of upcoming trends and custom searches on the micro-blogging site Twitter. Updates fall from the top of the page in near-realtime.

For popular trends, Twitter is queried from the Twitterfall server, and results arepushed to your browser, rather than your browser doing the queries, or your computerpolling our server repeatedly. This means using Twitterfall for popular trends is nicer on Twitter than other services.


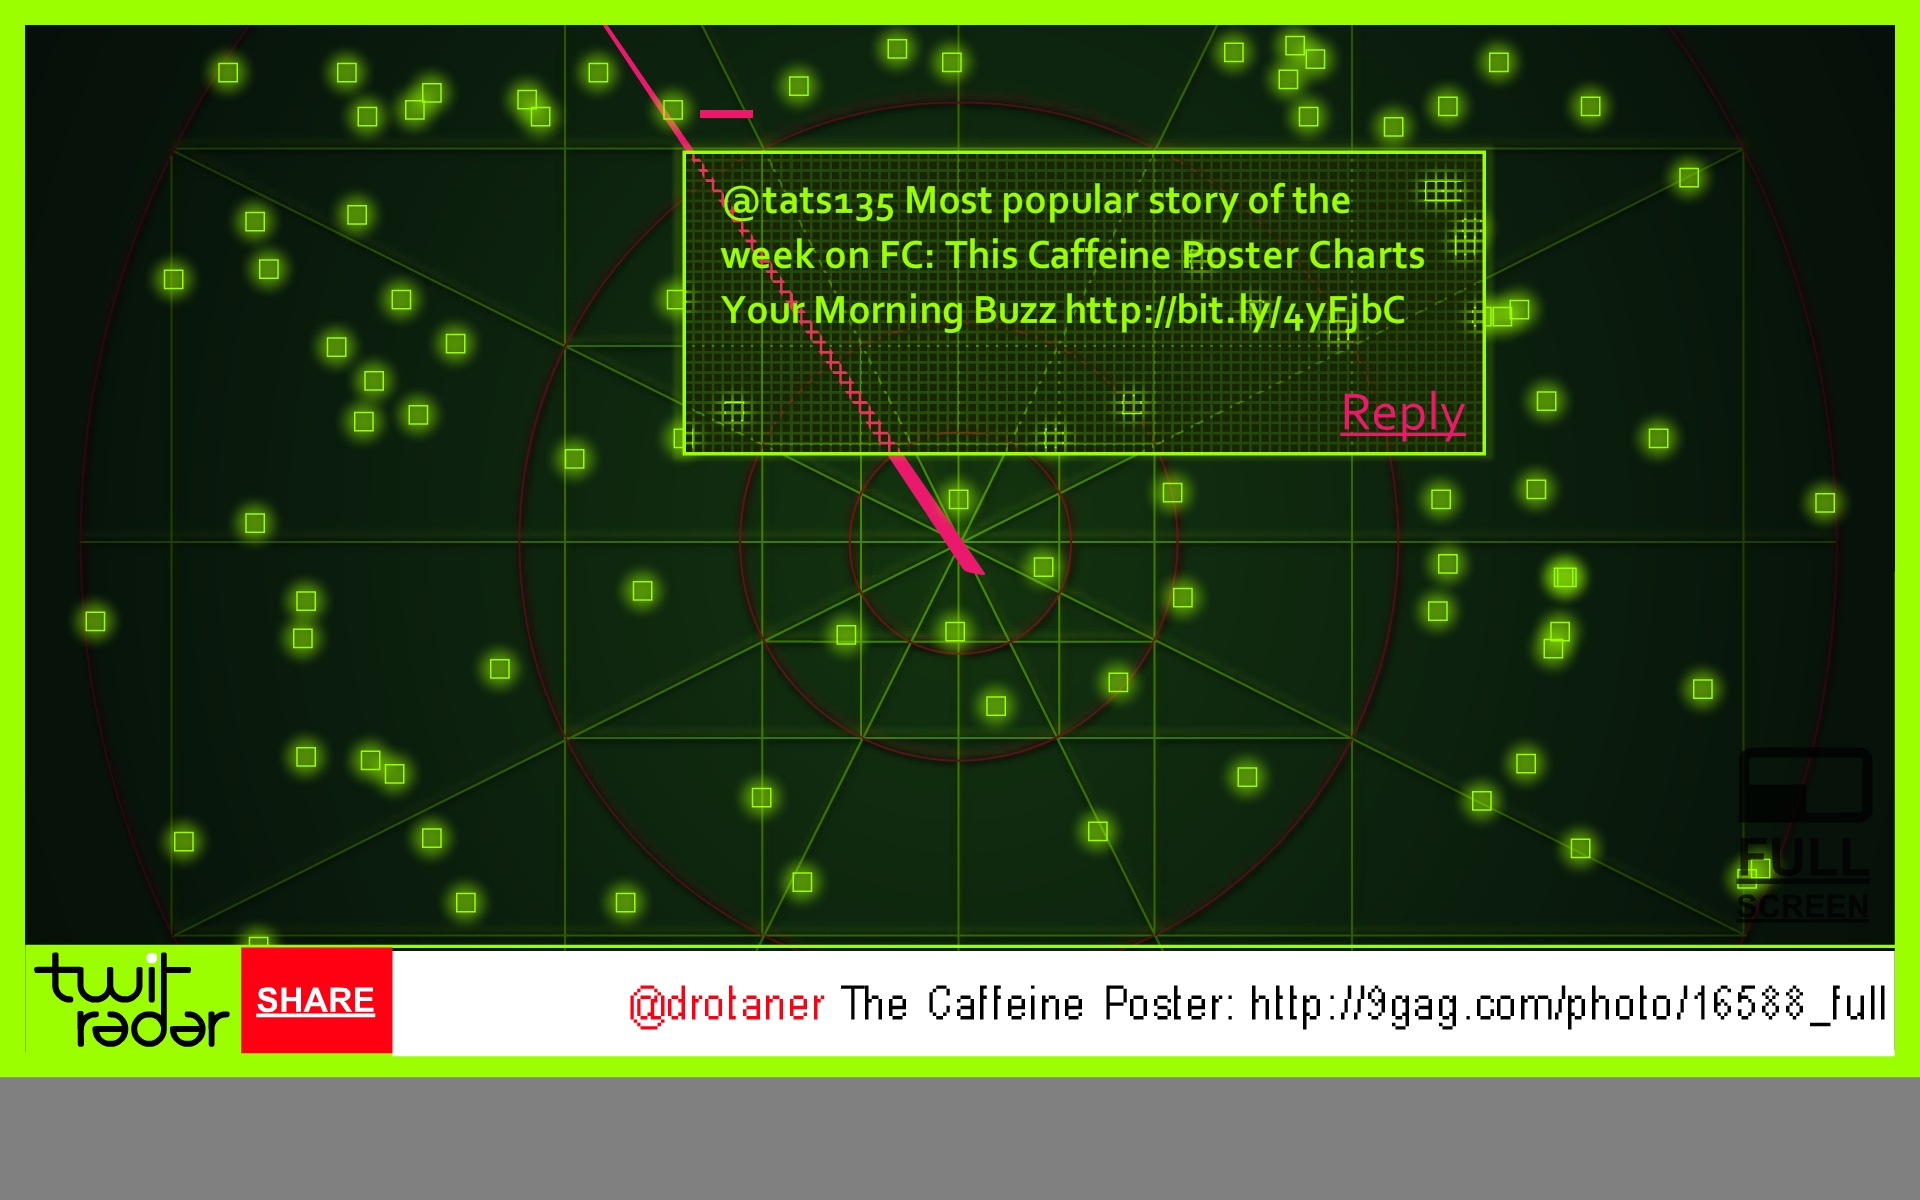
 TwitRadar.com will map out a search term, a user or a hastag into a handful of different visuals.

Google Translated from Portuguese: The TwitRadar is a tool for monitoring Twitter. With TwitRadar you can track, monitor and share real-time, the subject you want. Just type the tag you want to track, the TwitRadar show, very simple and intuitive, all that is written about it on Twitter. And not to be confused with the volume of information tracked, the TwitRadar organizes the results according to the criteria that you want.

Thursday
May212009

What is Wolfram|Alpha?

I'm not sure I understand what Wolfram|Alpha is yet, but so far it's pretty impressive.  Developed by Stephen Wolfram and his team, it claims to be a "computational knowledge engine".  The input box looks like a search engine, but it is definitely NOT a search engine.


When you type in a question, it attempts to show you all of the relevant data it can find.  It is actually calculating and charting this information real-time in order to present it to you.  Because its built on top of the Mathematica Engine, it can also handle math problems.


I think this will be an important tool for many designers of infographics, because you can get some of your raw data directly from Wolfram|Alpha.  As they add more data into the system over time, this will become one of your best resources for information.  They have a pretty extensive page of examples by category that is a great place to start.  Also watch the short video by Stephen Wolfram showing what the system can do.

Wednesday
Aug062008

Visual Baby Name Trends site

NameTrends.net is a fantastic interactive site that charts and maps the popularity of baby names over the last century in the U.S.  You can look at the most popular names, or search for specific names to see their results.  The chart above shows the top 20 baby names from the 2000's decade (10 boys and 10 girls).  You can see that those names also had some popularity at the end of the 19th century.

The site also allows you to map the name popularity by state.  The slider across the top allows you to see the geographic distribution by year.

Found on Information Aesthetics.

Monday
Jun022008

Beware of Search Spider Traps


Another good SEO infographic on making sure your website is friendly to search spiders from Elliance.com. Don't forget, you can sign up to receive their weekly infographic email.

Wednesday
Mar192008

Name that Color

From blog.doloreslabs.com, they showed 1,300 different colors to people on Mechanical Turk, and asked them to name the color.

The above picture contains about 1,300 colors and the names for them that Turkers gave. Each is printed in its color and positioned on a color wheel. Just looking around, there sure seem to be different regions for different names. But there are also rich sets of modifiers (”light”, “dark”, “sea”), multiword names (”army green”), and fun obscure ones (”cerulean”).
They also created a Color Label Explorer tool to only show those color names that match your search term, but still keep them in place on the color wheel graphic.