About
Randy Krum
President of InfoNewt.
Data Visualization and Infographic Design

Infographic Design

Infographics Design | Presentations
Consulting | Data Visualizations

DFW DataViz Meetup

Join the DFW Data Visualization and Infographics Meetup Group if you're in the Dallas/Fort Worth area!

Search the Cool Infographics site

Custom Search

Subscriptions:


Feedburner

The Cool Infographics® Gallery:

How to add the
Cool Infographics button to your:

Cool Infographics iOS icon

- iPhone
- iPad
- iPod Touch


Read on Flipboard for iPad and iPhone

Featured in the Tech & Science category

Flipboard icon

Twitter Feed
From the Bookstore

Caffeine Poster

The Caffeine Poster infographic

Entries in Television (16)

Monday
Jul092012

Anatomy of a Television Commercial

Anatomy of a Television Commercial infographic

Commercials, we don’t like them but we still have to watch them. (Except for superbowl commercials, those are funny!)  However, they are expensive to make and a lot of thought goes into them. The Anatomy of a Television Commercial by Voices.com explains what it takes to be a commercial worth it’s costs to make.

Learn about how to create a compelling TV ad in this visually appealing infographic. See key developments in the television ad industry and who the key players are. Learn how to write a script, what a good script length is and how to choose the right voice talent for a TV commercial.

This design does a good job leading the reader through a story top-to-bottom.  The use of the TV illustrations as frames for the different data visualizations consistently reinforces the television-related topic without text.

Where they messed up the visualizations is in the Television Commercial Durations section.  At first, I couldn’t understand why the visuals all looked wrong, but I finally realized they made a full circle equivalent to 100 seconds, instead of the standard 60 seconds used on EVERYONE’S clocks all over the world!  The 60-second visual should be a full circle, and not the 2/3 shaded circle shown.  Big visualization mistake!  Don’t confuse your audience.

I find it interesting that ad spending and television ad portion of advertising budgets continue to rise even with some many new ways to more effectively advertise online.  If there are any advertisers reading this post, may I point your attention to the Advertise page for Cool Infographics…

Thanks to Ashley for sending in the link!

Tuesday
Jan032012

The Timeline of Doctor Who

A highly detailed historical Timeline of Doctor Who from Cabletv.com!

Check out this complete timeline of Doctor Who from 1963 to present, including episodes, seasons, companions, villains, and more. Scroll down to follow all the Doctor’s adventures through time. A Fantastic resource for any Doctor Who fan.

First and formost it’s a timeline of the Doctor Who episodes from 1963-2011.  I’ve posted earlier Doctor Who related infograpics here before (The Doctor Who infographic), but none that contained this level of detail.  From left-to-right you have seasons, episodes, which Doctor, which companions, key villains and additional facts.  When you view the timeline on the original page, the episode titles are also listed on the left side and aligned with the infographic.

There are a couple design changes I would propose that would have made the data easier to understand.  One of the things I love is that there is no legend, or any need for one.  All of the descriptions for the color-coding and data visualizations is included in the visual designs.  However, some of the color-coding is inconsistent.  The color for Rose Tyler as the first of the modern companions is green in the timeline, but then additional facts about Rose are colored blue in the last column.  This is also true about the character of the The Master, and other companions, where a consistent color-coding would have made the connections easier for the reader to understand.

Thanks to James for sending in the link!

Friday
Sep162011

HBO Recycling Program

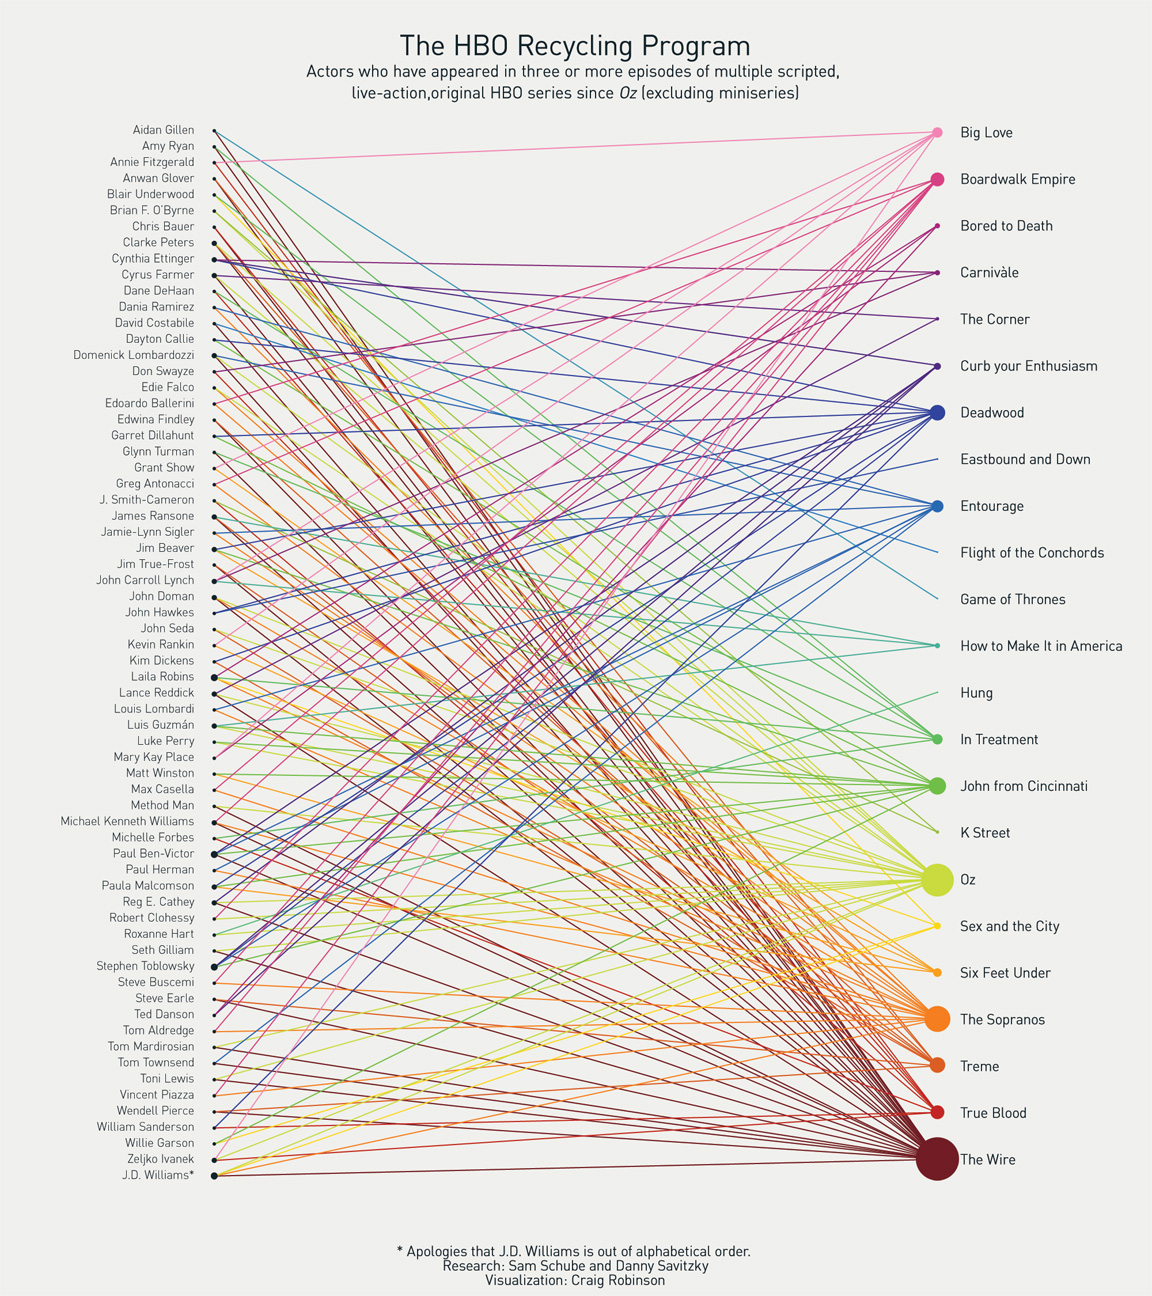
The HBO Recycling Program is a visualization by Craig Robinson that shows many of the actors and actresses that HBO has used in multiple series.  This was posted as part of an article on Grantland.com.

Actors who have appeared in three or more episodes of multiple scripted, live-action, original, HBO series since OZ (excluding miniseries).

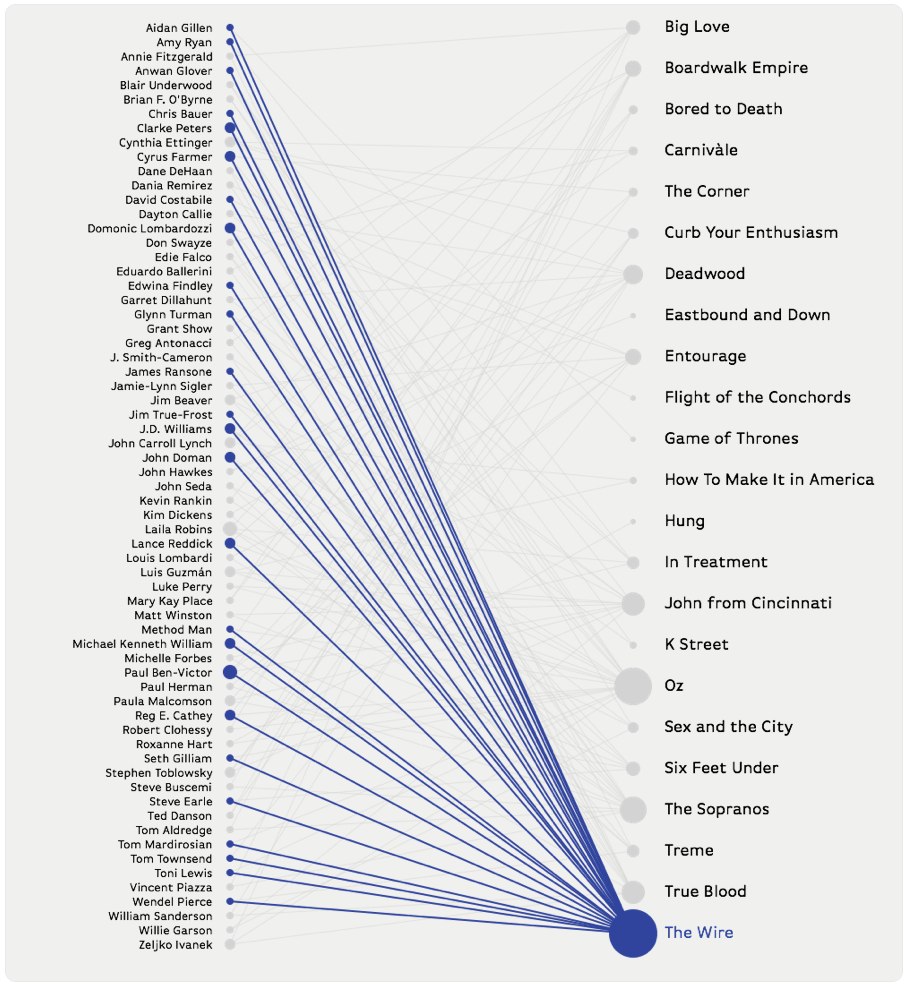
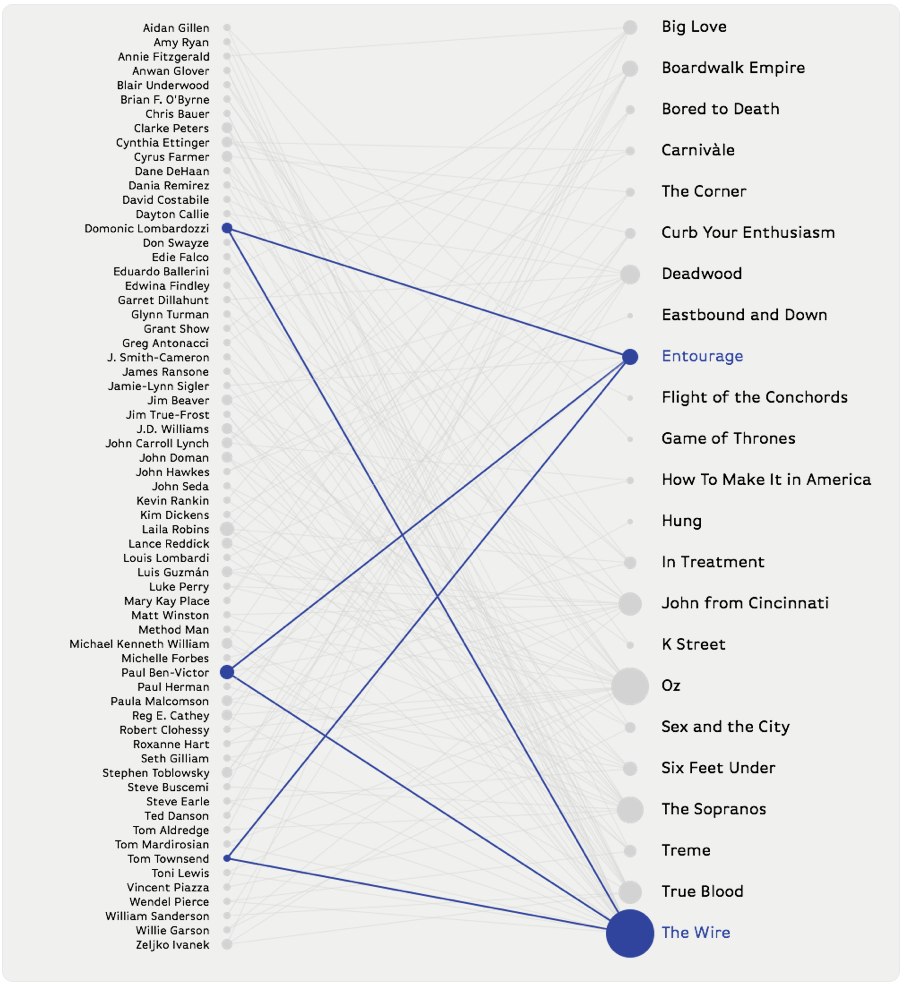
Inspired by the original visualization, an interactive version was created by Zack Grossbart that allows you to highlight either the show, or the actor, and it will display the connections.


Click on two shows, and the interactive version will highlight only those actors in both shows.


Zack’s interactive infographic is made with PaperJS, underscore.js, and a little JQuery.  He has made the code open source, and it can be used to display the connections between other groups as well, if anyone has the motivation to map their own connections. 

Tuesday
Aug302011

18 Things You Didn't Know About Firefly


You can’t stop the signal…

As a Browncoat, I had to post this new infographic: 18 Things You Didn’t Know About Firefly from CarSort.com.

Firefly has quickly become a cult classic, after it was cancelled by Fox in 2002, after airing only 11 episodes (out of order). Firefly was created by Joss Whedon who is best known for creating Buffy the Vampire Slayer and is set to direct and write The Avengers movie set for release in the summer of 2012. Firefly is a space western set in the 25th century where the renegade crew of the Serenity try to stay one step ahead of the long arm of the Alliance.

CarSort.com has put together a fun infographic with little known facts about Firefly and Serenity.

  • Did you know that Neil Patrick Harris was turned down for the role of Simon
  • Some people believe that Firefly was a rip off of an amine series called Outlaw Star
  • Some of the sets were recycled from Power Rangers
  • Zac Efron made his TV debut on Firefly…

Certainly not the best infographic design I’ve ever seen

  • WAY too much text!  This is really a text list with some images.
  • No data visulizations for the body counts
  • Should have included a visual size comparison of Serenity to the ISS or the Battlestar Galactica when either of them was mentioned
  • No data sources listed.  Where did these facts come from?  Are they really true?
  • No license listed on the infographic (Copyright or Creative Commons)?

But the infomation is cool, and I learned a few things I didn’t know.  Joss, you can hit that red button any day now…

Thanks to Brenden for sending in the link!

Monday
Feb282011

Visualizing Daily Activities With Media Wheel


I really like the Media Wheel for Visualizing Daily Activities from Hill Holiday.  The wheel visualizes how people consumer different types of media over the course of a day.  For example, DVD/Video is mostly consumed in the evening and Newspaper is mostly consumed in the morning.  each slice is a different type of media, and the consumption levels are shown by how bright the colors are at that time of day.

For a media planning project, we needed to find a simple way to illustrate how people in a particular segment engage with different media. After some experimentation, we came up with this “media wheel” chart that summarizes 216 data points from a media spreadsheet.  

Read their blog post, they included a good description of how they normalized the data and created the media wheel.  They also gave credit to the designer, Eric Fensternheim, which is always nice to see.

The wheel graph itself was built by hand in Adobe Illustrator. Each data point’s value relative to the highest in its row is tied to the corresponding level of color transparency.

Design: Eric Fensterheim, media design intern.

Wednesday
Feb092011

The Doctor Who Infographic

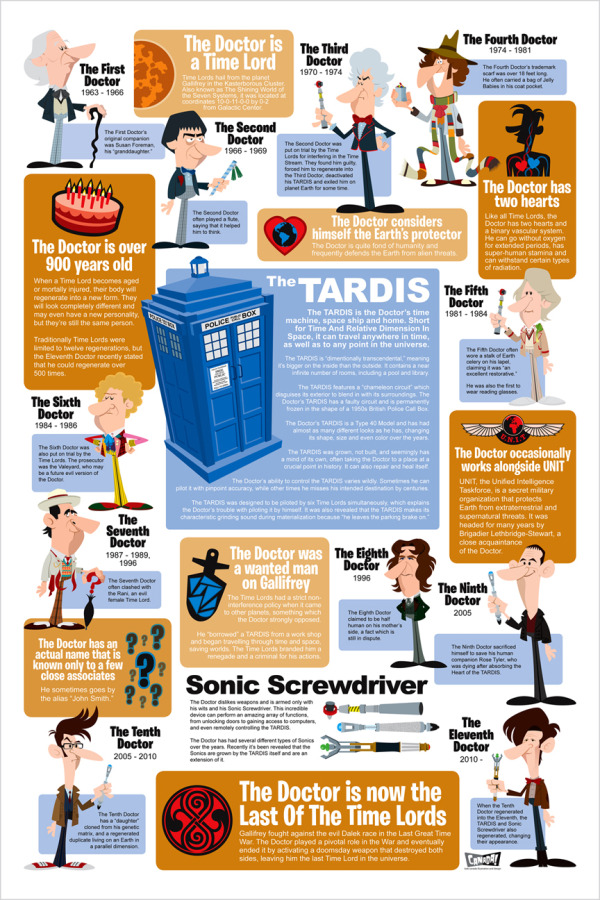
Very cool overview Infographic History of Doctor Who, with some fantastic illustrations, by Bob Canada (@bob_canada on Twitter).  The world of Doctor Who is incredibly complex, but this infographic gives new viewers the basics.


Here’s everything you’ve ever wanted to know about the Doctor, but were afraid to ask. Click here to see a super-sized version so you can better read the text.

This piece took quite a while to finish. I worked on it a little at a time over several days. There was a lot of moving around of elements and a lot of text editing to get everything to fit in an efficient manner. Hopefully there aren’t any glaring errors in the information.

Laid out entirely in InDesign. All the Doctors, the Sonics and the TARDIS were drawn in InDesign as well.


You can tell from the illustrations that the hair was iconic for each Doctor.  You could probably identify each doctor in silhouette by the hair alone!

Page 1 2