About
Randy Krum
President of InfoNewt.
Data Visualization and Infographic Design

Infographic Design

Infographics Design | Presentations
Consulting | Data Visualizations

DFW DataViz Meetup

Join the DFW Data Visualization and Infographics Meetup Group if you're in the Dallas/Fort Worth area!

Search the Cool Infographics site

Custom Search

Subscriptions:


Feedburner

The Cool Infographics® Gallery:

How to add the
Cool Infographics button to your:

Cool Infographics iOS icon

- iPhone
- iPad
- iPod Touch


Read on Flipboard for iPad and iPhone

Featured in the Tech & Science category

Flipboard icon

Twitter Feed
From the Bookstore

Caffeine Poster

The Caffeine Poster infographic

Entries in education (65)

Wednesday
May112011

Student Bullying infographic

Student Bullying
[Source: Buckfire and Buckfire.com]

From Buckfire & Buckfire in Michigan, comes an infographic about Student Bullying in the U.S.

Student bullying in schools in the United States is a serious issue and very prevalent in our school systems today. The statistics show that a student is bullied every seven minutes in our country and that most bullying occurs on playgrounds. The effects of bullying are profound and have a major psychological impact on the bullied student and often causes learning problems in the classroom.

The majority of states have bullying laws on the books, but most are not significant enough to impact this problem or reduce the amount of bullying that occurs nationwide. Without more stringent laws and the actual enforcement of those laws, school systems will not feel the pressure to take the affirmative measures necessary to eliminate the bullying problem that terrorizes so many innocent and vulnerable children everyday.

The lawyers at our law firm receive calls from concerned parents every week about their children who are being bullied in Michigan schools. We are actively pursuing lawsuits in several cases. We created the infographic below to display the facts and statistics about student bullying.

I really like the statistics shared in this one, although they should have visualized more of the numbers.  A value like 160,000 students miss school every day out of fear could be put into context if they had visualized it in comparison to total students or something like that.  

I really like the fact that since they get so many calls from parents, that they chose an infographic to reach out to their customers to share some of the facts.  This is a great example of using an infographic to provide valuable information to parents and teachers everywhere.  People will share it because it’s good content, and some may eventually become new customers.

Thanks to Kathryn for the link!

Wednesday
Apr202011

Social Media and College Admissions


Are colleges using social media as part of the student admissions process?  Schools.com explored this topic with the Reading Students like an Open Facebook infographic.  It’s hard enough to get teenagers to understand that online photos and status updates will be a permanent record of their behavior for the rest of their life, but even more immediately it could impact their entrance into college!

As Facebook has become more and more popular—if it were a country, it would be the third largest in the world—its use in the field of education has expanded, too. In fact, more than 80% of college admissions officers report using Facebook as part of their recruiting process. 

Are admissions officers really looking at the Facebook profiles of prospective students? And if so, are they making admissions decisions based on these profiles? Below is an infographic that highlights the answers to these questions and more—which might surprise you.

Thanks to Kristen for sending in the link!

Wednesday
Jan122011

I Love Charts - PBS Kids Video

I Love Charts” is a fun little video about charts and visualizing data for children from PBS Kids.

Found on Chart Porn

Monday
Oct252010

Waiting For Superman - Infographic Video Trailer

Participant Media - Pledge To See This Film from CypherAudio on Vimeo.


Cool infographic trailer for the upcoming movie Waiting For Superman, a film about the declining state of education in America.

Produced by directing team Buck, this animated ‘pledge’ trailer is for the forthcoming Davis Guggenheim film, Waiting For Superman, that investigates the crisis in the US education system…

A collaboration with Buck and takepart.com for Participant Media and Director Davis Guggenheim (An Inconvenient Truth). For the film ‘Waiting For Superman’.

music and mix by CypherAudio.

BUCK

–––––––

Creative Director: Ryan Honey

Executive Producer: Maurie Enochson

Producer: Eric Badros

Art Director: Joe Mullen

Animation: Jorge R. Canedo Estrada

Original Music: John Black


TAKEPART

–––––––

Carolyn Sams: Co-Producer

Wendy Cohen: Co-Producer


Found on Creative Review

Friday
Oct012010

"How Do I Become President?" Infographic Contest for Kids

From Challenge.gov and Kids.gov is an infographics contest for kids up to age 17.  “How Do I Become President?” invites kids to design an infographic or poster before the deadline on November 3, 2010. The Best Overall Infographic will win $2,500 in prize money, and a printed version will be sent to schools and libraries around the country.

Kids.gov is frequently asked, “How can I become the President when I grow up?” Help answer this question by creating an infographic or a poster that explains the process.

The winners will be featured on Kids.gov and the Best Overall Infographic will be printed as posters and distributed to schools and libraries across the country.


The judging lineup should be familiar to followers of CoolInfographics.com, I have posted many infographics from some of the infographic judges.

Ali Felski

Ali Felski is Sunlight Labs Senior Designer. Having previously worked for design agencies, WashingtonPost-Newsweek Interactive, and in the United States intelligence community, she brings a wide array of design experience and perspective to the projects in the Labs. Her work has been featured in widely-read Web design publications including Smashing Magazine, numerous CSS Galleries and her personal portfolio website won a South by Southwest award in 2009. She earned her BFA at the Savannah College of Art and Design.

Nicholas Felton

Nicholas Felton spends much of his time thinking about data, charts and our daily routines. He is the author of several Personal Annual Reports that collate countless measurements into a rich assortment of graphs and maps reflecting the year’s activities. He is the co-founder of Daytum.com, a site for counting and communicating daily data, and frequent designer of information graphics for numerous corporations and publications. His work has been profiled in publications including the Wall Street Journal, Wired and Creative Review.

Arlene Hernandez

Manager of Kids.gov

Sarah Slobin

Sarah Slobin has been a Visual Journalist for more than 15 years. She began her training at The New York Times where she spent over a decade working as a Graphics Editor across all the major new desks, as well as running the BusinessDay graphics department. Sarah left the Times to be the Infographics director for Fortune Magazine and Fortune.com. Currently, she is a Senior Graphics Editor at The Wall Street Journal.

Mike Wirth

Mike Wirth is a designer, educator and artist, who utilizes technology as his central medium. Mike is an assistant professor of New Media Design at Queens University of Charlotte and holds a Master of Fine Arts degree in Design and Technology from Parsons School of Design. He also owns and operates mikewirthart.com, where he produces interactive, print and motion media projects for clients of various industries.


Thanks to Jess and Arlene for sending in the link!

Tuesday
Sep282010

Homeschooling: By The Numbers infographic

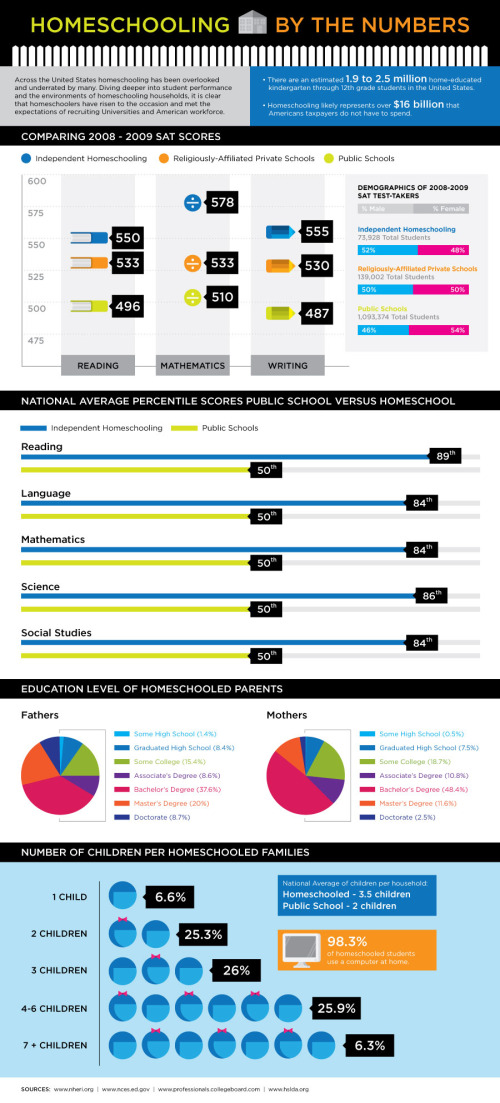
Homeschooling: By The Numbers is a good infographic from the DegreeSearch.org blog.  Simple statistics with a very clean design, but varied use of data visualization styles (bars, scales, pies).

Homeschooled students generally achieve higher SAT scores in reading, math and writing; as well as, ranking in the 80th percentile for math, science, social studies, language and reading. This may be due to the higher level of education of fathers and mothers that stay home to teach their children. Most have some college, an associates degree, or a bachelors degree.

Found on the Daily Viz from Visual Loop

Thursday
Sep232010

Client Infographic: The Good News for Online Degrees


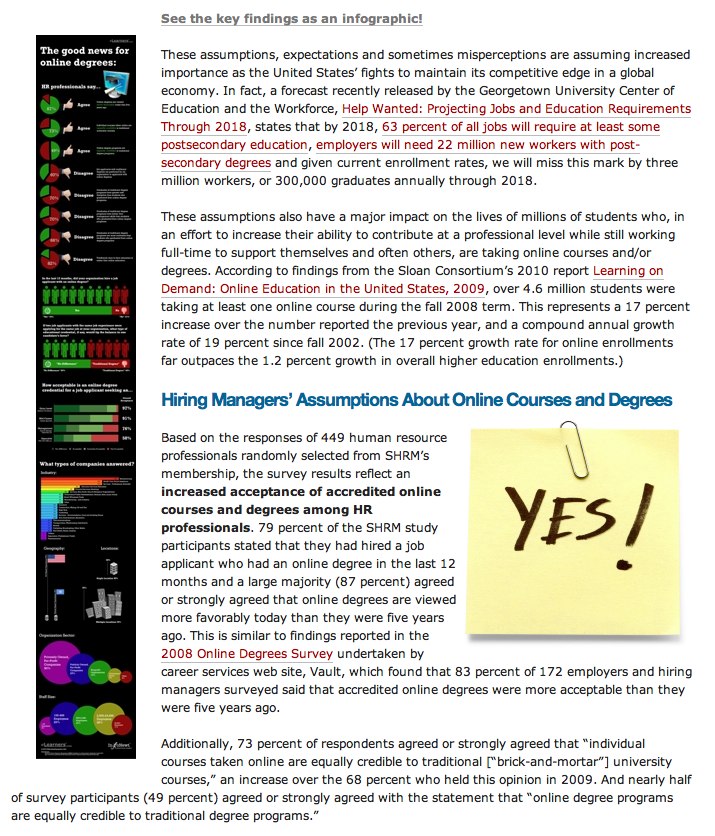
Good News for Online Degrees is a recent project InfoNewt (my company) designed for elearners.com to visualize the results of a survey of Human Resources professionals worldwide.

The results are good, as online degrees continue to gain credibility and popularity.  Designed as a companion infographic to the article “How Employers View Online Degrees” on the elearners.com website, the visual not only supports the article, but also stands on its own for posting on blogs.

I used a blend of pie charts, bar charts, circles and images to tell a story as you move down the visual.  The different visuals help separate the different questions that were asked in the survey, but always include the actual numbers as well.  For survey results, you want to be as transparent as possible by citing the source material, repeating the questions that were asked and using specific numbers to validate your visuals.

Personally, the most interesting results are in the stacked bar chart in the middle.  Online degrees have dramatically different levels of acceptance based on what level of role the applicant is applying for.

Available as a high-resolution GIF and PDF from the elearners.com site.

Cheers to Helen and everyone at elearners.com!

Tuesday
Apr272010

10 Tips for (journalists) Designing Infographics

This article was originally published on “Digital Newsgathering”, a class blog for Journalism 226 at San Francisco State University, Instructor: Staci Baird.  I wrote this post as a guest author, and with permission I am republishing it here.


Assuming you’re not working for a media corporation with huge graphics and statistics departments at your disposal, you may want to create some infographics for your own articles.  With today’s flood of information, infographics allow readers to quickly digest and understand complex data.  A good infographic will not only inform readers, but will also create interest and convince people to read your article similar to how good headlines and photos attract readers.  In contrast, both boring and overly complex graphics will quickly convince readers to ignore your article.

Here are 10 tips for designing better infographics (click the images to go to their original sites):


1) Be Concise: Design your infographic to convey one idea really well.  You’re not writing a scientific research paper, so don’t expect your reader to dig into a lot of detail.  This doesn’t mean you should only visualize one number, but your entire graphic should support one of the major points from the article.  You can include additional facts or information to make the infographic stand on its own, but don’t lose sight of the point you want to get across.

This example is an infographic poster I created about the caffeine content in drinks.  At this size, you can easily tell which drinks have more or less caffeine, and if you decide to view the higher-resolution image you can dig deeper into the details and additional information that’s included in the poster.
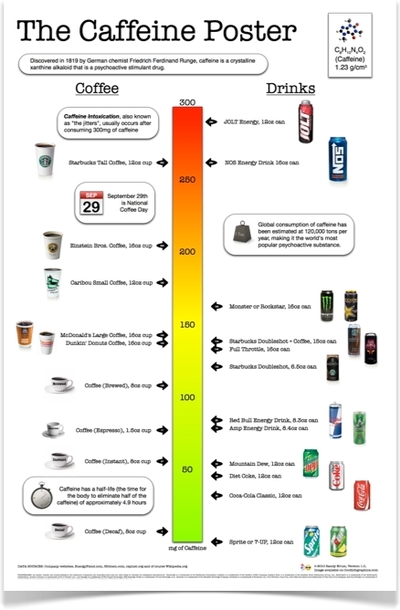
The Caffeine Poster, by Randy Krum


2) Be Visual:  Design your infographic with your final for viewing size in mind.  A number of articles online require the viewers to click on a text link to view the graphics that accompany an article, and I believe this is a huge mistake.  Design your graphics to be viewed in-line with your article.  There’s nothing wrong with allowing viewers to click the image to see a high-resolution version, but they should be able to understand the image when viewed with the article.  A side benefit is that a viewable image also allows for readers to share the image by itself on social media sites easily.
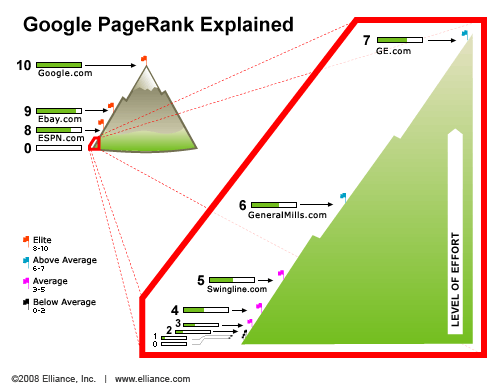
Google PageRank Explained, by Elliance


3) Be Smarter:  Build your data and explanation right into the infographic, and don’t make your readers have to work hard to understand what they’re seeing.  Your infographic shouldn’t need a legend to be understandable, and there’s no reason to ask your readers to keep moving their eyes back and forth between the chart and the legend to understand the graphic.  Treat your readers as intelligent and make your graphic look professional by including the relevant descriptions and numbers in the infographic.
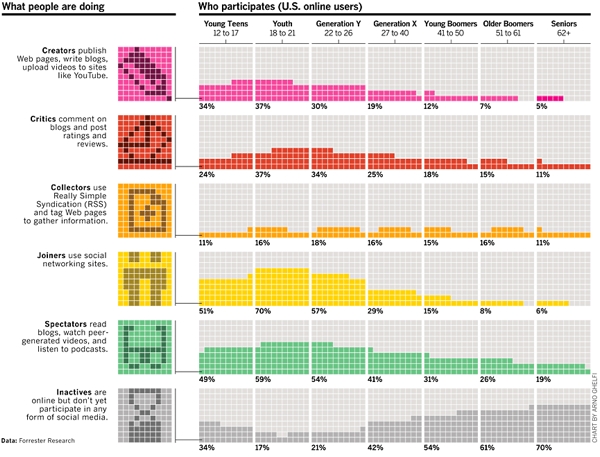
Who Participates Online?, by Arno Ghelfi for Wired Magazine


4) Be Transparent:  Infographics can be used to lead readers to the wrong conclusions.  Always cite your data sources and allow readers to dig deeper into the data if they have the desire.  Some of the best articles include easy access to the source data with links to a spreadsheet for readers to view on their own.
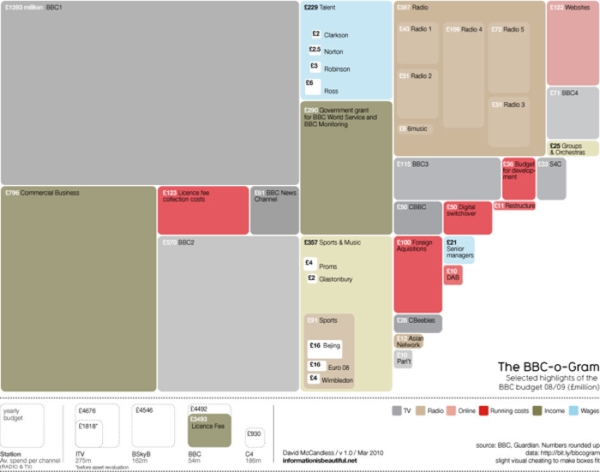
BBC Budget, by David McCandless

See the visual. Explore the data.


5) Be Different:  If you can avoid it, don’t use a bar chart, a line chart or a pie chart.  This infographic of visualization styles is a great resource to help determine a good visual to use for your data.  The different styles are grouped together by the type do data they are trying to communicate and in the interactive version, an example is shown as you mouse over each style.
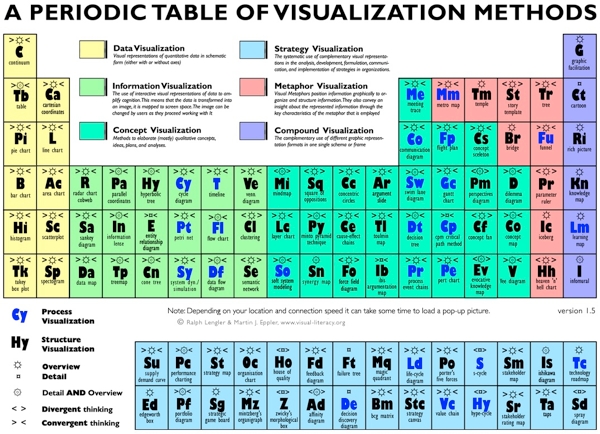
Periodic Table of Visualization, by Visual-Literacy.org


6) Be Accurate: Remember your geometry and visualize differences using area.  When trying to convey the scale of your data, many graphics use different sized shapes or images to show amounts relative to each other.  The reader’s eye sees the total area of the image as indicative of scale, not just the height of the image. 

For example, if you’re using circles to show one number is 3 times larger than another, the area of the circle must be in proportion to the values being represented.  If you make the mistake of making the diameter of the circle 3 times larger, the area is actually 9 times larger.
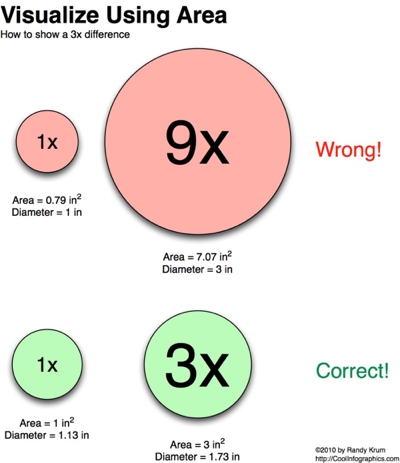
Circle Areas, by Randy Krum

The infographic below breaks down the number of FedEx trucks using the area of the circles in a mind map style image.  This could have been a simple bar chart, but it’s much more visually appealing as a bubble mind map.

The Fedex Universe, by Robin Richards for MeetTheBoss.tv

NOTE: One common exception to this is a standard bar chart.  No matter how wide the bars are, the height is the only dimension that conveys meaning.


7) Be Attractive: Include visuals:  Illustrations and photos included in the infographic make a big difference.  Even though this example is a bar chart, the inclusion of the company logos make it quicker and easier for the reader to understand.
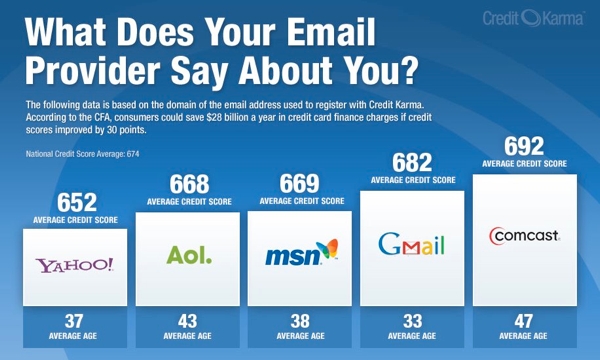
What Does Your Email Provider Say About You?, by CreditKarma.com


8) Be Varied:  Find a good visual style that’s right for the data you’re trying to share.  If your data is about countries, plot it on a world map not a bar chart that lists countries.  Also, don’t be afraid to mix visualization styles together in one infographic.  

This example infographic by Emily Schwartzman about the aftermath of the earthquake in Haiti won a design contest from GOOD Magazine, and mixes map data with a stacked bar and colored boxes for percentages.  This is also a great example of viewing size.  You can see and understand the visuals, but the actual numbers are available if you view the high-resolution version.
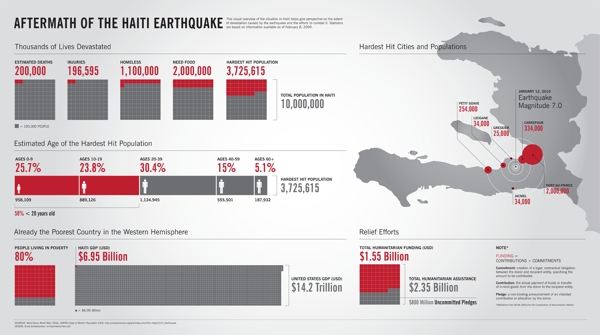
Haiti Earthquake Infographic, by Emily Schwartzman


9) Be Gracious:  Work on the assumption that your infographic may be viewed or shared without the article you originally designed it for.  Make sure that the final graphic includes the following pieces:

  • Copyright, to be explicit about any rights and terms of use
  • Source data, so anyone can check your facts
  • Designer’s name, always give credit to the artist/illustrator/programmer/designer
  • Original image/article address, so anyone who sees the image can find your original article


10) Be Creative:  Use whatever tools you have available to create your infographic.  Of course, the tools you use will depend on what you are trying to visualize.  Many infographics can be created using simple applications like a vector drawing program (like OmniGraffle or Microsoft Visio), a charting program (like Microsoft Office or Apple iWork) or an image editing program (like Adobe Photoshop).

Here are some visual tools available on the Internet: 

Thursday
Apr152010

The Feltron Annual Report 2009 and an Online Class April 29th

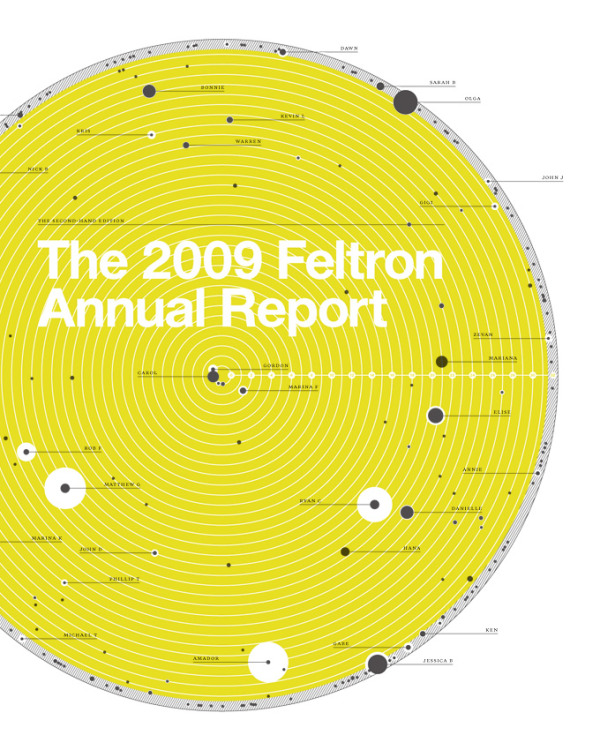
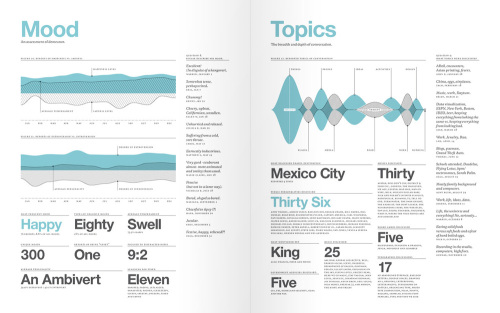
I’m not sure how it slipped off the radar, but I haven’t posted a link to the Feltron Annual Report 2009 here on the blog yet.  Nicholas Feltron has done infographics for Time, CNN, Wired, New York Times, Fast Company and more, but probably his most popular infographics are his annual reports.  The print version of the Feltron Annual Report 2009 is available for pre-order for $30 from the Feltron Store.

Mike Aruz interviewed Nicholas Feltron when the 2009 Annual Report was released on mikearauz.com

The reason this came up today is that Nicholas is going to be the host of Live DesignCast: Nicholas Felton, A Master Class on Information Design.  This is an online class from PRINT Magazine on April 29, 2010 at 4pm EST.  The class costs $69 and is one hour long.

Our current information age has produced an inevitable crush of complicated data to sort through. Thankfully, there is a rising group of designers who present all this data in a way that we can understand and use. And for the last several years, no one has done it better than Nicholas Felton. 

In this Master Class, Felton explains how detailed data leads to better stories, offers a few guidelines for displaying complicated data sets, and challenges you to use all five senses through the process. 

In this Master Class DesignCast, you’ll learn: 

• How to visualize large data sets
• How to go from an initial question to gathering, comparison, and display 
• How to use sensors, whether hardware or software, to gather data
• How data helps satisfy curiosity, provides insight, and entertains
• How better data leads to better stories

Monday
Feb012010

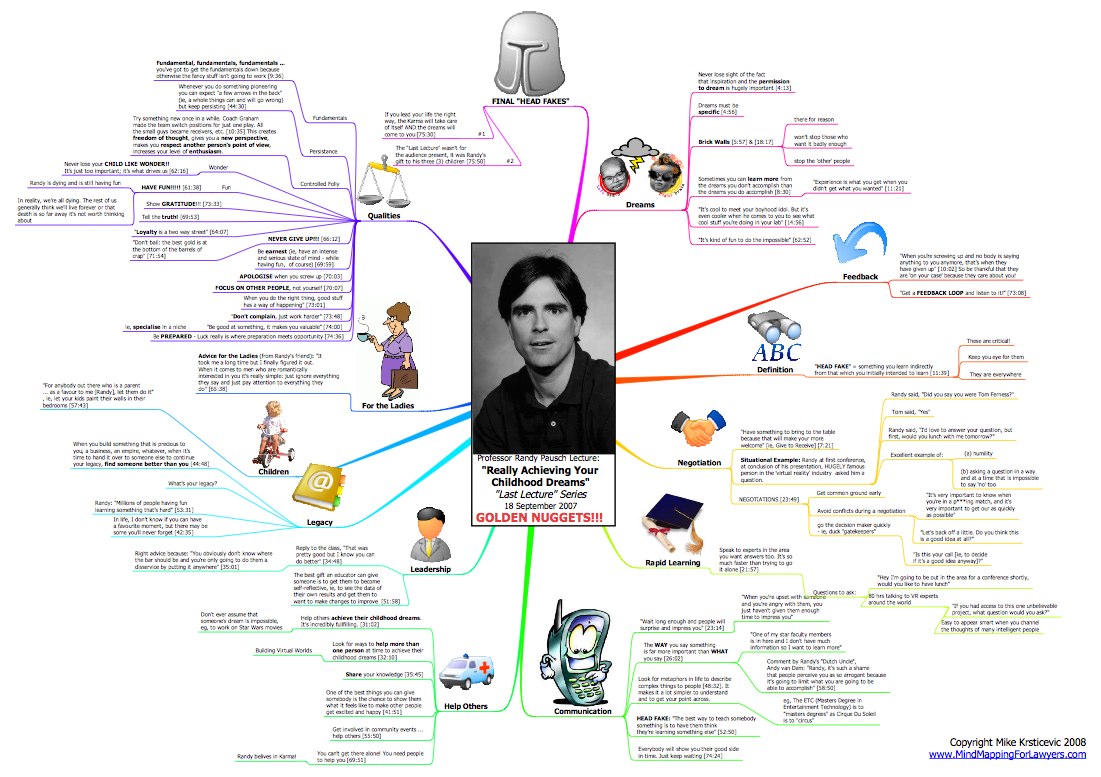
Mindmap of Randy Pausch's Last Lecture

Mike Krsticevic has created a great mindmap based on Randy Pausch’s Last Lecture.  

At the age of only 45 (in Sept 2006), Professor Pausch was told that only 4% of pancreatic cancer sufferers (of which he was now diagnosed as one) lived for 5 years after their diagnosis. At the time of the “Last Lecture”, due to his deteriorating medical condition, Professor Pausch was told his odds had reduced to 3 to 6 months of good health left (at best). 

I have spent 3 hours preparing the mind map for you (including the time spent re-watching the video) and I have learnt so much more by being actively involved. For this reason I strongly recommend that you take the time to read and study the mind map after you watch the video. I believe it will be well worth your time

If you haven’t seen this video, I highly recommend watching this.  It’s about 1:15 long, so watch it over lunch or when you have enough time, but it is truly inspirational.

You can download the PDF from Mike’s site.