About
Randy Krum
President of InfoNewt.
Data Visualization and Infographic Design

Infographic Design

Infographics Design | Presentations
Consulting | Data Visualizations

DFW DataViz Meetup

Join the DFW Data Visualization and Infographics Meetup Group if you're in the Dallas/Fort Worth area!

Search the Cool Infographics site

Custom Search

Subscriptions:


Feedburner

The Cool Infographics® Gallery:

How to add the
Cool Infographics button to your:

Cool Infographics iOS icon

- iPhone
- iPad
- iPod Touch


Read on Flipboard for iPad and iPhone

Featured in the Tech & Science category

Flipboard icon

Twitter Feed
From the Bookstore

Caffeine Poster

The Caffeine Poster infographic

Entries in Marketing (53)

Wednesday
Sep262012

How Much Does SEO Cost?

How Much Does SEO Cost? infographic

How Much Does SEO Cost? is generally a mystery in the online marketing world.  The range is certainly big, from under $50/month up to the unbelievable price of over $250,000/month!  This informative infographic shares the results of custom research from SEOmoz, and was designed by AYTM.

How much does SEO cost? How much time do you have to discuss the various models and prices out there! However, a new survey sheds some light on the subject.

Over 500 people and companies who offer search engine optimization services were asked about how their models. Turns out, it’s most common to charge $100 to $150 per hour, in the US. But by-the-hour consulting is only one of four nearly co-equal ways of charging.

Also popular is project-based pricing, where the average price is between $2,500 to $5,000, in the US. That’s also the same average price for those who buy on a monthly retainer basis. Fixed prices on a contract basis is also a popular way that SEO is sold, but no averages were provided.

The survey was conducted by SEOmoz and compiled into the infographic below by AYTM:

From a design standpoint, there are a lot of things I like about this infographic.  

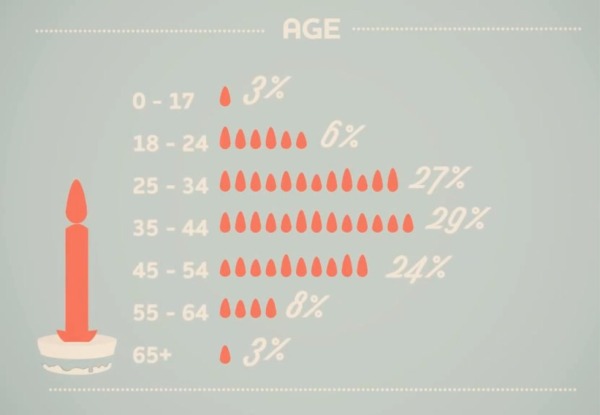
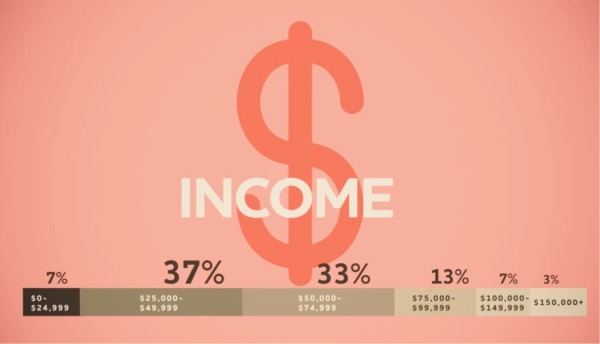
The consistent columns for regions of the world make the layout very easy to follow.  The data is also organized nicely by starting with basic demographic data to provide a foundation to the reader before getting into “The Main Event” - the main research results.

The data visualizations are fairly simple, and very easy for the reader to understand.  I also like the variety of data visualization methods; no one wants to see all bar charts.  The color scheme is also simple, which visually implies a certain level of authority.  By taking complex data and designing simple visualizations, the design shows the readers that SEOmoz has a clear understanding of the content.

The actual values are not included in the design, which is disappointing.  Since this was custom primary research, I have no way to validate the data visualizations without seeing the data, and that reduces the credibility of the entire design.  From a sharing perspective, it’s hard to quote interesting statistics in a text Tweet or Facebook post without having the numbers to work with.

Legends are Evil!  My biggest complaint is their use of legends in a few sections.  In those charts, the colors are visually hard to differentiate, and the reader has to work very hard to understand which pie slice or bar goes with each color.  This is only a problem in the Agency Type and Common Client Types sections.  The rest do a good job of connecting the data labels directly to the visualization.

The footer should include some type of copyright statement, and the URL for readers to find the original infographic landing page.

Found on Visual Loop

Monday
Jul232012

True Colors: What Your Brand Colors Say About Your Business


True Colors: What Your Brand Colors Say About Your Business infographic

Does your companies brand reflect their business correctly? Check out True Colors: What Your Brand Colors Say About Your Business infographic from Marketo.

The most prominent brands in the world are defined by their colors. Think of McDonald’s golden arches, the name Jet Blue, and UPS’ slogan, “What can Brown do for you?” These companies, and many others, strategically use colors in their logo, website, and product to appeal to customers. As a B2B marketer, it’s important to think about how you utilize colors and what the colors you choose say about your business.

Research has found that different colors provoke very different reactions in people. Marketo choose to use the color Purple for branding because at the time Marketo was founded, purple was relatively un-used. Additionally, purple represents wealth, royalty, and richness which also has associations to leadership and revenue. Integrating your brand colors in your logo, landing pages, product, and more will help you achieve the highest impact. We put the rainbow under a microscope to find out how each color can help you connect with your consumers.

Designed by Column Five Media, this is a really good infographic.  The use of the specific colors in question make the design attractive and very easy to follow.  I also like the use of icons to show industries that use the different main colors.  The icons and bullet lists also help cut down on the amount of text the audience has to read.

A couple things I would change: 

  • There are a number of statistics at the top that should have been visualized instead of just making the fonts really big.
  • There are a number of what appear to be quotes from different sources about the power of colors, but the sources aren’t citied.  I assume they’re a part of the sources listed in the footer, but quotes should be immediately attributed.
  • Which Colors are Companies Using Most? adds up to 103%.  It’s not clear if these should be mutually exclusive or if the study counts multiple colors from the same company in the results.
  • The bottom should have a copyright and the URL link to the original infographic landing page. 

Thanks to Carra for sending in the link!

Monday
Jun112012

It's All About The Images

It's All About The Images infographic

Here’s some irony for you. It’s All About The Images infographic from MDG Advertising relays information visually about the importance of relaying information visually.  Yes, it’s very meta.

Some say image is everything, and that’s especially true on the Internet where the shift to visual optimization is playing an increasingly important role in the recent phenomenon of photo marketing. In light of their numerous benefits for brands of all kinds, MDG Advertising developed an insightful infographic that illustrates the influence of images on a company’s business, branding, search, and social media efforts. For insight on optimizing images for content and commerce, along with advice on image optimization techniques, take a look at the following infographic to see why images can help make success a snap.

In our world, this information is true for posting infographics as well as photo images.

Thanks for sending in the link!

Tuesday
May222012

A Marketer's Guide to Pinterest, Video and Infographic

The Marketer’s Guide to Pintrest infographic video from MDG Advertising illustrates this hot new trend with this video that builds on their static infographic Pin It To Win It!

MDG Advertising has produced an engaging video highlighting the facts, figures, and findings from its popular “Pin It To Win It” infographic.

The video details the social site’s demographics, growth, and potential to drive abundant traffic to company websites. Pinterest is especially popular with the most highly coveted markets—about 60 percent are female and 80 percent are in the 25 to 54 age demographic. Plus, Pinterest drives more referral traffic than Google+, LinkedIn, and YouTube combined.

The video goes on to cover the brands, both large and small, on board the pinboard phenomenon, such as Whole Foods, Etsy, West Elm, and Real Simple. These companies reflect the cooking, décor, and crafts interests that are prevalent among the Pinterest audience.

In addition, the video helps marketers navigate Pinterest’s features and terminology by demonstrating the “pin,” “repinning,” and “board.” It also shows how companies can leverage Pinterest for maximum response and referral traffic, whether by improving their image quality or promoting more than just a product line.

Only a couple companies have begun to leverage the research and time put into developing a static infographic, by using that same data to produce an infographic video that reaches a whole new audience.  It’s a very effective way to get the most out of the data research that was already done as part of designing the original infographic.

The most disappointing thing is that whoever did the video production got the data visualizations wrong.  Since when is 6 six times as big as 3?  And 27 only twice as big as 6?


3% and 7% sections of the stacked bar can’t be the same size.  In fact, 3% looks a little bit bigger to make room for the text.


Here’s the original static infographic, Pin It To Win It, where they got the data visualizations correct.  I’m guessing that the infographic designer was not involved in the video production.

Marketer's Guide to Pinterest infographic


Thanks to MDG Advertising for sending in the link!  Also found on Daily Infographic and The Infographic Showcase.

Thursday
Apr262012

The Eagle Scout Infographic

The Eagle Scout infographic is a new design from the Boy Scouts of America, and shows them experimenting with using infographics to share their message.  It’s odd that I can’t find any mention of it on Scouting.org, but found it posted on the Bryan On Scouting blog, which is the official blog from Scouting Magazine, and posted in the official BSA Twitter stream (@boyscouts).  There’s also a high-resolution PDF file available for download if anyone wants to print it out.

My son just bridged over to Boy Scouts from Cub Scouts, and their national office is here in the DFW area, so I was naturally interested.  This is a really good first attempt at an infographic design from their design team, but makes a few mistakes visualizing the data.

  • Good use of the red, white and blue color scheme.  It’s clearly scouting, and specifically related to Eagle Scouts
  • The data being presented is fantastic since only the BSA would have access to many of these statistics.
  • I love the choices of imagery used.  The embroidered patches and icons used for the scouts keeps the design clean and easy to read.  Many BSA publications use a lot of full-color photos of the scouts, and that would have added too much visual noise to an infographic design.
  • The BSA logo at the top clearly identifies this as an official publication, but it’s missing a title.  What should we call this infographic?  Why should I read this infographic?  Something like “100 Years of Eagle Scouts: By The Numbers” would have worked nicely.
  • The information included will change over time since the data is a current snapshot of the state of Eagle Scouts.  2,151,024 Eagle Scouts as of what date?  The infographic should more clearly identify the date that the data is gathered from, because people will be looking at this for years on the Internet.
  • Filling unusual shapes to show percentages is always a challenge.  With images like the hand icon and the globe you can’t just calculate the height of the colored area like a bar chart.  You have to calculate the AREA of the space to be colored, or you end up with false visualizations like these.
  • The same is true for sizing shapes, like the people icons for the Average Age of Eagle Scouts visualization.  You have to size the overall AREA of the shapes to match the data being presented, which is hard with complex shapes.  You can’t just change the height.
  • The space shuttle avoids this issue by only coloring a rectangular shape in the middle, turning it into a stacked bar chart, but the visualization doesn’t match the data.  The red colored section is visualizing more than 60 astronauts as Eagle Scouts, when the number shown is only 40.
  • I love the Eagles by Decade data, but avoid 3D charts.  The 3D effect doesn’t add anything to the data being presented and it’s incosistent with the rest of the design.  The data tells a great story, and clearly shows that Boy Scouts continues to grow strongly and is a viable organization in the 21st century.
  • I like this use of the word cloud for Notable Eagles, but don’t change the font sizes because in infographic design this is assumed to convey data.  With Brave and Loyal in larger fonts, it implies that these are more important than all of the other virtues.  The virtues should all be one, consistent font size, and the names should all be a second font size.
  • At the bottom, there should be a copyright (or Creative Commons) statement, and a URL for readers to be able to find the original high-resolution version. 

Thanks to Dean for sending in the link!

Monday
Apr022012

Interactive Infographic: Coca-Cola vs. Pepsi


The Coke VS. Pepsi: The Cola Wars infographic from cnntees.com. Which side are you on?

For over a century Coke and Pepsi have been at each other’s throats in a constant struggle for a bigger piece of the billion-dollar soda market. 

Along the way the companies have picked up a slew of loyalists and fans, adamant that their cola reigns supreme. While there are countless spots online to check out the history of either company we decided to put together an interactive infographic, putting all cola war highlights together in one spot.

This is a really fascinating experiment with infographic design.  Although it appears to be a static infographic, it’s actually interactive.  If you look closely, there are two videos built directly into the middle of the infographic that play when clicked.  The growth chart at the top is also interactive.  Click on a decade, and then choose the specific year, and it displays events in each companies history related to that time period.

The interactivity is so subtle though, most people will probably miss it without me spelling it out in the title and here in the commentary.

The financial stats section is a really poor use of pie charts in the bottle caps.  The logo images work, but pie charts are for visualizing percentages.  Here, they forced the data into the cute visual, but it makes the data confusing and hard to understand.    Are the charts visualizing the percentages of each expense related to total revenue, or just arbitrarily visualizing the values to represent the comparison between the two companies?  No percentages are shown, and no values are shown for the values of the total pie.  This is forcing a round peg into a square hole.

At the bottom, it’s missing a URL to the original blog post (so readers that find this on the Internet can find the original high-resolution infographic), a copyright statement, a trademark statement and a credit to the designer.

Thanks to Ron for sending in the link!

Wednesday
Feb222012

Tea & Biscuit Dunking Guide

The Tea and Biscuit infographic from Green Hat Design in the UK shows avid dunkers of biscuits the proper timing to keep their favorite snacks in the tea or coffee to conquer floppage and avoid the disappointment of contamination!  Also available as a high-resolution PDF.

This biscuit infographic is based on 8 of our favourite UK brands which helps us (and others) to get the best out of his (or her) biccy when dunking it in hot tea or coffee, while at the same time assisting the user to avoid… floppage. That unfortunate moment that the biscuit suddenly gives way and contaminates your beverage. Nasty. We feel many could actually benefit from such details. I know it has changed my life.

This one is a fun topic.  Apparently the biscuits in the UK are so hard you have to dunk them to eat them…  :)

The radial design works well to show three values for each biscuit, and is easy for the reader to compare them.  The illustrations work well, even though readers in the U.S. (myself included) won’t recognize any of the biscuits.

A couple things are missing from a Marketing Infographic design perspective.  It needs a title!  I made up the “Tea & Biscuit Dunking Guide” because it didn’t have a good title of its own.  There should be some type of license statement, and in this case I would suggest Creative Commons.

The PDF file is hosted on the Green Hat Design site, but the infographic isn’t displayed anywhere.  t’sI hard to share a PDF compared to how easy it is to share an image file online.  It REALLY needs it’s own official landing page on the Green Hat Design site to display the infographic, and be the one place you want everyone else (like this blog) to link to.  They had uploaded it to visual.ly, and I linked to it there, but that shouldn’t be the primary landing page if they want to drive traffic to their site and awareness to their brand.

Thanks to Steve for sending in the infographic!

Wednesday
Oct052011

Social Media Brandsphere

The Social Media Brandsphere is a new collaboration between Brian Solis and JESS3.  The Brandsphere explores how brand storytelling can cross different communication mediums. 

Over on the JESS3 blog, they’ve posted 10 of the different early versions and concepts of the Brandsphere so you can see some of the behind-the-scenes design process at work. 

Social networks and channels present brands with a broad array of media opportunities to engage customers and those who influence them. Each channel offers a unique formula for engagement where brands become stories and people become storytellers. Using a transmedia approach, the brand story can connect with customers differently across each medium, creating a deeper, more enriching experience. Transmedia storytelling doesn’t follow the traditional rules of publishing; it caters to customers where they connect and folds them into the narrative. In any given network, brands can invest in digital assets that span five media landscapes:

1. Paid: Digital advertising, banners, adwords, overlays

2. Owned: Created assets, custom content

3. Earned: Brand-related conversations and user-generated content

4: Promoted: in-stream or social paid promotions vehicles (e.g. Twitter’s Promoted products and Facebook’s Sponsored Stories)

5. Shared: Open platforms or communities where customers co-create and collaborate with brands. (e.g. Dell’s IdeaStorm and Starbuck’s MyStarbucksIdea.)

Any combination of the five media strategies defines a new Brandsphere where or

ganizations can capture attention, steer online experiences, spark conversations and word of mouth can help customers address challenges or create new opportunities. Each media channel connects differently with people and thus requires a dedicated approach integrating tangible and intangible value. Doing so ensures a critical path for social media content: relevance, reach and resonance.


Available as a poster on the Conversation Prism site

Friday
May272011

The Information Blanket

The Information Blanket is a very cool project conceived and produced by Beattie McGuinness Bungay New York.  Intended as a charity blanket to be donated to kids in under-developed countries, the blanket is printed with information to help the mothers learn about their baby’s health.  The blankets include information about breastfeeding, immunization vaccinations, body temperature and warning signs of illness, all printed in the local language.

There are two ways to participate.  You can buy one for yourself, and one will be donated automatically ($60) or you can just donate one to a child Uganda ($25).  The ones you buy for your self are in English (pink or blue), and the ones that will be distributed in Uganda are in Lugandan (green).


the story of our blanket is one of care and responsible craftsmanship. it begins with green-sensitive 100% double knit north carolina cotton. soft and durable, it meets the strictest u.s. environmental standards on dyes and finishing. when it’s ready, the fabric is pre-shrunk and shipped to new york city where local craftsmen cut it to swaddling size and double lock stitch the edges. the informational graphics are then screen-printed using non-toxic water based inks. the result is a blanket of the highest individual quality.

Our design includes a growth chart with average ranges for one, three and six months, breastfeeding and vaccination frequency, high temperature alert, doctors appointment reminder and a list of illness warning signs.


Found on Twitter via @katerryna and Creativity-Online.com

Monday
May162011

Client Infographic: How Affiliate Marketing Works

How Affiliate Marketing Works


Recently, InfoNewt (my company) designed How Affiliate Marketing Works for Internet Marketing guru Rae Hoffman-Dolan and her site: Sugarrae.com.  You can see the high-resolution version here.

After spending over a decade in the Internet marketing industry, I think I often forget – and have failed to address – the most obvious question most folks new to the industry have about affiliate marketing.

When I appeared as a guest on Weapons of Mass Marketing earlier this week to discuss the topic of marketing affiliate programs, the hosts evidenced the importance of the often overlooked question by leading off their interview with a variation of it…

“How does affiliate marketing work?”

No numbers, no statistics, no data visualizations.  This infographic is visualizing a process, and I do many of these for clients.  Business processes, strategies, workflows, business models, flow charts and explanations of how things work.

In this case, characters on a simple path visualizes a process of 10 steps.  Way more interesting than a text numbered list in a blog post don’t you think?

You should follow Rae on Twitter: @sugarrae