About
Randy Krum
President of InfoNewt.
Data Visualization and Infographic Design

Infographic Design

Infographics Design | Presentations
Consulting | Data Visualizations

DFW DataViz Meetup

Join the DFW Data Visualization and Infographics Meetup Group if you're in the Dallas/Fort Worth area!

Search the Cool Infographics site

Custom Search

Subscriptions:


Feedburner

The Cool Infographics® Gallery:

How to add the
Cool Infographics button to your:

Cool Infographics iOS icon

- iPhone
- iPad
- iPod Touch


Read on Flipboard for iPad and iPhone

Featured in the Tech & Science category

Flipboard icon

Twitter Feed
From the Bookstore

Caffeine Poster

The Caffeine Poster infographic

Entries in Marketing (53)

Friday
May302014

What Makes the Perfect Blog Post?

What Makes the Perfect Blog Post? infographic

What Makes the Perfect Blog Post? infographic from blogpros.com takes information gathered from 100 highly ranked blog posts and puts it together so we can learn from those best practices.  Even though the infographic can stand on its own, it was published as a companion piece to a much more detailed article.

Always interested in what goes into the best content we can publish, we recently performed an analysis of 100 top blog posts across a number of popular sites, including Forbes, Mashable, KISSMetrics and SearchEngineWatch. The data speaks for itself, but the conclusions are up to you. What do you see in the data? Here’s what we think.

The simple color palette makes the data visualizations very easy to read.  Some of them are very well know publishing tips like providing social sharing buttons and including images.  I don’t believe that the number of characters in a title has any bearing on its success, but good titles are very important.

I don’t know if any of these factors had any influence on whether these blog posts were popular or not.  These are purely observations by the designer and may be considered to be correlated instead of causing blog post success.

Tuesday
May132014

Marketing FAIL: Infographics Hidden Behind Registration Walls

There’s a growing marketing practice that I think is a huge marketing mistake. I’ve seen a number of infographics being published by companies that require the reader to enter their name, email address and other contact information before they can even view the design. This “registration wall” is a way for marketers to gather the contact information from the readers so they can send out additional marketing emails later. In my opinion, publishing an infographic behind a registration wall just doesn’t make any sense.

Here’s an example of what you might see on one of these registration wall pages:
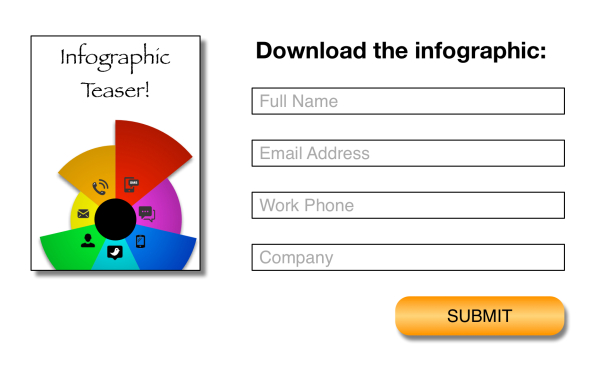
Infographics Registration Wall Fail Example

I completely understand putting valuable content behind a registration wall as a method to capture the contact information from potential leads. I get it.  Assuming the hidden content is closely related to the company’s business, the audience interested in that content is likely to represent a pool of potential customers. If they’re willing to give up their valuable email address to gain access to that content, they are probably a fairly strong potential customer (or a competitor checking out your valuable content!).

However, infographics are the wrong type of content to use for this purpose. The companies I see that are hiding infographics behind registration walls are missing the benefit of infographics, which is to deliver easy to understand information to the audience in a format that’s also easy to share because it’s completely contained within the image file.

First, online infographics are meant to be shared. Infographics are popular online for two reasons, easy to understand information and easy to share. Much easier than text articles or blog posts. As soon as one reader shares the hidden infographic image file on their blog or posts it in social media, the infographic is released to the public and available to everyone without registering. Even if you ask people not to share it publicly, the accepted practice online is to freely share infographics.

Second, the research commissioned by Janrain from 2012 indicates that 86% of people may leave a website when asked to create an account. Most of the audience will just leave instead of going through with the registration process to gain access to the infographic. They never see the infographic, never read the data and never hear the message. 
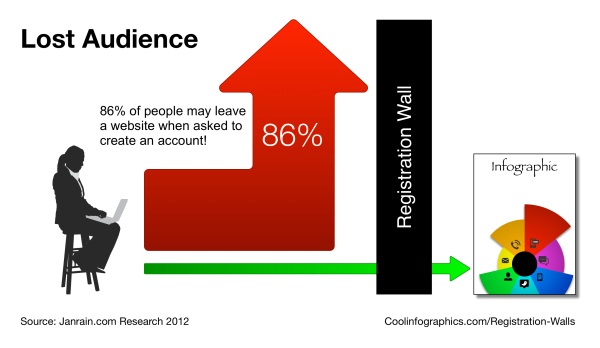
Lost Infographic Audience

Third, the search engines can’t see past the registration wall. No keywords, no meta-data, no text. The search engines can’t index the content behind the registration wall, so your infographic won’t show up in search results. Only the short, publicly accessible teaser information on the registration page has any chance of being indexed to appear in results.

Here’s what I recommend. Use a compelling infographic as a top level summary of the more detailed content you put behind the registration wall. All of the people that share your infographic, are effectively advertising your more detailed information. You could even make the infographic landing page on your website also the registration page to get more information.  

This way the infographics are available publicly to view and share, and the free content draws in readers to the registration page. The truly interested readers will also give you their contact information to gain access to the more-detailed report or white paper that you have available behind the registration wall.  Now you have built your brand credibility with a widely shared infographic, and you have gathered a pool of potentially valuable leads.

For more statistics and information about registration walls, check out The Registration Challenge infographic from Janrain:

The Registration Challenge infographic

How to Solve the Online Registration Challenge infographic published by Janrain in 2012.

How often have you become frustrated filling out online registration forms? There is a better way. Janrain has compiled data on some of the most challenging aspects of online registration forms and simple solutions to improve the user experience…and conversion rates.

Wednesday
May072014

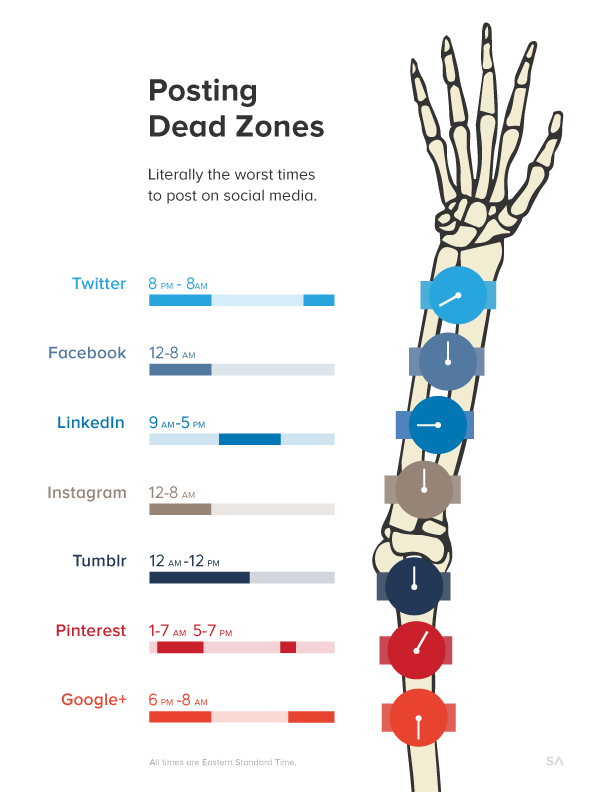
The Dead Zones: When Not to Post on Social Media

The Dead Zones: When Not to Post on Social Media infographic


The Dead Zones: When Not to Post on Social Media infographic from SumAll takes a look at the the worst times to post content on social media.

Now that everyone knows the best times to post on social media – and if you don’t, take a look at our infographic for a refresher–we started thinking about the flip side to the golden hours: the dead zones.

We researched what hours of the day your post will be seen by the fewest number of people and collected them all into this infographic. Beware.

Tell one story really well is one of the keys to a successful infographic, and this design does just that!

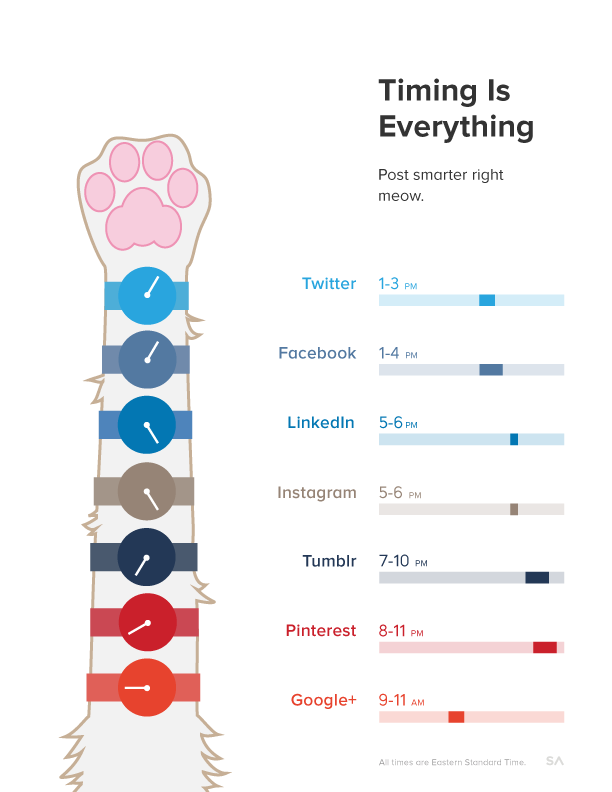
Here’s their prior infographic about the BEST times to post for comparison:

BEST times to post on social media infographic


Thursday
Apr242014

Smart Ways to Combine Content Marketing With SEO

Smart Ways to Combine Content Marketing With SEO infographic

The Smart Ways to Combine Content Marketing With SEO infographic is essentially a big list of the most popular online services in a number of different categories.  Published by blogmost, it’s meant as a reference tool for Marketers to help plan out their content strategies.

Trying to build High Quality Links without paying anyone? This infographic reveals techniques to build them and complete details of good website + mentioned Great SEO & SMO tools for better Marketing.

No data or numbers, the most prominent sites and companies are shown for 26 different online service categories.  The randomness of circle sizes appears to visualize some type of information, but there’s no data behind them.  It’s just the designer sizing them to fit the different logos and icons.

The design does a fantastic job of using logos and icons in place of text.  This makes the overall design faster and easier for the audience to read through.  It’s a much more enjoyable experience than reading the text name of all the different companies, brands and sites.

Some description at the top would be helpful to describe how the sites were chosen for readers that find the infographic on other sites.  The URL of the infographic Landing Page on the blogmost site in the footer would also be helpful for the readers to be able to find the original full-size version and associated text.

Found on Visual.ly

Wednesday
Apr232014

11 Essential Ingredients Every Blog Post Needs

11 Essential Ingredients Every Blog Post Needs infographic

If every blog followed the 11 Essential Ingredients Every Blog Post Needs in this infographic, they would be much more successful. From opening with a bang to killer bullet points, this infographic uses intriguing words to increase the uniqueness of it’s take home message. Created by copyblogger.

So. You think you’ve got yourself a good blog post.

You chose your writing style. You knocked out the first draft. You allowed it to sit for an hour or a day.

Now it’s time to edit that bad dog — ruthlessly. So that it has a fighting chance in the trenches.

You’ll want to pay attention to the details like avoiding goofy, but common,grammar mistakes. You’ll want to choose your words carefully so you say what you mean.

This will allow you to shed excess copy so that you have a lean, muscular article.

But you’re not done. You also must ensure that your blog post has all of the essential ingredients it needs.

Ingredients like these, as presented in this infographic by our lead designer Rafal Tomal. Print it, pin it, but whatever you do … use it.

No numbers or data, but this well-designed infographic clearly walks the reads through a sequence of tips for blog post writing.  Illustrations help relate to each point, and make them more memorable, but I don’t understand a few of them (Why does an alien UFO abduction represent a good subhead?  I would have like to see some statistics to back up why there are good blogging tips.

Yay!  The URL in the footer takes readers straight to the infographic landing page on the copyblogger site, which makes it easy for everyone to find the original infographic and the supporting article.


Found on Google+ and Reviews N Tips

Monday
Apr212014

Choosing a Social Media Platform

Choosing a Social Media Platform infographic

Released about a year ago, the Choosing The Most Effective Social Media Platforms infographic was published by Edge Media and designed by Infographics.SG.  Photos, video, articles or text?  Depending on the type of content you are generating, your choices for effective social platforms are different.

Facebook, Twitter, Pinterest, Google+, LinkedIn. Etc. So many social media platforms. And so little time. (And manpower. And ideas.) 

There are costs involved to maintaining a social presence. It is vital for brands / companies / organisations to market on the right platform(s) in order to optimize their resource allocation. 

Use this infographic to help you choose the most efficient social media platform(s) according to factors like your goals, target audience and capabilities.

 The design includes a good mix of data visualization methods and the bold colors are eye catching to the audience.  However, some of the charts are difficult to understand.  The polar grid used for the “What Do You Aim To Achieve?” section does not clearly communicate the information to the readers.  I also the the colors should have been color-coded to be relevant to the specific social media brand colors. 

They also leveraged the infographic content into a SlideShare presetnation.  This allows them to utilize the content they already created on another social platform to reach a different audience.


Thanks to Brian for posting on Google+

Friday
Dec062013

29 Powerful Tools for a Social Media Marketer

29 Powerful Tools for a Social Media Marketer infographic

A Productive Day in the Life of a Social Media Marketer from Razor Social is a great use of an infographic design within a larger content strategy online.  The larger piece is an article that lists out all 29 tools, with links and descriptions, but the infographic shows a character using all of the tools throughout the day.  So the infographic grabs the attention of the audience and gets shared frequently, with links back to the full article.

The demands on us to market our products and services using social media is constantly increasing and the technology/tools required to support this is also increasing.

We start early morning and we finish late at night.  How many of you check your Twitter or Facebook account last thing in the evening and first thing in the morning?

So we thought it would be a good idea to take a look at a very busy day in the life of a Social Media Marketer.  During the  day there are so many tools and tasks.  If you work alone then we certainly wouldn’t expect you to do everything listed here or use all the tools we suggest, but if you are part of a team then you could share out the tasks and tools to make it easier.

A special thanks goes to Donna from Socially Sorted who is my go to person when I want anything visual done.  Thanks Donna.

The infographic design does a good job of removing most of the text descriptions and just using icons and logos to represent the various tool.  Interested readers can dig into the full article for more information.

The footer is missing the URL link back to landing page with the article.  When people post infographics on blogs and social media sites, they aren’t always good about linking back to the original.  By including the text URL in the infographic itself, you can make sure all of the readers can find the landing page.

Friday
Nov292013

Seven Myths of Email Marketing

Seven Myths of Email Marketing infographic

The Seven Myths of Email Marketing infographic from Alchemy Worx addresses many of the misconceptions about email marketing head on.

Many beliefs that email marketers hold true regarding email are simply false, according to research and analysis conducted by my email marketing agency, Alchemy Worx. We analyzed data sourced from our work with customers and industry figures to arrive at our conclusions.

Here are seven such email myths, which are also presented in an infographic at the end of this article.

Great information with fun illustrations that attract viewers.  The statistics should be visualized though, instead of just shown in text.  Big fonts are not data visualizations, and don’t make the data any easier to understand for the readers.

Footer has good information with full links to the sources, a clear copyright and the company logo.  It’s only missing the URL link back to the infographic landing page so readers can find the orignal when people post it without a link back to the Alchemy Worx site.

Thanks to Christine for sending in the link!


Wednesday
Nov132013

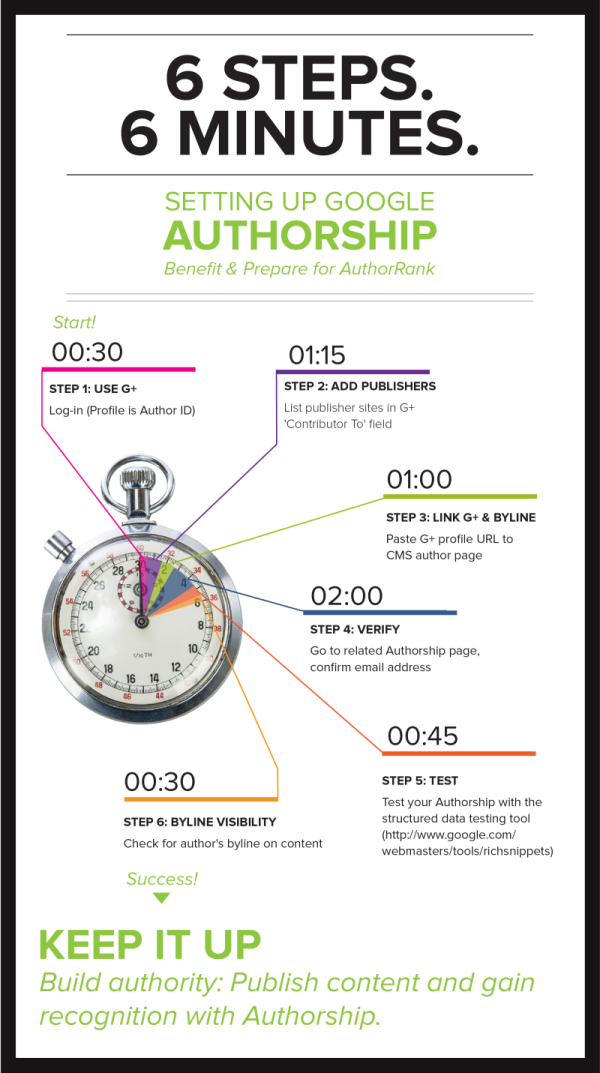
How to Setup Google Authorship in 6 Minutes

How to Setup Google Authorship in 6 Minutes infographic

How to Setup Google Authorship in 6 Minutes is simple, clear, focused design from Brafton.

Google Authorship helps brand publishers personalize the custom content they post to their websites. Studies show that including an author’s byline and headshot in search engine results pages (SERPs) increases clicks and may eventually improve PageRank. 

Brafton’s “Content marketing, meet Authorship” resource outlines everything a savvy marketer must know to benefit from Google technology, and our accompanying infographic makes it even easier to setup Authorship on a given site. (Our downloadable resource includes a print-friendly version of this graphic!) Follow these six steps (in about six minutes) to be on your way to publishing online content using Google Authorship. Don’t forget to read our related blog: Why It’s Time to Embrace Authorship, and download our free resource.

This infographic design keeps it simple for readers by telling one short story really well.

Knowing that the PNG image file of the infographic will be shared on other sites, the design should have included the Brafton logo, a copyright statement, and the URL for readers to follow to find the original, full-size version of the infographic.  Not all bloggers are good about linking back to the original landing page.

Tuesday
Oct012013

The Rise in Mobile Video

The Rise in Mobile Video infographic

The Rise in Mobile Video from Digital Surgeons takes a look at the confluence of data behind the growth of mobile devices and the growth of video content made for those mobile devices.

Mobile video offers brands a new and interesting way to interact with it’s customers. It’s not about the platform, it’s about telling engaging stories and connecting with audiences.

We took all of that pesky research around the current state of mobile video and condensed it into a beautiful infographic. It’s our pleasure to present the Rise of Mobile Video Infographic.

They have gathered some fantastic data together in this infographic, and the data tells a great story.  The simple color scheme is easy on the eyes, and the use of icons and logos for the different device brands helps to reduce the text.

However, the design is visually noisy, and hard for the readers to follow.  Here are a few tips that could make this infographic great:

  • Big fonts are not data visualizations.  If you want your audience to understand the data, the design needs to visualize it to put the value into context for the reader.
  • Values not visualized are perceived as being less important.  Readers are skimming the infographic because they expect an infographic to make the data fast and easy to understand.  Usually they will skip the text and look at the visuals first.  This means that any values not visualized are skipped when the readers are skimming.
  • Streamline the path of information.  An infographic should walk the audience sequentially through the data, building up the conclusions.  In this design, the major sections move top-to-bottom, but within each section is a random placement of statistics.  Some are side-by-side and some are top-to-bottom.  It’s hard for the reader to understand where to move next after each statistic.  A clean, linear flow would be easier to read.

Thanks to Alex and Peter for sending in the link!