About
Randy Krum
President of InfoNewt.
Data Visualization and Infographic Design

Infographic Design

Infographics Design | Presentations
Consulting | Data Visualizations

DFW DataViz Meetup

Join the DFW Data Visualization and Infographics Meetup Group if you're in the Dallas/Fort Worth area!

Search the Cool Infographics site

Custom Search

Subscriptions:


Feedburner

The Cool Infographics® Gallery:

How to add the
Cool Infographics button to your:

Cool Infographics iOS icon

- iPhone
- iPad
- iPod Touch


Read on Flipboard for iPad and iPhone

Featured in the Tech & Science category

Flipboard icon

Twitter Feed
From the Bookstore

Caffeine Poster

The Caffeine Poster infographic

Entries in social media (74)

Friday
Feb222013

Top 250 Internet Retailers Q3 2012 Update

Top 250 Internet Retailers Q3 2012 Update infographic

Top 250 Internet Retailers Q3 2012 Update infographic from the Campalyst blog

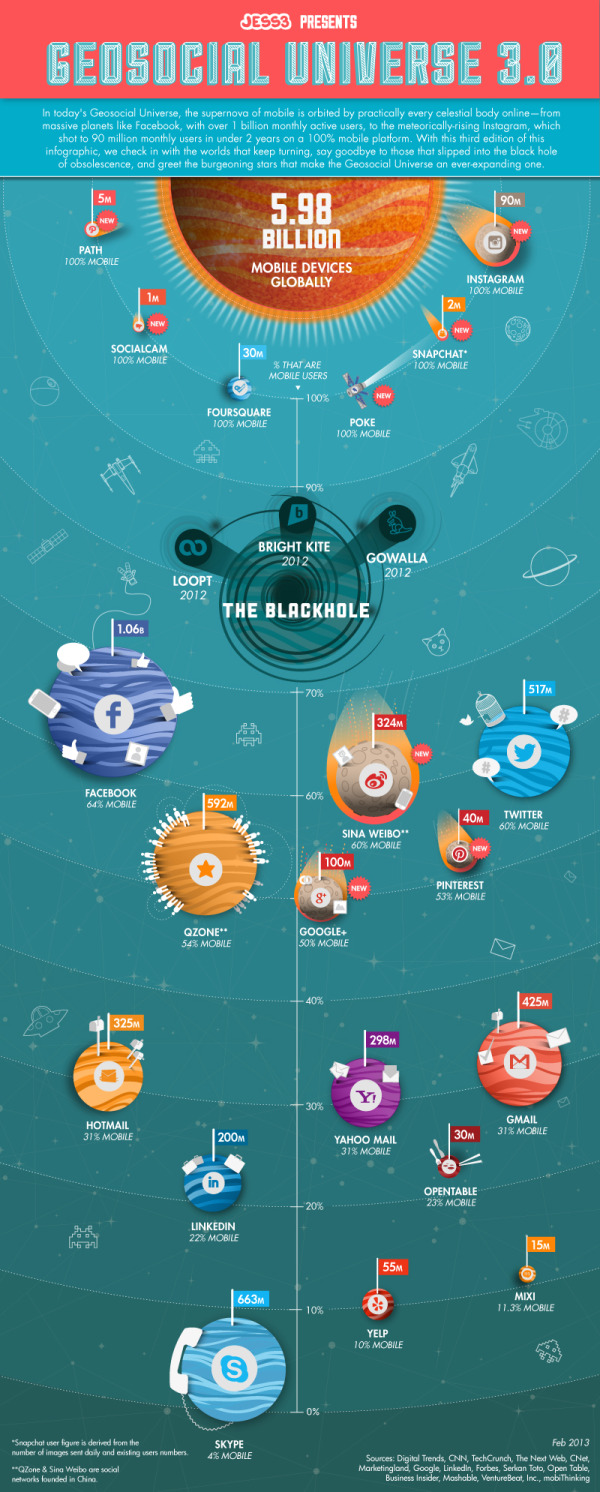
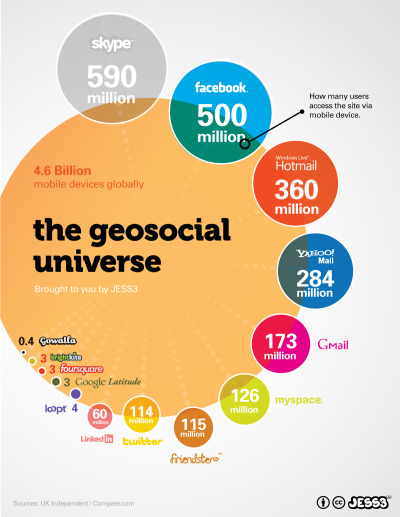
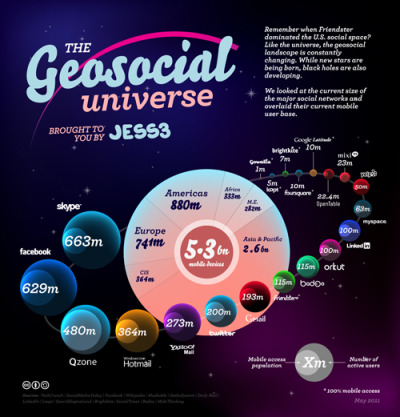
Back in May we published an infographic about Top 250 Internet Retailers’ presence on social media. The infographic was perceived really well by our readers, customers and the media; thanks a lot to all the people sharing it on Facebook, Twitter, Pinterest and their blogs!

Now we are happy to present you with the Q3 update! Spoiler: those were two incredible quarters for Pinterest! Amazing growth in terms of the number of brands building their presence on Pinterest and the size of their communities!

I like the color scheme and the variety of data visualizations used in this infographic.  Bars, icons, arcs and proportional circles.  The use of the Internet retailer logos in the circles is especially effective.

I wish the Social Media site logos had been used, especially in the first three sections.  I shouldn’t have to read the text and match the color to figure out what the visualization represents.  That’s too much work for the reader.  How many people does each of the people icons represent in the “How Many Followers Do They Have?” section?  The lines look “relatively right”, but the number of icons seems to have no relationship to the actual numbers shown.

The footer needs both a copyright statement (or Creative Commons license) and the infographic landing page URL so readers can find the original when they see this posted on other sites (like this one!).  Many bloggers are not good about linking back to your original site correctly, and you want your audience to be able to find it easily.

Found on Fresh Peel and Visual Loop


Wednesday
Feb132013

The Geosocial Universe 3.0

The Geosocial Universe 3.0 infographic

Last week design firm JESS3 released The Geosocial Universe 3.0, an update to their prior infographics about the size of the major social media networks.

In a time not so long ago, in a galaxy not so far away, a little phenomenon was born that united the people of cyberspace through geographic services and social networking.

With changes to the social landscape occurring at lightspeed, JESS3 presents its third iteration of The Geosocial Universe, charting the latest monthly active user data for various social networks, along with the percentage of users who access each network via mobile devices.

Take a look below to discover more about the ever-expanding geosocial universe and the course of its objects.

I really like the changes to this version of the design.  They kept the same philosophy of relatively sized circles to represent each of the main social networks.  However, I’m confused by the placement of the Black Hole on the vertical scale meant to represent the percentage of mobile users.  Why does more mobile users place a network closer to the Black Hole of Obscurity?  It’s placement around the 80% mark visually implies that has meaning, but I don’t think that was the intention of the design.  Is Facebook close to obscurity?

Both a copyright (or Creative Commons) license and the URL to the infographic landing page are missing from the design.  You want readers to be able to find their way back to the original when they find the infographic posted on other sites.

This is an update to the original design from 2010:

And version 2.0 in 2012:

Tuesday
Feb122013

Breakdown of A Person's Google Results...and How to Look Better

Breakdown of a Person's Google Results: How People Look in Google- and How to Look Better infographic

When you type your name in Google, what comes up? Hopefully nothing negative. The Breakdown of A Person’s Google Results: How People Look in Google - and How to Look Better infographic from brandyourself.com tells you which of your profiles are going to show up higher in google. If your personal image needs a boost, use BrandYourself, a free website that allows you to create a positive image of yourself and land it on the top page of the Google search.

At BrandYourself, our goal is give our users and readers everything they need to put their best foot forward in Google.  Since we track the Google results of over 130K users we were able to analyze millions of results and found some really insightful information.

Want to look better in Google? Think twice about building your personal website on WordPress.

  • Bad First Impression: 1.5 Billion names are Searched everyday in Google but people generally don’t look great on their first page
  • If you want to look better, you need to choose your profiles wisely: For example, LinkedIn is the best social network for rankings, while WordPress is the highest ranking personal site builder. Even more interesting, popular pages like about.me really have trouble ranking high.
  • BrandYourself is effective: To date, we have helped people raise their favorite profiles over 250K positions higher in Google. People can expect to raise a profile over 20 positions, or 2 whole pages, by using our software. We are very proud of this.

We know not everyone loves looking at data as much as we do, so we put it in fun infographic form so you can enjoy it too. Let us know what you think!

This is a great informational design that shares some really valuable information.  I can attest to much of the information, and have the advantage of owning all 10 results on Google if you search for “Randy Krum”.  Go ahead…try it!

A couple recommendations I would make to improve the design:

  • There doesn’t seem to be a higher resolution version available, so some of the font sizes are too small to read.  Especially the Sources list and the design credit.
  • There’s some good data and values in here that would make a better impression if they were visualized
  • There should be a URL to the infographic landing page in the footer, so readers can find the original

Thanks to Patrick for sending in the link!

Tuesday
Feb052013

How to Find A Missing Child Using Social Media

How to Find A Missing Child Using Social Media infographic

Find Your Missing Child is a new infographic design by the team at JESS3.com for FindYourMissingChild.org.

Find Your Missing Child (FYMC) was founded after social media and email helped successfully find one missing child.  FYMC’s goal is to educate families about the community-building powers of social media and email to help in the search for a missing child.

The design does a good job of walking the reader through the statistics and benefits of engaging with social media as a tool in the search for a missing child.  The path provides a clear sequence of information for the readers to follow.

Some of the statistics are impressive, and would make a bigger impression on the reader if they had been visualized.  Big numbers are not data visualizations, and many designs make the mistake that using a big font makes the numbers more impressive.  An infographic should put those values into context for the reader by visualizing them.

In the footer, the URL to the infographic landing page is missing and would be helpful to readers that want to find the original full-size infographic.

Thanks to Jarred for sending in the link!

Tuesday
Jan292013

How Social Sites Make Money

How Social Sites Make Money infographic

The number of social media followers are growing. But how do the sites make a profit? How Social Sites Make Money infographic from usbundles.com tells you which social media websites make money with ads, or paying customers, or mobile apps, or affiliates.

We turn to social media services to stay connected more and more each day. But even with hordes of devoted followers, how do these social sites manage to turn a profit?

Here’s a quick look at which revenue streams help major social networking companies go from social service to successful business.

Nice use of a Venn Diagram.

The doughnut charts aren’t accurate.  Like the designer eye-balled them instead of doing the calculation.  For example, the 71% doughnut is actually visualizing a value of 66.6% (2/3).

Found on http://socialtimes.com/how-social-sites-make-money_b91551

Tuesday
Jan082013

The Ultimate Complete Final Social Media Sizing Cheat Sheet

The Ultimate Complete Final Social Media Sizing Cheat Sheet infographic


The Ultimate Complete Final Social Media Sizing Cheat Sheet by LunaMetrics is a huge (and very long) informational infographic that shows the readers all of the important image sizing requirements for the major social networks.

In June of this year, we published an infographic listing all of the sizing information for images on Facebook, Twitter, Google+, and Pinterest. It was a wildly successful piece of content, totally blowing our expectations out of the water. Unfortunately, while its popularity has flourished, nearly every social network instituted changes to their image sizes, rendering most of the information on the infographic out of date.

We knew we needed to update the information on the cheat sheet, but we weren’t comfortable with simply adjusting one or two figures on the blog post and leaving it as-is. We’d also received a lot of feedback, both on the design and information it contained. We decided to redesign the entire sheet and incorporate a few more social networks.

We also decided to permanently redirect the old sheet here, so that shared tweets, pins, likes, and so on, would lead to the correct sizing dimensions. Additionally, as sizing changes are implemented across social networks, we’ll actively update this sheet – meaning that if you use the embed code at the bottom to share this sheet on your own site, the image will automatically update with changes as they are rolled out. No more out-of-date information.

I love that all of the sizes are shown in correctly proportional rectangles!  Based on their claim, this infographic should also update correctly as they revise it to match the ongiong changes from all of the social networks.  

Some color of the official logos of the different social media networks at each section break would have been helpful to the reader.  The light typeface used at each section break is hard to distinguish from the rest of the design.

Found on Social Media and Social Good

Thursday
Nov292012

40 Must-See Modern Marketing Charts

40 Must-See Modern Marketing Charts

Eloqua has teamed up with infographic design firm JESS3 again to create Modern Marketing Insights, a series of 40 infographics using big data analysis that can help marketers anywhere.

Did you know that dynamic content can improve conversions by 50%? Or that emails sent on a Saturday get the highest number of click-throughs? Were you aware that when influencers share your content on social it can result in a dramatic increase in traffic and conversions?

That’s why we produce a chart every week that modern marketers can easily learn from and use. And it’s why we’ve gone back with our friends at JESS3 to reproduce the most indispensable data points, coming up with 40 understandable, actionable charts. Wide-ranging in scope, the charts hit the most important topics hitting marketers today – from social media to email.

With that in mind, we offer the charts in two forms. You can head over to the custom-made website and explore the charts by topic, getting to the data that matters most to you. Or you can download all 40 charts in a free eBook. It’s well worth keeping near your desk.


40 Must-See Modern Marketing Charts

Even those each of these is only exploring one data set, these are actually good infographic designs that follow some important design rules.

First, each one tells one story really well, and the Key Message is easy to understand.  Most readers of infographics are only looking at a design for less than 5 seconds, and a good infographic design will successfully communicate their primary message in that short time.

Second, each design is easy to share.  Each of the 40 designs has it’s own landing page on Eloqua’s site, and their own dedicated social media sharing buttons.  This is fantastic for SEO, and much easier to utilize the information for users.  So, if you’re interested in a data set about email to customers, you can share that information with colleagues without also sharing a data set about Pinterest.

You can read more about the series on the Eloqua blog.


40 Must-See Modern Marketing Charts

A couple things I do think are missing from each design that would help Eloqua in the future.

  • Since these are being shared individually, the URL back to the original on Eloqua site should be included in the image.
  • A copyright statement to clarify usage rights.  Does everyone have permission from Eloqua to include these charts and data in their own presentations?
  • Much of the data is proprietary to Eloqua, so the raw data behind the designs isn’t available to the public.  It would be great for Eloqua to make the data behind each chart available publicly (like in a Google Docs spreadsheet) since they are making the data public in the charts.
  • A conclusion.  I think the subtle implication is that companies should call Eloqua for help using this information, but a short statement suggesting what action companies should take based on each data set would close each design nicely.

Thanks to Jarred for sending in the link!

Monday
Nov262012

What Makes a Travel Writer?

What Makes a Travel Writer? infographic

For those who would love to travel and write, the What Makes a Travel Writer? infographic from hotelclub.com is the infographic for you. This infographic covers the ages and careers of these writers, and also what technology they use.

If you’ve ever wanted to become a travel writer, you’ve probably wondered about the tools and resources the pros use to make their jobs possible. The trade secrets of those who successfully turn international adventures into paychecks are an enticing mystery. Does the key lie in social networking? Is it finding the right technology that makes all the difference? Or have these professionals stumbled onto some obscure websites that the rest of us are ignorant about?

Unfortunately, there isn’t one explicit answer that will transform you into a travel writer overnight. It is a combination of all of these things that enable the professionals to do their jobs well enough to afford a warm meal and their next plane ticket.

So to gain some insight into the tricks of the trade, and hopefully get you one step closer to your dream job, we surveyed some of the best travel writers on the web about their working habits. We got the scoop on Twitter from three of the most ‘Followed’ travel tweeters in the business (@Paul_Steele@TravelEditor, and @DaveDTC); found out that Paris and NYC are two of the best places in the world to find (marketable) inspiration; and were warned against going any where near Birmingham or Malaga.

Find out what else we learned in our detailed infographic.

I really like this design.  I like that the infographic keeps the same, simple color scheme throughout to match the colors in the header. However, it lacks a border or a background color to help frame the infographic on a webpage with a white background.  The white background creates uncertainty of where it actually ends.

Most of the information is in percentages; however, it is all conveyed in different visual formats.  The stacked bars, pie charts and doughnut graphs correctly show them in comparison to the complete 100%.  The partially shaded shaped of film canisters, people icons and the world map aren’t quite correct.  The readers see the area colored of an object, and because of the odd shapes the designer had to guess the correct shading by just changing the height.  It’s close, but not actually correct.

A few other suggestions I would make:

  • The two age groups compared with the man & woman icons aren’t related to each other, so the comparison isn’t helpful information.
  • For the Male-Female comparison comparison in Travel Career, the icons need to be the same width for them the be accurate.  Visually it looks like 75% is at least double 53%, which obviously isn’t true.
  • The Tablet Brands statistics of “100% of male travelers use Amazon Kindle” isn’t support by the data to the left, and is a highly unbelievable stat.  
  • When lining up rows of icons, like in Blogging Platforms, the design should always use rows of 10 icons.
  • I’m sure the last circle in the Twitter Usage section was supposed to be <100 Twitter followers instead of >100.
  • There should be a URL at the end of the infographic linking to the original full-size version.

Thanks to Ally for sending in the link!

Tuesday
Nov132012

Which Social Networks Take Home the Gold?

Which Social Networks Take Home the Gold? infographic

How popular is your favorite social network?  It is important to know if it is on the rise or decline because well, what is the use of a SOCIAL network with no one on it?  See which are on the rise and some interesting facts about who is on which social network with mashable.com’s Which Social Networks Take Home the Gold?

We love the Olympics, but an international social media showdown is a little more our speed.

Ignite Social Media is back with the 2012 Social Network Analysis Report, breaking down demographic, geographic and search data that shows which networks are the underdogs and which are mounting the winners’ podium.

Here at Mashable, we can’t get enough GIFs and hashtags. We’re excited to see that this type of digital currency is gaining value — Twitter and Tumblr are among the top five networks with the strongest rate of growth.PinterestReddit and LinkedIn round out the pack.

Launched just over a year ago, Google+ was included in the report for the first time this year but is notably absent from the list of fastest growing platforms. And while Facebook is actively continuing its quest for world domination, it’s hard to improve your growth rate when practically everyone’s already joined the club.

Check out the graphic below, with data based on a report from Ignite Social Media. It also features statistics about men versus women, the youngest skewing networks and which sites are luring in the whiz kids. The researchers at Ignite point out that social network search interest continues to remain stagnant, as it has since 2009.

The timeline trend charts are especially effective showing the rise (and fall) of many of the most popular and well-known networks.  Even though these are “simple bar charts”, they are incredibly effective in making the data easy to understand to the readers.  Although its explained in the footer, it would have been better to explain the  y-axis unit of measure along with the charts.

Found on mashable.com

Thursday
Sep202012

Is Google+ a Ghost Town?

Is Google+ a Ghost Town? infographic

Google+, The newest trend? Or the newest flop? Umpf gets to the bottom of this mystery with a little research and reports it’s results with an infographic! The Google+, Ghost Town? infographic does more than just report the Google+ statistics, it compares them to other key social networks.

There’s been many articles written about how good, bad and indifferent Google+ is.  But our favourite debate is the ongoing It’s Really Popular Vs It’s A Ghost Town one.

So what’s the truth?  Our findings and infographic (see below) appear to suggest the latter: despite its large number of accounts, G+ is bottom of the list of social network users’ favoured channels.

Google, of course, claims it is fast-growing and really popular.  Why wouldn’t they? And, of course, there is research to support that argument. But does this chart, left, for example, which shows the rise in G+ unique visitors, tell the whole truth?

So, we decided to do our own research.  It is by no means exhaustive and is only meant as a snapshot view, so judge for yourself.

Certainly a trending topic lately, but also a really good infographic design.  Of course it’s framed in a Google+ news feed style layout.  Easy to read and colorful.  I like the color coding related to the different social network logos, even though some of those blue colors are hard to differentiate.

In the Users bar chart, I love the use of color, putting the data right in the bars and using the logos on the axis to eliminate any need for a legend.  Good data visualizations design!

In the “Users Likely to Share” I would have liked to see some sizing of the icons to match the data. Instead, they put the icon illustrations into rank order, continued the consistent color coding and clearly identified 1st, 2nd, 3rd, etc.

The section with all of the doughnut charts (reminiscent of the Google+ Circles icon) also continues the consistent color coding.  I’m sure it a rounding issue, but many of the charts only add up to 99.9% instead of 100%.

At the bottom, the two things missing are some type of copyright license as well as the URL linking back to the original infographic landing page.

Thanks to Jon for sending in the link!