About
Randy Krum
President of InfoNewt.
Data Visualization and Infographic Design

Infographic Design

Infographics Design | Presentations
Consulting | Data Visualizations

DFW DataViz Meetup

Join the DFW Data Visualization and Infographics Meetup Group if you're in the Dallas/Fort Worth area!

Search the Cool Infographics site

Custom Search

Subscriptions:


Feedburner

The Cool Infographics® Gallery:

How to add the
Cool Infographics button to your:

Cool Infographics iOS icon

- iPhone
- iPad
- iPod Touch


Read on Flipboard for iPad and iPhone

Featured in the Tech & Science category

Flipboard icon

Twitter Feed
From the Bookstore

Caffeine Poster

The Caffeine Poster infographic

Entries in social media (74)

Monday
Sep232013

The Ecosystem of Linkedin

The Ecosystem of Linkedin infogrpahic

LinkedIn has reached over 200 million members worldwide, making it the world’s largest professional network. The Ecosystem of LinkedIn infographic from Dynamic Search explains why LinkedIn is a must have tool for everyone.

The Ecosystem of LinkedIn includes how LinkedIn works and what you should really know. What’s the difference between endorsement and recommendation? What about job search,  personal or company profile, groups and connections? Below is the infographic that will simplify LinkedIn for you. Are you an employee or business owner? If so, you should have a profile on LinkedIn. Enjoy.

This design does a good job of using illustrations and diagrams to add a visual element to abstract concepts like connections and recommendations.  The text descriptions could have been simplified even further to remove more text from the design.

The footer should have included a copyright or Creative Commons license, and the URL link back to the landing page so readers could find the original, full-size version.

Thanks to Nicole for sending in the link!

Friday
Jul122013

Battle of the (Social) Sexes

Battle of the (Social) Sexes infographic

The Battle of the (Social) Sexes infographic from InternetServiceProviders.org explores some of the demographic data behind social media.

You’ve no doubt heard the old, oft-quoted adage, “men are from Mars, women are from Venus,” used to denote the fact that men and women may not always see completely eye to eye. While this light-hearted statement isn’t taken literally, when it comes to the virtual world of Internet interactions, similar sentiments may be formed surrounding the different ways men and women use social networking. While the majority of adults in the US are plugged into some sort of social media outlet, not all of them are used in equal measure, and not all of them are used by both genders equally. For instance, the average Google+ user spend just three minutes per month on the network, while the average Facebook user will spend 405 minutes per month updating statuses, posting pictures, and checking out others’ profiles. So what can be learned about men and women in the world of the web? As is turns out, men and women tend to dominate very different social media networks. The following infographic takes a look at some of the differences between male and female-dominated social media sites: How many users each one has, as well as how they interact.

There’s so really good data they have compiled in here, and most of the data visualizations are easy to understand.  I would not have expected to see that Twitter has 40 million more female users each month.

There are a handful of minor tweaks that would help improve the design:

  • The salmon/orange/peach color for women is unexpected compared to the traditional pink.
  • Go ahead and use the official Twitter and Facebook icons.  No need to design their own.
  • The pie slices for time spent would work much better with colors that are more distinct.  The different shades of gray are very hard to differentiate.
  • For the pie charts, the text label should be placed next to the pie slice its describing, instead of the opposite side as shown in this design.  Flipping the pie charts horizontally would fix that easily.

I appreciate the clear Creative Commons license in the footer, but the URL to the original infographic lansing page is missing.  Since the infographic image file is shared by itself, the URL always helps readers to find the original.

Found on Ragan’s PR Daily


Monday
Jul082013

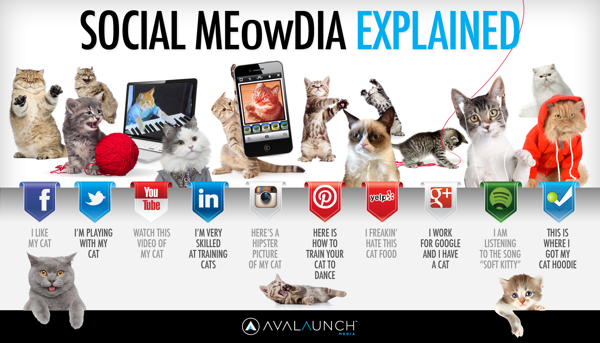
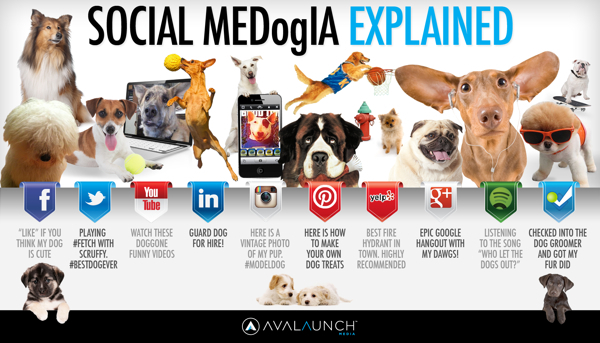
Paws vs. Claws: Social Media Explained

Social Media Explained Cat infographic


Avalaunch Media is running the Paws vs. Claws infographic voting competition between these two infographic that explain the social media networks from the perspective of dogs and cats.  The campaign is raising money for charity, so place your vote now (before July 31st) and donate money if you are in a position to support the causes.

A Social Media Bark-off of Epic Purrportions!

Here’s how it works:

We’ve joined forces with two world-renowned, animal-focused, non-profit organizations — The Humane Society of The United States is being sponsored by the Claws (a.k.a cats) and NEADS/Dogs for Deaf and Disabled Americans is being sponsored by the Paws (a.k.a. dogs).

We’re inviting internet-and-animal-loving companies and individuals everywhere to join us in donating to a pot of charity-cash. We’re kicking off the sharing by pledging $500 to the to-be-determined winner of the Paws vs Claws showdown and we’re counting on you, our internet-and-animal loving friends, to join in donating to the charitable cause.

Social Media Explained Dog infographic


 Thanks to Matt for sending in the link!


Friday
Jul052013

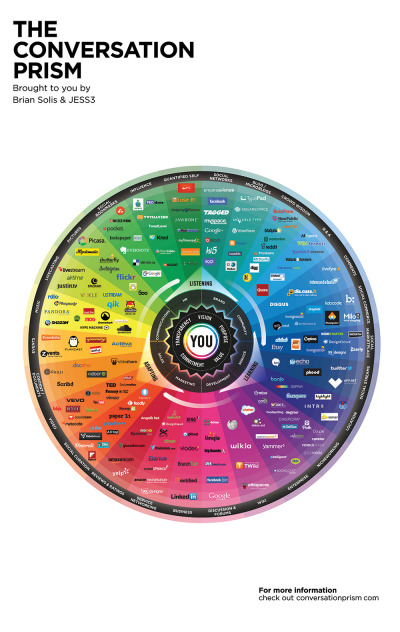
The Conversation Prism 4.0 for 2013

The Conversation Prism 4.0 for 2013 infographic

Brian Solis has released the new Conversation Prism 4.0, with updated companies and categories for 2013.  This project series has been a favorite on Cool Infographics since version 1.0 was released in 2008, and we haven’t seen an update since version 3.0 was released in 2010.

What is The Conversation Prism?

Developed in 2008 by Brian Solis, The Conversation Prism is a visual map of the social media landscape. It’s an ongoing study in digital ethnography that tracks dominant and promising social networks and organizes them by how they’re used in everyday life.

Version 4.0 brings about some of the most significant changes since the beginning. In this round, we moved away from the flower-like motif to simplify and focus the landscape. With all of the changes in social media, it would have been easier to expand the lens. Instead, we narrowed the view to focus on those that are on a path to mainstream understanding or acceptance. The result was the removal of 122 services while only adding 111. This introduces an opportunity for a series of industry or vertical-specific Prisms to be introduced so stay tuned.
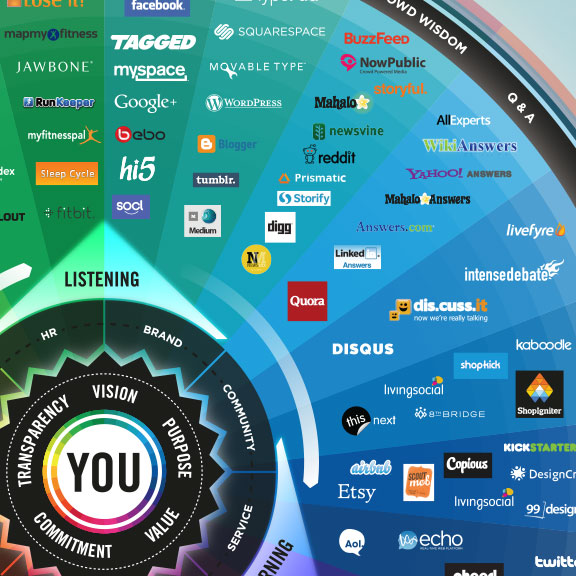
The Conversation Prism 4.0 for 2013 closeup

The design highlights the major companies in 26 different categories of social networking services.  This update loses the flower-like design style of the last three versions, and changes to a more straightforward circle with equal sized pie slices.

The inner circles have always been a little confusing for readers and marketers because the intent is that the inner labels can be adjusted depending on the user.  They don’t necessarily relate specifically to the services they are located near in the outer slices.

As a snapshot of the current social media landscape, this is a fantastic tool for marketers to consider the tools and services they want to engage for any particular campaign.  Three years was too long to wait for an update, since this landscape is changing and evolving very quickly.  That’s why 122 individual services were removed and 111 services were added. 
The Conversation Prism 4.0 for 2013 poster

The Conversation Prism 4.0 is available as a free high resolution JPG image download (great for computer wallpaper/desktop) of for purchase as a 22”x28” wall poster for $19.

Thanks to Jarred for sending in the link!  Also found on Mashable and The Next Web.


Thursday
Jul042013

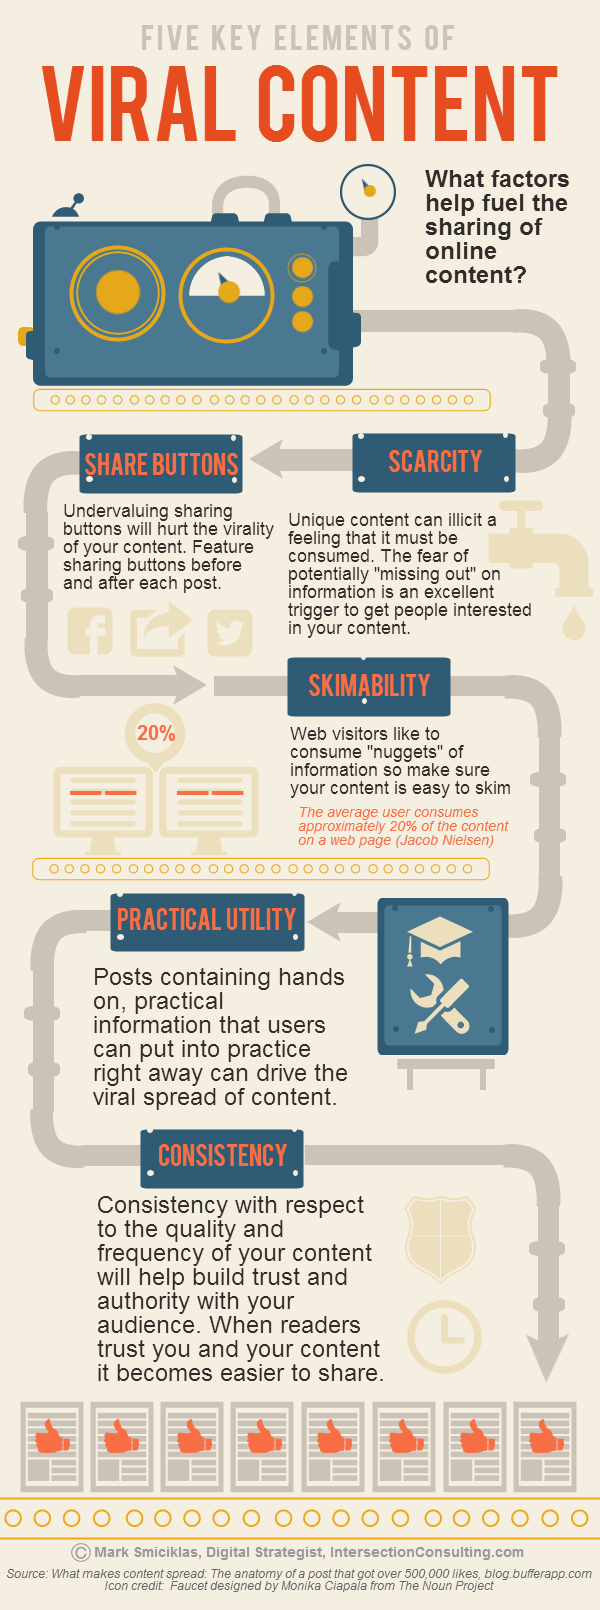
5 Key Elements of Viral Content

Mark Smiciklas from Intersection Consulting and author of The Power of Infographics, designed this helpful infographic The Five Key Elements of Viral Content.

The goal of every content marketer is to have his/her information shared across digital channels by their audiences. This is often easier said than done. What factors contribute to people sharing the content they consume online?

In researching the content for this infographic I came across a post in my Delicious archive that helps answer this question. Leo Widrich over on the Buffer Blog wrote a great post about what makes content spread. In it, he analyzes some of the elements that helped one particular blog post get over half a million likes. He also references an interesting research paper about what makes online content go viral.

This infographic highlights five key elements of viral content: scarcity, share buttons, skim-ability, practical utility and consistency. Are there any others you would add? The comments are yours.

Originally posted on Social Media Explorer

I would like to see the URL links to the sources and to the infographic landing page in the footer of the design so they travel with the infographic image as it gets shared across the Internet.

Monday
Jun242013

Is Social Media Bad For Your Phone?

Is Social Media Bad for Your Phone? infographic

Is Social Media Bad For Your Phone? infographic from liGo gives us the price of being connected to social media on our phone.  Social media drains our phone, increases the number of car accidents, wears us down emotionaly, and has taken away some of our privacy.  You can stop the drain with a few of the infographic’s tips.

If you have a smartphone, then the chances are you’ve used social media on your mobile at one point or another. It’s great to be connected all the time, but what are the negative effects of social media on your mobile? We’ve developed an infographic to find out the answer…

Great design, with an unusual take on Social Media.

The doughnut charts are a little hard for readers to understand because they don’t start at one of the standard right angles (0, 90, 180 or 270 degrees).  By starting the segments at an odd location, it’s harder for the readers to understand how much of the permimeter is colored.

There should be the URL at the bottom that takes readers to the original full-size infographic.

Found on Infographic Journal

Thursday
Jun202013

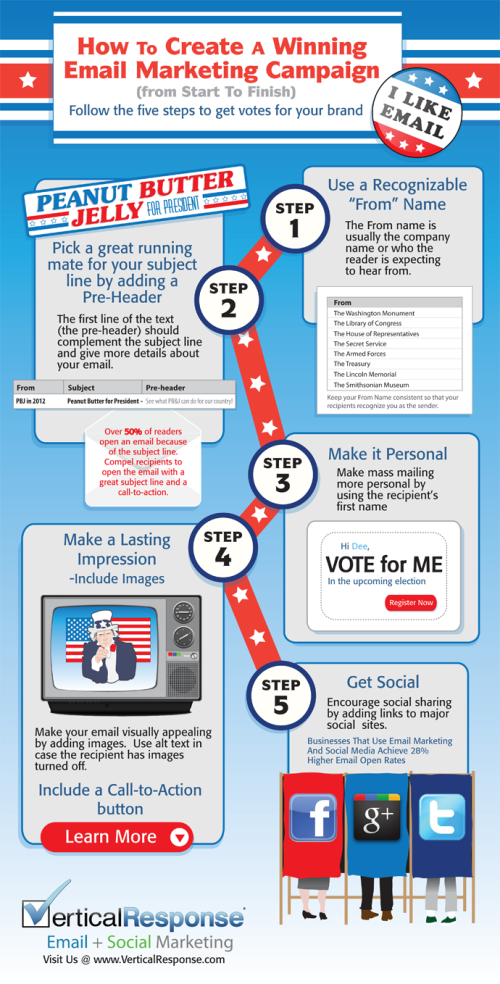
How to Create a Winning Email Marketing Campaign

How to Create a Winning Marketing Campaign infographic

Originally intended for the election year, VerticalResponse has created an infographic on How to Create a Winning Email Marketing Campaign

With over three billion email accounts open worldwide, numbers are showing that email marketing is a viable strategy to target and captivate potential customers. That number is expected to grow to a whopping 4.3 billion by 2016.

How do you make your email stand out from an inbox that receives an average of 112 emails per day? If stats citing click-through rates for 2011 are accurate, only 22 of those emails are opened, leaving the other 90 emails to become unopened, or worse, marked as spam (a four-letter word that strikes fear into the hearts of email marketers).

With election day coming up, we wanted to celebrate the occasion with a patriotic infographic on email marketing. From choosing the right “from” name to integrating your email with social networks, if email marketing has your vote, check out the infographic for five steps towards a winning email marketing campaign.

This is a good way to use an infographic as a visual explanation instead of a bullet list in text for a blog post.  It’s easier to share and includes the images to make it easier to understand.

They had some great data about the growing number of email accounts, but they didn’t include that in the infographic.  Any text description on the infographic landing page is usually lost when people share the infographic, so all of that information should be included in the infographics itself.

Thanks to Leigh for sending in the link!

Friday
Jun072013

Job Hunting in 2013

Job Hunting in 2013 infographic

Another social media positive! The Job Hunting in 2013 infographic from Adzuna says that 50% of Britons use social media for job hunting. Also 90% of Big British employers use social media to recruit new workers. 

In the past few months our incredible data nerds at (our snazzy new) Adzuna HQ have been witnessing something special.  So we decided to conduct a little poll, make a little infographic, and help the nation get down with, what we’re coining as, the Social Job Search Revolution. And the results were truly staggering; over 50% of you now turn to Facebook and Linked in to get hired with a little help from their friends. 

Thanks to Christian for sending in the link!

Tuesday
Apr162013

The Anatomy of the Social Media Command Center

The Anatomy of the Social Media Command Center infographic

Beingyourbrand.com has created The Anatomy of the Social Media Command Center so that you can learn more about a few of their favorite social media command centers, and how to construct your own.

In the recent months, many major brands have developed what they are calling “Social Media Command Centers.” These centers are state-of-the-art listening hubs that allow brands to monitor their presence on major social platforms and be ultra-responsive to conversations happening about their company. However, with all their glamor, are these command centers really capable of delivering results, or are they just for show?

The following infographic, looks at three of the most noteworthy examples of social media command centers:

  • The University of Oregon’s Quakecave in Autzen stadium
  • Gatorade’s Mission Control at their Chicago headquarters, featuring custom visualization from STRUCKUndercurrent, and Radian6
  • The American Red Cross Command Center powered by Dell

More of a visual explanation, the design does share some common points of data like number of employees and a relative scale of the amount of data being collected.  It’s a good design that clearly explains this new marketing function to readers.

The URL link to the infographic landing page on the should have been included in the footer to help readers find the original full-size version when the infographic is shared on other sites (like this one).  Especially a good idea since this was posted on their blog, and will get buried in the archive over time.

Thanks to Matt for sending in the link!

Tuesday
Apr022013

Social Network Overload

Social Network Overload infographic

How often have you checked your social media accounts today? Feeling unplugged is a problem for many people.  Social Network Overload from mylife.com talks about how people are addicted to social media, and what they rather do than give up their Internet lifeline. 

Afraid you’re missing something important on your email, Facebook, Twitter, or other accounts? You are not alone. Two out of three people feel the same way. In the same survey, three out of five people wished there was a solution to monitor their various communication options.

Here’s an interesting infographic based on a survey by Harris which illustrates a growing trend—social media overload

The isometric illustrations of people and the data visualizations are fun, and the light-hearted data makes this one appealing to share.  The design is missing the URL to the infographic landing page, so that readers can find the original when they see thie infographic posted on other sites.

Found on The Undercover Recruiter and Visual Loop.