About
Randy Krum
President of InfoNewt.
Data Visualization and Infographic Design

Infographic Design

Infographics Design | Presentations
Consulting | Data Visualizations

DFW DataViz Meetup

Join the DFW Data Visualization and Infographics Meetup Group if you're in the Dallas/Fort Worth area!

Search the Cool Infographics site

Custom Search

Subscriptions:


Feedburner

The Cool Infographics® Gallery:

How to add the
Cool Infographics button to your:

Cool Infographics iOS icon

- iPhone
- iPad
- iPod Touch


Read on Flipboard for iPad and iPhone

Featured in the Tech & Science category

Flipboard icon

Twitter Feed
From the Bookstore

Caffeine Poster

The Caffeine Poster infographic

Entries in corporations (104)

Thursday
Sep162010

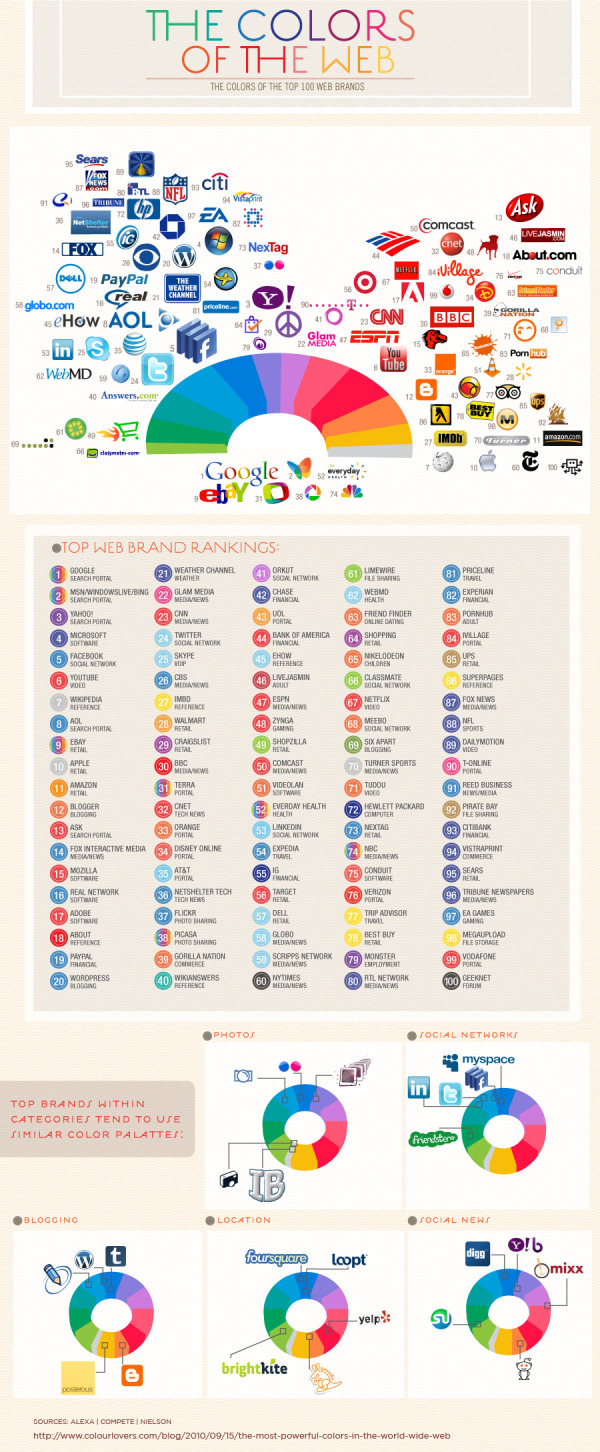
The Most Powerful Colors on the Web


The Colors of the Web is a very cool infographic by ColourLovers.com.  Looking at the color distribution of the icons of the top 100 web brands.

When we released our report on the colors of the social web, based on data analyzed by our Twitter theme tool, we were surprised that blue was such a dominant color in people’s profile designs. Was Twitter’s default color influencing their design decisions? Or is blue really THE most popular and dominant color online? …We decided to look at the colors in the brands from the top 100 sites in the world to see if we could paint a more colorful picture.

Maybe a yellow icon wasn’t the best choice I’ve ever made…

Thursday
Sep092010

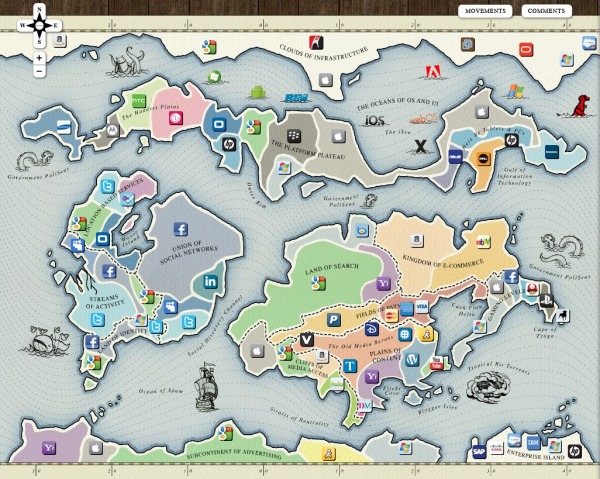
The Web 2.0 Points of Control Map


The Web 2.0 Summit Points of Control Map is a very cool, interactive map.  As part of the marketing for the upcoming Web 2.0 Summit (November 15-17 in San Francisco) they have released this interactive map that takes the metaphor of web companies/brands as countries on a map (from xkcd.com and flowtown.com) to a new level.

Pan and Zoom to explore the map, and click the icons to get some insight about each player and their position.

Then, turn on the comments view to discuss the map with others and add your own ideas!


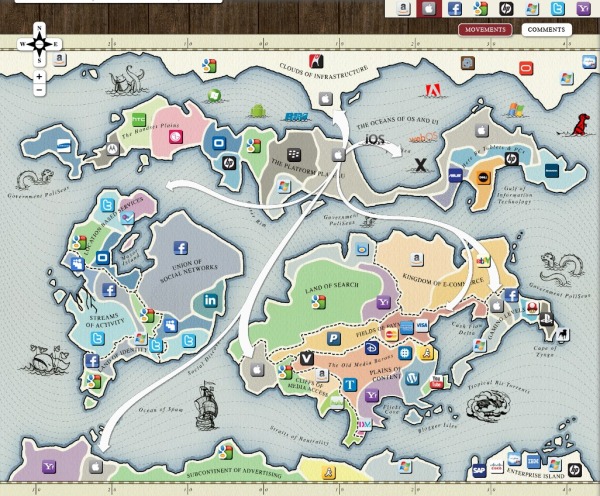
By clicking on any of the company icons at the top, arrows are shown to indicate the business areas (continents) that the companies are trying to expand into (colonize).  You can turn them on one at a time, or turn many of them on at the same time.

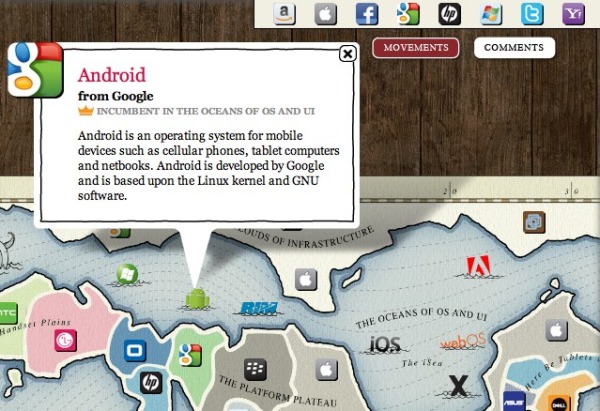
Additionally, you can select any individual icon to get more details:

John Battelle has an in-depth post on the Web 2.0 Summit blog, Points of Control: The Map, about the creation of the map, and his hope that others will add to it in the future.

We’ve put the entire map under a Creative Commons Attribution-NonCommercial-ShareAlike 3.0 Unported License, which means we want you to take this idea and add to it, making it better. Once our amazing development partners at Blend Interactive catch their breath, we also plan to release the code and documentation, so you can create your own maps as well.

Our thanks to the team at Blend who worked with me to bring this vision to reality, and to Janetti Chon, my producer, who kept it on track, and the entire team at Web 2.0 for bearing with us as we brought this first iteration to fruition.

Found on VizWorld.com and VizThink.com 

Friday
Aug272010

Google(graphic) - Google's Acquisition Appetite

From Scores.org, a data-heavy Google(graphic) by Jess Bachman, Google’s Acquisition Appetite.  Visualizing almost 10 years of Google’s acquisitions and investments, and there’s hardly a month that Google didn’t invest in something.

I like the multiple dimensions to the data.  Three columns show how the acquisition helped Google, the colors of each acquisition show what assets were gained, an additional circle shows the value of the acquisition (if it is known) and of course the timeline aspect.

Great job Jess!  I’d love to see you keep this updated somewhere.


Monday
Aug022010

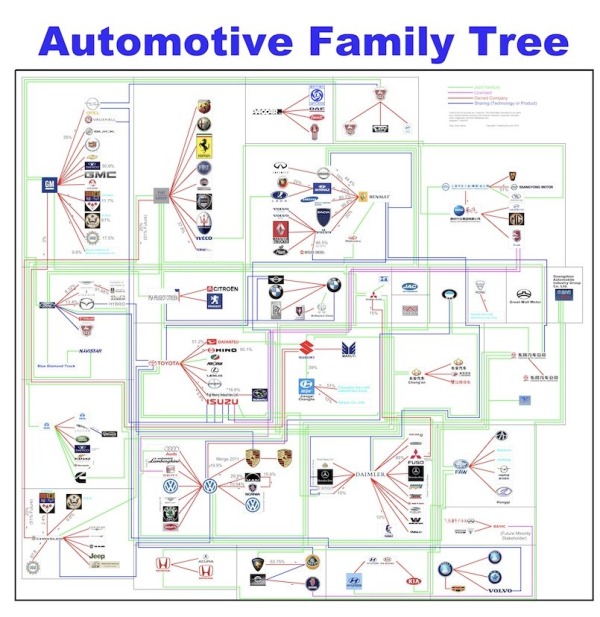
Automotive Family Tree: Update, Interview and Poster GIVEAWAY! #autotree

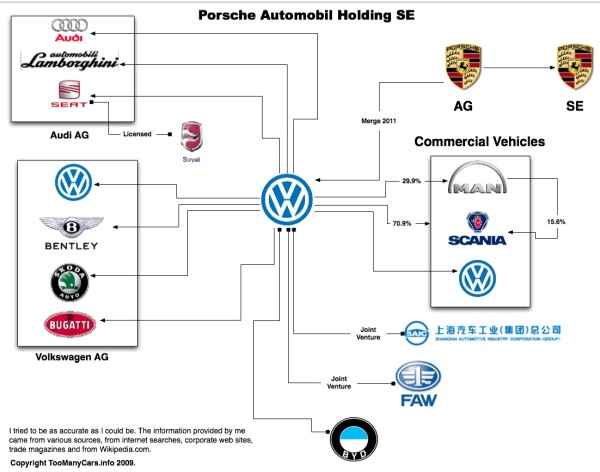
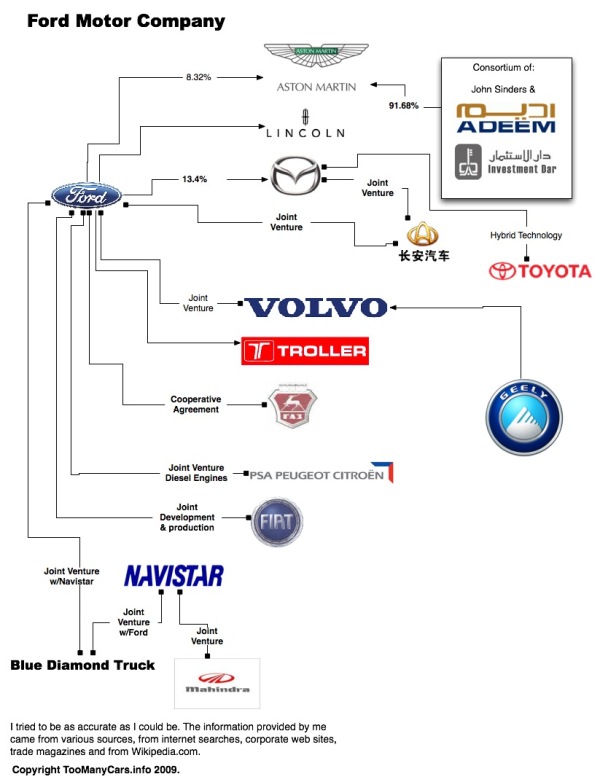
Andy Harris from TooManyCars.info has updated (a few times) his fantastic Automotive Family Tree map of who owns the car companies since the last time I posted about it a couple years ago.  The map is so big and detailed that you have to click on specific ownership corporations to zoom into just their connections.  The colored connection lines indicate the nature of each relationship (Joint Venture, License, Ownership or Sharing Technology).


You can enter to win a FREE copy of the printed poster by tweeting a link to this post on Twitter including the hashtag “#autotree” (without the quotes) by the end of the day on August 6th.  I’ve included the hashtag in the title, so you can enter by retweeting the post from my Twitter account.  One winner will be randomly chosen to receive a printed copy of the poster.  You have to be following me on Twitter so I can send you a direct message if you win.

The large version is available for a small donation to TooManyCars.info.  The PDF is available for $5, and the 36”x36” printed poster is available for $30.

Andy also agreed to answer a few interview questions about how he makes the Automotive Family Tree and it’s history.

Cool Infographics: What inspired you to create the Automotive Family Tree?

Andy Harris: About 8-10 years ago in a British auto magazine I saw a diagram showing the main connections between automotive manufactures (Ford owns Lincoln, GM owns Chevy, etc.). The more I thought about the diagram, the more info I wanted to know. I decided I want to learn HTML so I used the idea of the Automotive Family Tree as my learning curve.   


Cool Infographics: Do you do all of the design yourself?  What’s your background?

Andy Harris: I do all the design for the website and Automotive Family Tree myself. My day job is telecommunications engineering, however my background is in CAD. Bottom line, I draw maps showing where the telephone cable in the alley is located, type of cable, electronics, etc. I never really consider myself a design artist.   


Cool Infographics: What software applications do you use for the family tree?

Andy Harris: Because of my background in CAD, the large PDF is made using AutoCAD. But the smaller diagram for the website is done in OmniGraffle. So, my MacBook Air gets a work out switching between XP to use AutoCAD and OS X to use OmniGraffle.


Cool Infographics: How much traffic does having the infographic drive to your site, TooManyCars.info?

Andy Harris: When I first started my website, it was about car reviews. Then I switched to blogging a few years back. But the heart of my website has always been the Automotive Family Tree. This infographic is a major reason someone comes to my blog.


Cool Infographics: Are there any interesting places you know the poster is being displayed?

Andy Harris: The most interesting printed posted I sold to was someone in Russia and Turkey. My download PDF has also been sold around the world. But the most interesting request for the Automotive Family Tree was used in a Master Thesis from a student in Poland. However, one thing I’m proud of is being published in GQ magazine from Taiwan. The automotive industry is truly international!


Cool Infographics: What are some of the most surprising or interesting company relationships you’ve found by doing the family tree?

Andy Harris: I think the most surprising relationship in the family tree is the amount of change. There are joint-ventures everywhere because of the economy, and more and more sharing of technology between manufactures, making some strange bed-fellows. I’d say the new Renault-Mercedes-Benz connection is the most surprising.


Cool Infographics: How difficult is it to gather the company relationship data?

Andy Harris: I get this question many times, how long did it take you to make this? I really don’t like to think about it, but if I had to guess, 120 + hours in just gathering information, reconfirming, gathering more information, more confirmation and still gathering more information. I’ve recreated it two times. My first example was more simple and just using the major automotive manufactures from USA, Euro and Asia. Then as China grew, I added more automotive logos, more gathering of information and reconfirming. I’m not sure if it was difficult as much as time consuming. But putting this together became a labor of love.


Cool Infographics: What are the printing specs for the poster and why?

Andy Harris: I currently print at 36”x36”, I started as D-size or 24”x36”. As it grew 36”x36” was the most logical choice and the square print looks nice.


Cool Infographics: What’s the most interesting part of designing the Automotive Family Tree?

Andy Harris: I think one of the most interesting parts about the Automotive Family Tree, is the different types of people wanting to download the PDF. I’ve got request from a F1 engineering group, NUMMI manufacture marketing (before they closed), trading companies, automotive equipment manufacturers and oil companies. But not the petrol makers, think more like lubrications for engines and lubricants for manufacturing equipment. When I started this journey, I only wanted to inform the public that the automotive world is truly international, and now I get emails asking me to add more specialty manufacturers or even make custom inforgraphics.

Great job Andy!

Wednesday
Jul212010

What BP Could Have Bought With All the Money They Lost [infographic]

From VisualEconomics.com “What BP Could Have Bought With All the Money They Lost” is a long, side-scrolling visual of some examples of what BP could have done with $100,000,000,000.  I like the use of photos to help tell the story, and it stands out from the crowd by scrolling to the side instead of down.

Two things I think are wrong about this one though.  Although all of the possible expenditures add up, the number values aren’t visualized in any way.  Also the $100,000,000,000 is the loss in stock market capitalization, not $3.5B in cash that BP has spent on recovery efforts.  It’s not actually money that BP has spent.


Wednesday
Jul212010

GE open position: Leader, Data Visualization

GE is looking to hire a Leader of Data Visualization located in Fairfield, CT.  It’s very interesting to watch the data visualization field become an official function within mainstream companies.

Although, I think the the job description should be an infographic instead of text for this one…


Job Number: 1182874  
Date Posted: 08 July 2010  
Function: Marketing - Advertising and Brand Marketing  
Business: GE Corporate - Corporate Commercial and Communications  
Career Level: Experienced  
Location: Fairfield, Connecticut, United States


Role Summary/Purpose

Over the past year, GE has worked to build the brand and competitive advantage by using design to simplify complex data, i.e. data visualization. Examples of GE’s data visualization work to-date can be found on the healthymagination web site: http://www.healthymagination.com/stories/decoding-data/

Essential Responsibilities

GE’s data visualization strategy consists of four separate work streams: 

  • Developing proprietary data visualization applications to tell the GE story, focused on the pillars of the brand and advertising strategy: ecomagination, healthymagination, and innovation.
  • Supporting communications and PR about flagship business initiatives with data visualization.
  • Incorporating world-class data visualization into product design and user experience.

Developing an open source visualization site.

The Leader, Data Visualization will be part of GE’s Corporate Commercial and Communications team and will be responsible for execution of the corporate data visualization strategy, including the development of interactive data visualization applications and information graphics for brand building, customer-focused data visualization applications and ongoing support of the new data visualization web site. 

GE businesses may also be managing Data Visualization projects independently. The Leader, Data Visualization will be responsible for providing consultative support to businesses working on their own data visualization projects.

Key responsibilities include:

  • Interpreting data to develop a storyline and creative brief consistent with GE’s overall brand strategy and priorities.
  • Identifying and obtaining GE’s proprietary data and relevant third-party data. 
  • Managing several creative agencies simultaneously, to ensure projects are aligned to the goals of the brand, on budget and on time.
  • Presenting GE’s data visualization strategy to marketing, communications and design teams throughout GE.
  • Coordinating timely launch of data visualizations across functions, including legal, IT, public relations.
  • Monitoring discussion of data visualization in traditional media and blogsphere to identify emerging trends and new design partners.
  • Managing awards submissions to ensure GE is recognized for leadership in visualization.


Qualifications/Requirements


  • Bachelors degree, undergraduate experience in design, advertising or communications.
  • Ability to analyze and interpret large data sets.
  • Strong design sense, ability to lead creative teams.
  • Ability to work in a matrixed environment.
  • Creative thinker who thrives in a collaborative setting.
  • Excellent written and verbal communication skills.
  • Strong project management skills with an ability to manage multiple projects in a fast-paced environment.
  • Ability to meet tight deadlines and work under pressure.
  • Strong organizational and problem-solving skills.
  •  Must be a team player with an ability to work independently.


Tuesday
Jul132010

The Entrepreneur's Visual Guide to Tech Startups

HackFwd is a European tech investment firm, and they posted this flowchart on their front page to help startup companies see what it’s like to work with them.

We’re experienced tech entrepreneurs looking to support and invest in Europe’s most passionate geeks. We’re a pre-seed investment company designed to enable great people to launch great ideas. Our start-up and support process accelerates the route to beta, profitability, and success.

We want you to feel good at every step along the way. Here’s how your experience might look:

Apply-Rinse-Repeat

Found on FlowingData.com

Tuesday
Jul132010

Google's Social Media Timeline

From Mashable.com, Google’s Long History of Forays’s into Social Media is a timeline of acquisitions, deals and updates showing Google’s attempts to get involved in Social Media.

Google hasn’t had the best track record when it comes to social media attempts. Rather than a boring old list of past efforts, we decided to put together a graphical timeline with text by our very own Stephanie Marcus and graphics by Shane Snow.

Thursday
Jul012010

Visualizing the links between the WIG20

Łukasz Kostka designed this linking visual to show the connections between the board members in the WSE WIG20.

A map of connections between board of directors and supervisory board members in companies forming WSE WIG20 index. Connection is assumed if two people are members of the same board. Dot size reflects a number of boards. Link color reflects a number of connections.

I had to lookup what the WSE WIG20 was, and according to Bloomberg “The WIG20 index is a modified capitalization-weighted index of 20 Polish stocks which are listed on the main market. The index is the underlying instrument for futures transactions listed on the Warsaw Stock Exchange.

I wish there was a good way to also see which companies are represented along with their board members.

Thanks to Łukasz for sending in the link!

Wednesday
Jun162010

Facebook's Secret Strategy Infographic

Art: Audrey Fukuman

There was some controversy when Facebook CEO Mark Zuckerberg unintentionally revealed the 2010 Facebook Strategy Infographic that was printed on the inside liner of his hoodie at the D8 conference.  Audrey Fukuman at SFWeekly.com has recreated the infographic based on the video and photos.

Photo via AllThingsD/Anna Mathat

According to SFWeekly.com, this was a hoodie given to all Facebook employees.

I expect some disagreement, but I’m a firm believer that you can absolutely design an infographic to represent a strategy, a concept or a qualitative result.  Infographics don’t have to be based only on a massive amount of quantitative, numeric data.  What do you think, does this qualify as an infographic?

Here’s the video clip from the AllThingsD D8 conference when Mark removed the hoodie and revealed the graphic:

Found on SFWeekly.com and digg.com

Page 1 ... 3 4 5 6 7 ... 11 Next 10 Entries »