About
Randy Krum
President of InfoNewt.
Data Visualization and Infographic Design

Infographic Design

Infographics Design | Presentations
Consulting | Data Visualizations

DFW DataViz Meetup

Join the DFW Data Visualization and Infographics Meetup Group if you're in the Dallas/Fort Worth area!

Search the Cool Infographics site

Custom Search

Subscriptions:


Feedburner

The Cool Infographics® Gallery:

How to add the
Cool Infographics button to your:

Cool Infographics iOS icon

- iPhone
- iPad
- iPod Touch


Read on Flipboard for iPad and iPhone

Featured in the Tech & Science category

Flipboard icon

Twitter Feed
From the Bookstore

Caffeine Poster

The Caffeine Poster infographic

Entries in corporations (104)

Friday
Oct212011

UN Against Corruption infographic video

This UN Against Corruption infographic video is actually a highlights overview of a six-part video series from the UNCAC (UN Convention against Corruption) Coalition.  This video does a good job of showing how corruption impacts societies, escpecially in third world countries.  You can view the complete series at http://www.uncaccoalition.org/en/uncac-review/uncac-review-mechanism.html

Highlights of the six-part suite of 2D infographics videos commissioned by Transparency International in collaboration with UNODC. This video infographic uses animated typography and simple, iconic animated graphics and pictograms to explain the effects of corruption on society. It also incorporates a short segment of live-action video, embedded within the context of iconic elements. It provides a compelling and fast-paced tutorial for organisations and activists on how to bring pressure to bear on governments to more effectively fight corruption.

Credits:

  • art direction: mariano leotta
  • motion graphics: alessandra leone
  • sound design: ex-directory
  • sound mixing: enrico anicito guido
  • voice over: tom tucker
  • shooting: luca fuscaldi
  • production: artereazione.org
  • commission: transparency.org

The full six-part series is now available on YouTube:

Thursday
Sep292011

Airlines: The Future of Loyalty is Social


SimpliFlying has done some great research on how frequent travelers use social media.  The Future of Loyalty is Social infographic summarizes some of the key findings from the research.

To dig deeper, we partnered with Cranfield University in the UK to conduct a study on how frequent travelers (who travel at least five times a year) use social media. And here are some highlights of what we found:

  1. There are more airlines on Twitter than there are airlines with frequent flyer programs (191 vs 179)
  2. Almost 90% of frequent flyers use Facebook regularly, and over 65% “Like” at least one airline on Facebook
  3. To frequent fliers cheapest fare is the least significant loyalty factor among customer service, earning loyalty points and onboard experience
  4. 72% of frequent fliers would join a social loyalty program
  5. Over 65% of frequent fliers would like to earn social loyalty points via check-ins or by contributing ideas to an airline’s Facebook page.
  6. Over 80% of frequent fliers would like to earn social loyalty points by recommending the airline to a friend or providing positive feedback.

In the infographic below, we have summarized the findings of the study, and will soon release a detailed presentation of these findings too. Special thanks to Gavin Tan and Prof. Keith Mason from Cranfield University for their tremendous help with this study.


The simple, isotype-style illustrations are immediately recognizable since they are so similar to the figures used in airports and airline signage.  I think the Frequent Flier Participation Ladder is some fantastic data, and should have been more prominent in the design.

A handful of things I would have changed about the design:

  • The initial visualization of social sites should have been in descending order.  It’s almost there except for Twitter listed first.
  • The Twitter factoid ‘Frequent fliers “following” their favorite airlines on Twitter are steadily increasing’ is not supported by the visual showing how many airlines are followed by frequent fliers.  The statement claims a change over time.
  • The benefit percentages are shown on an odd shape of 10 squares.  Is that supposed to be an airline seat?  Hard for the reader to visually grasp the percentage since it isn’t a simple square shape.  A grid of 100 squares would have worked better.
  • The doughnut percentages are sorted in descending order, so the colors are in a different order in each doughnut.  Very hard to interpret.  The orders should have stayed consistent from Very Strong to Not at all in each doughnut.  Doughnuts are also hard to compare with each other visually.

Some great research data, and an infographic was a great way to publicize it.  They were very thankful to the professors at Cranfield University for their help with the research, but I wish they had credited a designer.  Was this done by someone inside SimpliFlying?

Found on MediaBistro

Wednesday
Sep212011

The Genealogy of U.S. Airlines


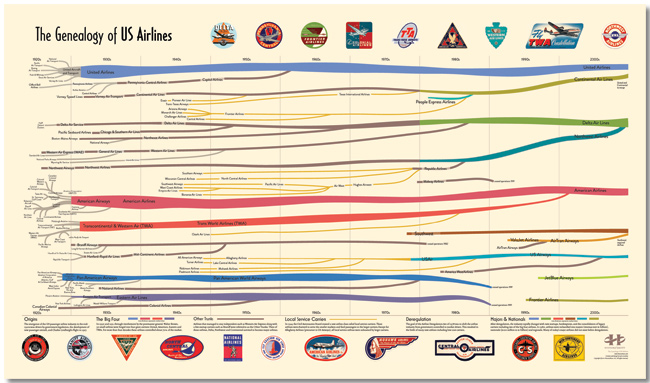
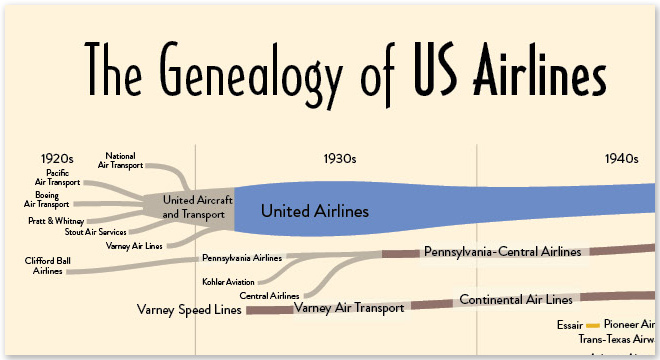
A new infographic poster designed by Larry Gormley at HistoryShots.comThe Genealogy of U.S. Airlines visualizes over 90 years or corporate history of airline mergers, acquisitions and closures.  Over 100 different airlines have consolidated down the seven shown still in existence today. 

The carriers are color coded and line widths represent market share for any particular year.

Over its short history, the US airline industry has experienced many dynamic phases of expansion and consolidation. From its origins in the 1920s, when air mail carriers started to transport passengers, to the creation (with the not so gentle prodding of the government) of the Big Four (American, United, TWA, and Eastern), from the rise of the local service carriers to deregulation and the most recent wave of mergers and acquisitions, the industry continues to fascinate both the casual traveler and the aviation buff.

The purpose of this graphic is to uncover and explain how the industry was created and how it arrived at its present form. At the core is a full genealogy of over 100 US airlines from the major airlines to the small local service carriers. Folded into the genealogy is the relative market share of passenger traffic for each airline. This allows the viewer to understand how the industry was controlled for many decades by the Big Four and how this dominance was quickly replaced by a number of other airlines.

You can buy a copy of the poster for $29.95 over at HistoryShots.com

Wednesday
Sep142011

Google in 2011: Courtroom & Boardroom

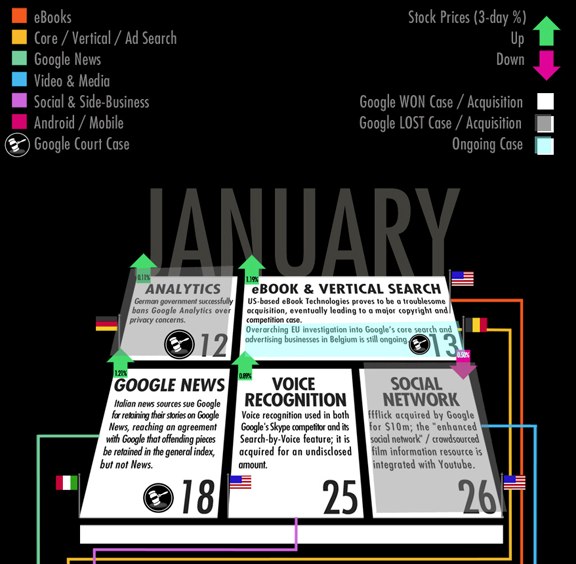
Google in 2011: Courtroom & Boardroom is a new infographic from Search Influence.  At it’s heart, this is a timeline history of acquisition and courtroom events through the first nine months of 2011, but there is a lot going on here.

Events are laid out in a psuedo-calendar format for each month, flagged by country and shaded to indicate win or loss.  The change in stock price is also shown for the actual day of each event, but even though this implies the event’s impact to stock price, there are always many more factors driving price changes.  Events are connected by colored lines to indicate on-going events and the related division of Google’s business.

I hope they keep evolving this design.  In it’s current state, it’s a little hard to follow, but I love the multiple layers of data represented.  This design could evolve to be more easily readable, and even be applied to other companies as well.

Thanks to Matt for sending in the link!


Tuesday
Sep062011

Recruit-O-Graphic

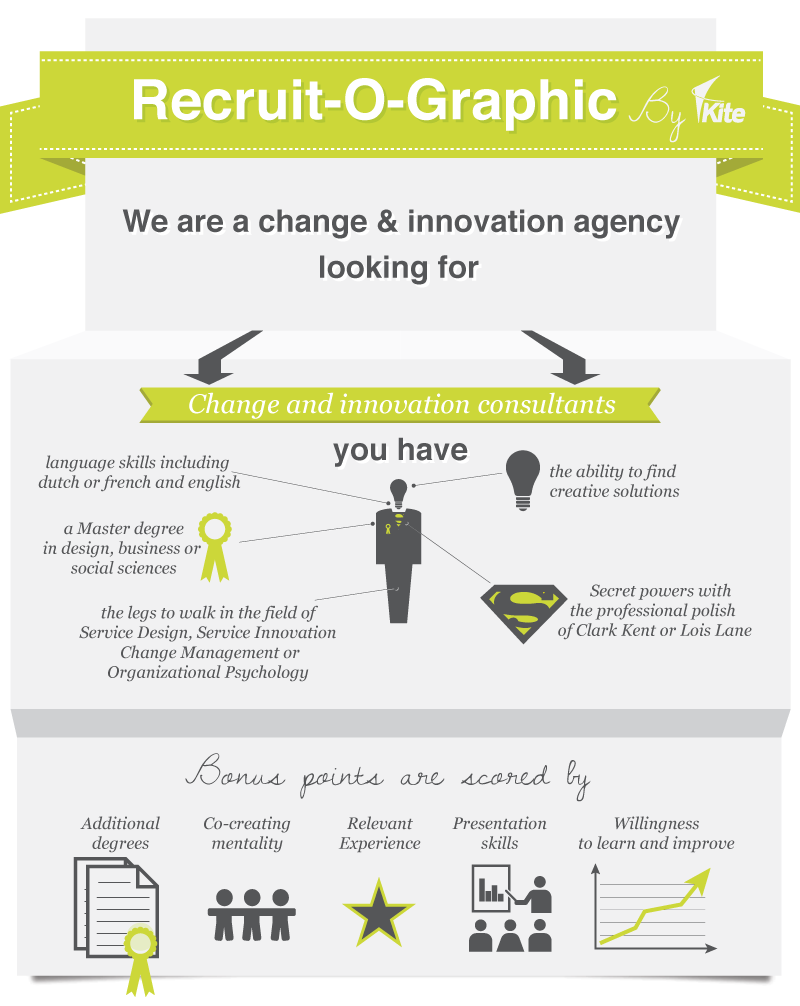
What a great idea!  Kite Consultants designed this infographic job posting, Recruit-O-Graphic, as an innovative way to visualize the job requirements and to show some aspects of working for Kite.  What would have been a long, wordy job posting is now fun and easy to read.  You also get a great sense of the company culture and attitude.

I’m definitely doing something like this for InfoNewt when it’s time to recruit!

Thanks to Sebastiaan for sending in the link!

Wednesday
Aug312011

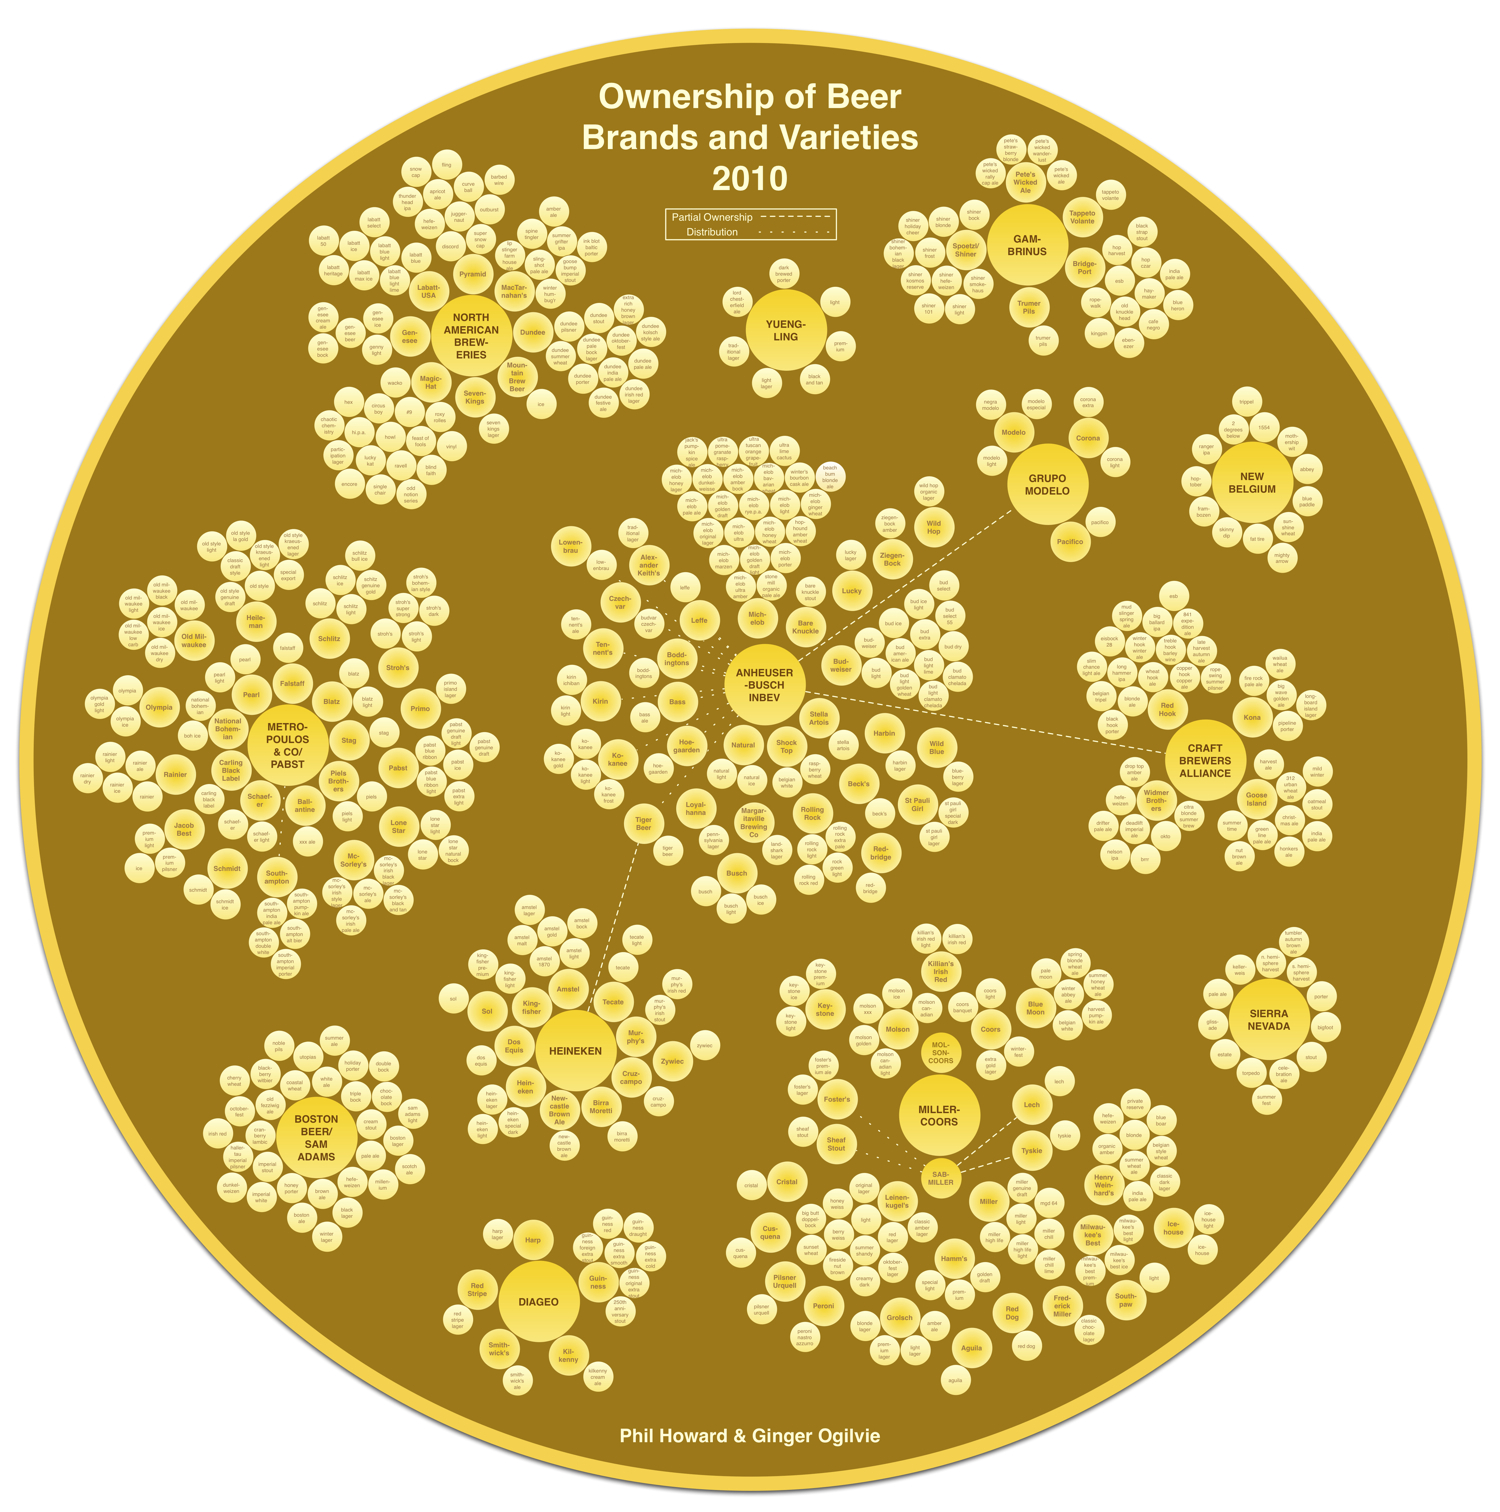
Who Owns The Beer Brands?

That beer you’re drinking from that cool independent brewery may not be what you think.  Another very cool data visualization from Philip H. Howard and Ginger Ogilvie at Michigan State University called Concentration in the US Beer Industry.  Similar to their last project visualizing the soft drink industry in The Illusion of Diversity, this new project shows the breweries and individual beers owned by the top 13 companies.

There is an appearance of great diversity in the number of brands and varieties of beer sold in the United States. The beer industry, however, is dominated by a relatively small number of firms.

AB InBev owns, co-owns or distributes more than 36 brands, for example, while MillerCoors controls at least 24 more. MillerCoors also brews Metropoulos & Company’s products under contract (thus the company that controls Pabst and 21 other brands is a “virtual” beer company).

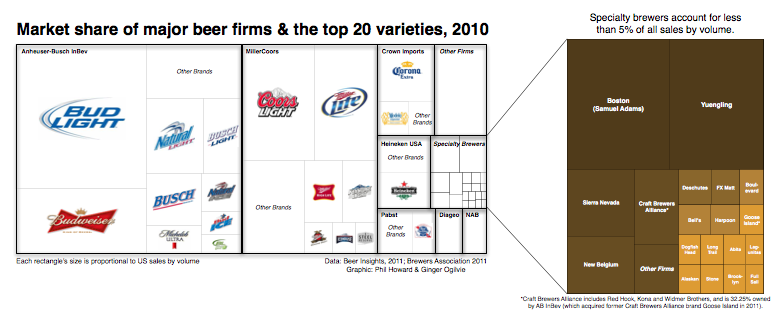
Only meant to show which companies own which beer brands, the three bubble sizes are used to show parent companies, brewery brands and individual beer brands.  They designed a separate treemap visualization to show market share.

Because these are large visualizations, they have posted them within zooming viewers on the Michigan State University site.

Found on Flowing Data.

Wednesday
Jul132011

The Content Grid v2

First, The Content Grid v2 is a cool, new infographic collaboration between Eloqua and JESS3.  The infographic maps out the different ways that companies can deliver information to potential customers, how that content can effect the buying process and the different distribution channels for that information.

It’s a complex set of data, and this infographic does a fantastic job of summarizing the different tools available onto one page.  This would work as a fantastic tool to use when planning a strategy to release a new product, and choosing the different ways you could successfully reach your customers.

The Content Grid v2 picks up where its predecessor left off. Intact is the prescriptive connection between content type and distribution channel. New is the perspective of the buyer, a multi-stage purchase funnel, and a comprehensive collection of KPIs (like they say, “What isn’t measured, isn’t purchased.”). Although v2 contains significantly more information than the original, the new design is infinitely more simple. This achievement is a tribute to the unrivaled design team at JESS3 – and the clarity of client/agency communication that comes only with time and trust.

Enjoy The Content Grid v2. It’s not only the next generation of the Web’s most popular and award-winning content marketing infographic, but it’s also a how-to for marketers looking to operationalize content marketing programs.

Second, Jesse Thomas, CEO of JESS3, has posted a good “The Making of an Infographic” article on Forbes.com looking behind the scenes at the infographic design process, and sharing some of the other design options that were explored during the process.  A couple of the other designs are included above.


And finally, third, Joe Chernov has a good article about designing Planned Obsolescence into the infographic as an effective markleting practice.  Eloqua and JESS3 released the original Content Grid (above) in June of 2010 knowing it was interesting data, but not quite useful yet as a tool.

We knew the graphic was interesting visually, and we also knew it could be used by marketers. But deep down we felt that something was “off,” but we couldn’t quite put our finger on what was wrong. We could have sat in the drawing room until it was “perfect” (translation: indefinitely), but we didn’t. Instead we published the content as-is and deliberately planned to revisit it one year later.

During that time, we solicited feedback (in blog comments, on Twitter, from colleagues, even from the audience at speaking engagements) and preserved all comments in a spreadsheet. By provoking widespread feedback (positive and negative), we were deliberately rendering obsolete the infographic we had worked so hard to develop.

A fascinating look at how infographics are made and used as effective marketing tools.

Thursday
Jun302011

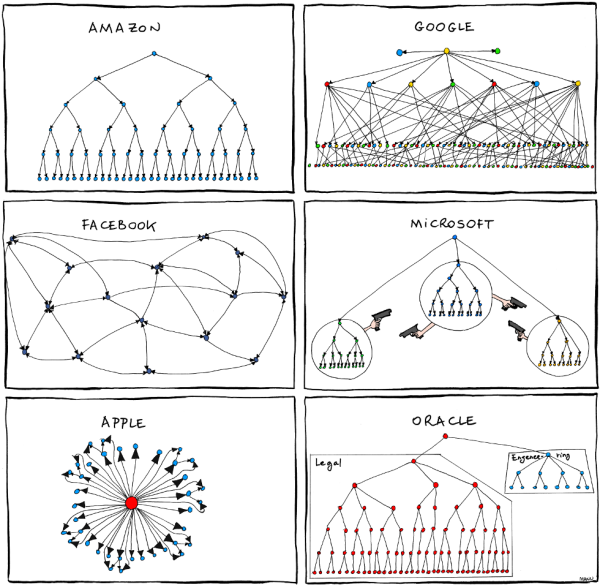
Humor: Corporate Organizational Charts

From Bonkers World, Organizational Charts is a very funny look at the corporate cultures and structures for some very high-profile tech companies using hand-drawn organization charts as the visual language.

Found on Daring Fireball.

Thursday
Jun162011

The Business of Giving


The design of The Business of Giving from SocialCast does a good job of walking the reader through a story about companies donating to charities.  However, they could have done more to visualize the scope of donations instead of just including the dollars values in text.

In the Popular Causes section, I would have built the icons right into the pie chart.  They don’t serve much purpose on their own next to the chart.

I love the puzzle piece images used for Partnerships.

Designed by Column Five Media

Tuesday
Apr192011

Monster Trade Show Displays (infographic)


From Monster Displays, a trade show displays reseller, the Trade Show Displays infographic is a great example of how companies are beginning to use infographics more for business communcations.  Most of the infographics posted here on Cool Infographics are intended to be shared far and wide through social media, but you never see the infographics that companies use internally or as part of their sales presentations.

This may not be the best infographic design (there’s too much text for my tastes), but it is what I would call data-heavy.  The infographic “shows” the reader the different types of displays, where they are used in a trade show, standard sizes, configurations and even includes an explanation of the mathematical effect of advertising lag.  I think they felt they needed to over-explain each illustration with words, and they have some statistics that they didn’t visualize at all.

Trade shows and trade show displays have a science behind them that most casual visitors never see. This infographic begins to explain some of the basics that every trade show attendee and trade show presenter should be aware of. What are the types of trade show booths? What layouts are available for the presenter? What advantages does trade show marketing have over other advertising campaigns? Learn more about the decay effect and advertising lag and how trade show advertising is affected.

This would also make a nice poster, or a handout to give to customers because it provides a good reference of information that customers would refer back to.

Thanks to Shell for sending in the link!