About
Randy Krum
President of InfoNewt.
Data Visualization and Infographic Design

Infographic Design

Infographics Design | Presentations
Consulting | Data Visualizations

DFW DataViz Meetup

Join the DFW Data Visualization and Infographics Meetup Group if you're in the Dallas/Fort Worth area!

Search the Cool Infographics site

Custom Search

Subscriptions:


Feedburner

The Cool Infographics® Gallery:

How to add the
Cool Infographics button to your:

Cool Infographics iOS icon

- iPhone
- iPad
- iPod Touch


Read on Flipboard for iPad and iPhone

Featured in the Tech & Science category

Flipboard icon

Twitter Feed
From the Bookstore

Caffeine Poster

The Caffeine Poster infographic

Entries in Giveaway (18)

Friday
Aug052016

Big Design 2016 Discount & Giveaway

Big Design 2016 Conference

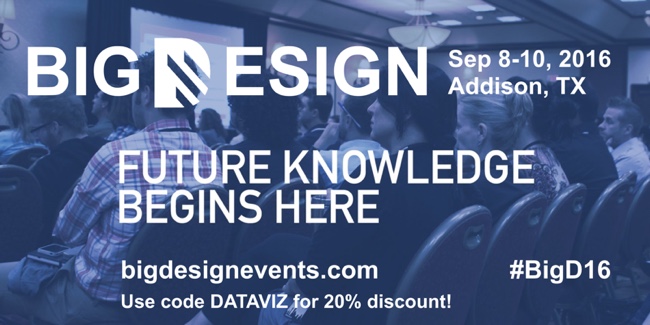
The Big Design 2016 conference is coming up September 8-10 in Addison, TX (in the DFW area)! Big Design is a fabulous conference covering User Experience, Design, Data Visualization, Digital Marketing, Content Strategy and Usability! This year I'll be there signing copies of Cool Infographics, and I'll be giving a new talk "What Is Good Dataviz Design?"

First, I have a discount code from Big Design that will get you 20% OFF the registration cost!  Use the code DATAVIZ during checkout to get the 20% discount.

Second, this month's giveaway is one free pass to the Big Design 2016 conference! Register on the GIVEAWAYS page before 11:59pm CT on August 19, 2016 to be entered. I will randomly chose a winner on August 20th.

Friday
May272016

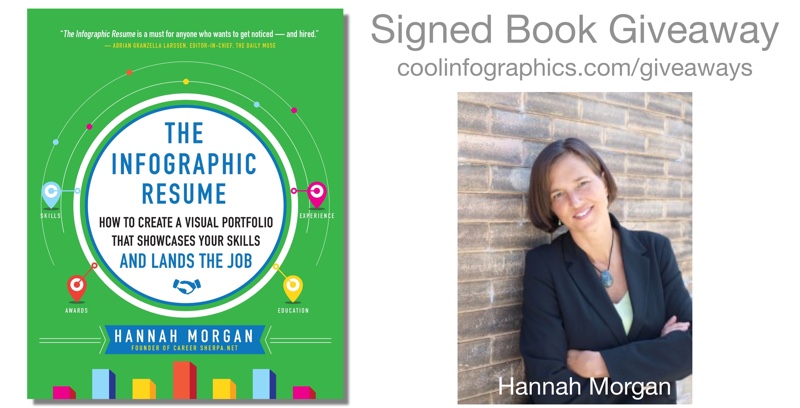
The Infographic Resume by Hannah Morgan: Interview & Giveaway

The Infographic Resume is a fabulous book by Hannah Morgan from Career Sherpa! I have a chapter dedicated to infographic resumes in my book, Cool Infographics, but this is the only entire book I've seen dedicated to infographic resumes anywhere. Find more on Hannah's book page.

This month I am giving away one signed copy of The Infographic Resume! Register on the Giveaways Page by June 30th to be entered.

Infographic resumes are in, and they’re not just for designers. Free online tools are popping up every day to help anyone create a dynamic, visual resume—adding panache without sacrificing substance for style.

The Infographic Resume provides essential tips and ideas for how to create visual resumes and portfolios that will make you stand out from the crowd. Richly illustrated in full color and including lots of inspiring examples, the book will teach you how to:

  • Create a powerful digital presence and develop the right digital content for your goals
  • Build your self-brand and manage your online reputation
  • Showcase your best work online
  • Grab a hiring manager’s attention in seconds

Packed with dynamic infographics, visual resumes, and other creative digital portfolios, The Infographic Resume reveals the most effective tools, eye-catching strategies, and best practices to position yourself for any job in any kind of business.

Everyone should follow Hannah Morgan on Twitter (@careersherpa)! She shares her wisdom and insights on resumes, hiring and career issues openly. You can download her Infographic Resume Cheat Sheet, and she maintains a Pinterest Board gallery of Infographic and Visual Resumes.


Hannah answered a handful of questions about The Infographic Resume:

How would you define an infographic resume?

Hannah: An infographic resume converts your work experience into visual pieces such as charts and graphs. Instead of finding the right words to write about your skills and achievements, you can present the most important parts of your experience visually. While this may sound difficult for some people, especially those without design skills, it can actually be liberating. As the saying goes, a picture is worth a thousand words.

Chapter 1 was great! Could you summarize your chapter on How We Got Where We Are Today?

Hannah: You may have noticed infographics and other visual elements appearing more often in newspapers, marketing materials and social media than in the past. We are inundated with information and rely on our smart phones for on-the-go access. Reading large blocks of text takes time and it is even more difficult to read on a mobile device. Studies indicate that the brain processes pictures faster than words. Other studies say pictures increase comprehension, increase the time people spend on a website, and increase sharing of updates on social media. Job seekers can leverage these trends to their advantage. Savvy job seekers know today’s job market is highly competitive. To make matters worse, almost every company has an Applicant Tracking System (ATS) which typically weeds out candidates and results in the dreaded “black hole” of no response. Technology has enabled job seekers to break out of the standard “apply online and wait” mold. By applying out-of-the-box marketing strategies such as social media campaigns, personal websites and infographic resumes, job seekers can do more to stand out and garner the attention they crave (and deserve). 

How would you describe the current state of the market for infographic resumes?

Hannah: Infographic resumes deviate from the expected and that is the very reason to use one. Most job seekers will not use one either because they don’t know about them, don’t know how to create on or think it would be risky to try and use one. In my opinion, the rewards outweigh the risk. Go ahead, use an infographic resume.

What are some of the more unexpected jobs or careers that you have seen candidates use an infographic resume?

Hannah: The early adopters of infographic resumes were people who had graphic design skills. But infographic resumes are being created by technical writers, sales representatives, information technology specialists and many other types of occupations. Infographic resumes demonstrate creativity and innovative thinking which are qualities valued in marketing departments, information technology, and start-up organizations, just to name a few. Consider the culture of the organization and the requirements of the role to help determine if an infographic resume might be successful opening doors.

Are there any risks associated with infographic resumes?

Hannah: There are some things you should know before you use an infographic resume. First, and foremost, do not use infographic resumes when submitting through applicant tracking systems! The technology used in ATSs cannot read visual content. You should also take into consideration who you are sending your infographic resume to. Typically, people in human resource and recruiting roles expect to see the traditional, conservative text resume. These roles often have to review hundreds, if not thousands, of resumes and do not have time to search your infographic for skills and work history. A better strategy is to send your infographic resume to the actual hiring manager or to a contact you have made inside the organization. Infographic resumes also make a great addition to your LinkedIn profile as embedded media in the summary section. If you have a personal website or online portfolio, an infographic resume works well there too. If you are proactively networking with people in your field of interest, bring your infographic resume to the meeting and share it to guide the conversation. And why not bring an infographic resume to an interview to impress the interviewers?

What types of reactions to infographic resumes are you hearing from hiring managers and recruiters?

Hannah:  About a year ago, I polled the recruiters, human resource professionals and career coaches in my network to get their feedback on infographic resumes and the overwhelming response was positive. In fact, 68 percent said they would look at an infographic resume, 32 percent said it would depend and no one said that they wouldn’t look at one. Here are some of the comments I received: 

“I would welcome a fresh, newer idea, which this is, as opposed to the same old resume.” -Hiring Manager

“Shows some creativity.”  -Other

“Yes! I would be thrilled with the creativity, and it would definitely be a resume that would stand out from the pack.” – Hiring Manager

“Yes, because normal resumes are boring.” -Other

Do you have your own infographic resume that I could share?

Hannah: Since I don’t have design skills, I rely on tools that convert my LinkedIn profile into an infographic resume, like this one created using vizualize.me. There are so many tools available to help create infographics so even people without design skills or familiarity with design software can dabble in infographics. I’ve written about four of those tools here: http://careersherpa.net/4-templates-for-infographic-resumes/


Hannah's Bio:

Hannah Morgan is the Founder, CareerSherpa.net and a Job Search Strategist. She is a speaker and author on  job search and social media strategies. She delivers fresh advice and serves as a guide to the treacherous terrain of today’s workplace landscape. Hannah’s experience in Human Resources, Outplacement Services, Workforce Development and Career Services equip her with a 360 degree perspective on job search topics. Recognized by media and career professionals, Hannah is an advocate who encourages job seekers to take control of their job search. Hannah is frequently quoted in local and national publications and she writes a weekly column for U.S. News & World Report.

Hannah is the author of “The Infographic Resume” (McGraw Hill Education, 2014) and co-author of “Social Networking for Business Success” (Learning Express, 2013). You can learn more about Hannah on CareerSherpa.net and by following her on Twitter at @careersherpa.

Friday
Apr152016

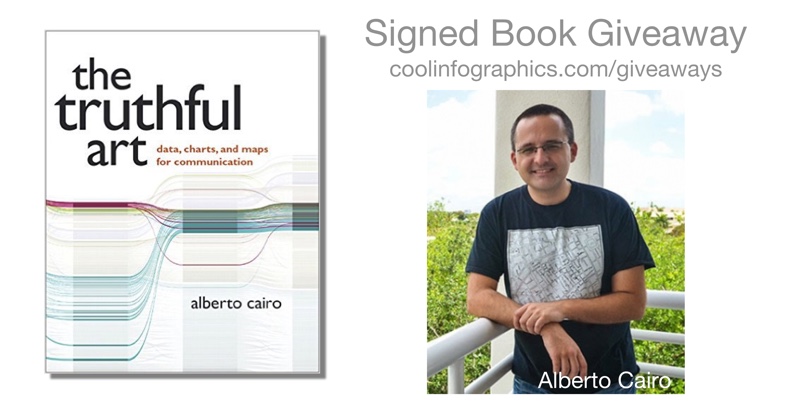
The Truthful Art by Alberto Cairo: Interview & Giveaway

The Truthful Art is the newest book by Alberto Cairo, and the second book of a longer, planned series. Following the huge acclaim and success of his last book, The Functional Art, Alberto expertly dives into getting data visualizations both accurate and designed for effective communication. 

This month I am giving away one signed copy of The Truthful Art! Register on the Giveaways Page by April 30th to be entered.

The Truthful Art explains:

• The role infographics and data visualization play in our world

• Basic principles of data and scientific reasoning that anyone can master

• How to become a better critical thinker

• Step-by-step processes that will help you evaluate any data visualization (including your own)

• How to create and use effective charts, graphs, and data maps to explain data to any audience

Alberto Cairo is the Knight Chair in Visual Journalism at the University of Miami, where he teaches courses on infographics and data visualization. He is also director of the Visualization program of UM's Center for Computational Science, and Visualization Innovator in Residence at Univisión, besides being a consultant for several tech companies. He is the author of the books The Functional Art: An Introduction to Information Graphics and Visualization (2012) and The Truthful Art: Data, Charts, and Maps for Communication (2016).

Everyone should follow Alberto Cairo on Twitter (@albertocairo)! He is one of the most vocal dataviz experts online, and shares his wisdom and insights openly. Also, you can download a sample of the new book with the first 40 pages of the book available on Google Drive.

I sent Alberto a handful of questions about The Truthful Art:

Who is the book intended for?

In the Epilogue I joke that I wrote 'The Truthful Art' for my past self, 8 or 10 years ago. As a journalist and designer, I didn't receive appropriate training in data reasoning in college, and that led me to make many mistakes in my career. The book is for communicators of any kind (journalists, graphic designers, marketing folks) who need to deal with data on a regular basis. It's certainly a book about data visualization and infographics, but it also covers the steps that come before you start designing anything: Getting your information as right as possible.

How do you define the difference between a visualization and an infographic?

In the book I explain that the boundary between these and other genres is very fuzzy. For me, an infographic is a combination of words and visuals (charts, maps, diagrams, illustrations) that makes a certain story understandable for people. The designer decides what data to show, and how to structure it, sometimes as a narrative or story. A data visualization doesn't necessarily tell a story, but it enables people to come up with their own conclusions, by letting them explore the information. Infographics emphasize explanation, data visualizations emphasize exploration.

What does it mean for a visualization to be truthful?

The whole book deals with this topic. In general, it requires a proper, honest, and thorough exploration of your information; asking people who know more than you do about it; and then a proper choice of visual forms to represent it.

Why are we more likely to accept visual information as truth?

It's not just visual information, it's any kind of information. We human beings aren't skeptical by nature. Our default is belief.

It is only when we become aware of the multiple ways our own brain, and other people, can trick us that we begin questioning what we see, read, hear, and feel. It is true, though, that recent research has shown that visualizations make messages more credible; this is something that can be used for good or for evil.

I don't know why many of us tend to take visualizations at face value, but it may have to do with the fact that most of us unconsciously associate charts and data maps with science. Those graphics look so precise, so crisp, so elegant! They must be accurate and truthful, right? --Well, perhaps not!

How difficult is it to choose the right chart style?

Not that difficult if you think about the message that you want to convey, or the tasks you want to enable, instead of relying just on your personal aesthetic preferences. I love maps, and I wrote an entire, long chapter about them for the book, but that doesn't mean that everything should be a map. A map may give you certain insights, but may also obscure others. In many cases, a chart may be better.

How can we become better skeptics and critical thinkers when we see data visualizations?

The key is to remember a maxim that I repeat in the book: A visualization is not something to be seen, but something to be read. Approach data visualizations and infographics not as beautiful illustrations (although beauty is a very important feature) to be looked at quickly, but as visual essays. Read them carefully, ask yourself if the designer is showing everything that needs to be shown. Remember that a single number or variable means very little on its own. In infographics, context is everything, and comparisons are paramount.

Is complexity the enemy of good data visualization design?

Far from it. Many designers believe that data visualizations and infographics are intended to “simplify” data. As my friend, the designer Nigel Holmes, has repeatedly said, infographics shouldn't simplify, but clarify. Clarification in some cases means reducing the amount of information you present, but in many others it requires you to increase it. In the book I show some examples of graphics that fail because their designers reduced the data so much that they rendered it meaningless. If a story is complex, its representation will necessarily be complex as well.

This said, it is good to be reminded of that old maxim commonly attributed to Einstein: Everything should be as simple as possible, but not simpler. Over-complicated visualizations are also problematic. If your message is simple or trivial, why creating an extremely intricate graphic?

What’s available for readers on the book website: http://www.thefunctionalart.com/p/the-truthful-art-book.html?

For now, www.thefunctionalart.com contains my blog, contact information, information about both books, and some other resources. I have added software tutorials, and will soon post some of the data from the book. My professional website, http://www.albertocairo.com/, which will be launched soon, will contain more resources.

Are you speaking at any upcoming presentations or webinars?

Yes. I post most of my speaking engagements and consulting gigs here: http://www.thefunctionalart.com/p/speaking-schedule.html

Where’s the best place to follow you online?

My blog and Twitter. I use Twitter (@albertocairo) to take notes for myself, and save interesting resources, so if you want to see what I see or read what I read, that's the place to go!


Tuesday
Feb092016

O'Reilly Strata Conference Discount & Giveaway

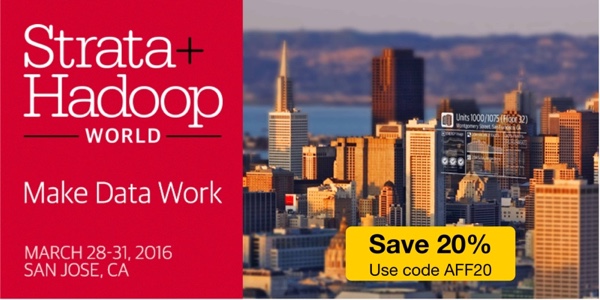
The O'Reilly Strata+Hadoop World conference is coming up quickly on March 28-31 in San Jose, CA.

First, I have a discount code from O'Reilly that will get you 20% OFF the registration cost! Click this link, and use the code AFF20 during checkout to get the 20% discount.

Second, this month's giveaway is one free Bronze pass to the Strata conference! Register on the GIVEAWAYS page before 11:59pm CT on February 29, 2016 to be entered. I will randomly chose a winner on March 1st.

Monday
Dec072015

Giveaway: One O'Reilly Design Conference Pass

This month I have ONE conference pass to O'Reilly Design: Design The Future in San Francisco, CA from January 20-22. Conference pass only, any other expenses are your responsibility.

Register HERE by 11:59pm on December 31, 2015 to be entered. A winner will be randomly selected on Jan 1st.

I'll be going to the conference as well, so let me know on Twitter @rtkrum if you're going or will be in the San Francisco area that week!

This a new conference being held for the 1st time! The O’Reilly Design Conference is where interaction designers, UX designers, user researchers, product designers, product managers, and entrepreneurs will explore new ways design will shape the future. This three-day conference is a deep-immersion experience focused on providing designers with the full stack of skills they need to remain competitive and create the next generation of products and services.

If you are interested purchasing conference passes, click this LINK and use the discount code AFF20 to get 20% OFF the cost of the conference passes.

Friday
Nov062015

Giveaway: Visme Full Premium Subscription for One Year

I have ONE Visme Full Premium Complete Subscription to give away in November! I love this giveaway! Regular value $192

Register HERE by 11:59pm on November 30, 2015 to be entered.

A winner will be randomly selected on Dec 1st.

Easily create powerful Presentations and Infographics with full access to all of the premium features including infographic widgets, custom icons, templates, millions of free images, thousands of free vector assets, charting tools, private projects and engagement tracking for your content.

Check out the Visme site to see all of the features!

Monday
Oct122015

Giveaway: Data Visualization Training Video Package

I have ONE Data Visualization - 5-Course Video Training package from O'Reilly to give away in October! This is a great giveaway! Regular price $309.99, Over 14 Hours of online training

Register HERE by 11:59pm on October 30, 2015 to be entered.

A winner will be randomly selected on Oct 31st.

Successful data visualizations allow you to impart meaning and emphasis to your data points. This Learning Path will teach you how to display trends, patterns, and outliers while you discover the power of letting your data to speak. Once you’ve finished, you’ll be able to efficiently communicate volumes of data with ease. The Data Visualization training package includes all five course videos:

  1. An Introduction to d3.js: From Scattered to Scatterplot, Presented by Scott Murray | 2 hours 52 minutes
  2. Learning to Visualize Data with D3.js, Presented by Rafael Hernandez | 3 hours 52 minutes
  3. Using Storytelling to Effectively Communicate Data, Presented by Michael Freeman | 1 hour 30 minutes
  4. Effective Data Visualization, Presented by Jeff Heer | 2 hours 52 minutes
  5. Intermediate D3.js, Presented by Scott Murray | 3 hours 38 minutes
Wednesday
Sep162015

Giveaway: One Pass to Strata NYC Conference

I am pleased to announce the new Cool Infographics Giveaways page. I frequently have stuff donated to giveaway to the readers of Cool Infographics. Books, conference tickets, subscriptions, training courses, etc. My plan is to give something away each month, so check back often to register for the latest giveaway!

This month I have ONE conference pass to the Strata-Hadoop World conference in New York City from September 29 - October 1st. That's only TWO WEEKS away! Register by the end of the day on September 24th, and I will give away the pass on Friday, September 25th.

Register HERE

Page 1 2