About
Randy Krum
President of InfoNewt.
Data Visualization and Infographic Design

Infographic Design

Infographics Design | Presentations
Consulting | Data Visualizations

DFW DataViz Meetup

Join the DFW Data Visualization and Infographics Meetup Group if you're in the Dallas/Fort Worth area!

Search the Cool Infographics site

Custom Search

Subscriptions:


Feedburner

The Cool Infographics® Gallery:

How to add the
Cool Infographics button to your:

Cool Infographics iOS icon

- iPhone
- iPad
- iPod Touch


Read on Flipboard for iPad and iPhone

Featured in the Tech & Science category

Flipboard icon

Twitter Feed
From the Bookstore

Caffeine Poster

The Caffeine Poster infographic

Entries in Visualization (49)

Friday
Jan172014

Where in the World are the Best Schools and the Happiest Kids?

The Best Schools and the Happiest Kids infographic

The best test scores don’t always mean the happiest kids at school.  The Best Schools and the Happiest Kids visualizes the results from a worldwide survey of over 500,000 15-year-olds globally.

The Organisation for Economic Co-operation and Development’s triennial international survey compared test scores from 65 countries. Happiness was ranked based on the percentage of students who agreed or disagreed with the statement “I feel happy at school.” Test scores were ranked based on the combined individual rankings of the students’ math, reading, and science scores.

I can’t tell for sure, but it appears that Jake Levy, Data Analyst at BuzzFeed created this data visualization based on the data from OECD survey results.  Infographics like these often get shared without the rest of the article, so it’s important to include all of the necessary framing information in the graphics itself.  Title, descriptive text, sources, URL, publishing company, copyright, etc.

Thanks to Ron Krate on Google+ for posting

Monday
Dec022013

NFL Concussion Watch 2013

NFL Concussion Watch 2013 infographic visualization

PBS Frontline has published the interactive data visualization, NFL Concussion Watch 2013 to summarize all of the player concussions reported in the NFL.

Every week in the National Football League, a player is sidelined by a head injury. In some cases, their symptoms are clearly visible and they exit the game. Other times, less obvious warning signs can mean a missed diagnosis and a return to the field. Either way, research indicates that the long-term health effects of such injuries — including memory loss, depression and even dementia — can pose problems for players long after retirement.

Concussion Watch is an effort to monitor the NFL’s response to the persistent risk of head injury in professional football. To do so, FRONTLINE will track which players are being removed from games after a hit to the head — and which players are not — and keep score of how long they are kept from the field following a concussion.

I really like the idea of this data visualization, but they messed up the visuals.  The circle sizes are supposed to change relative to the values, but they’re not correct.  The designer chose to make the circles for 1-3 too large in order to fit the numbers inside the circles, and 4-5 are larger but the same size.  The choice of aesthetics over accuracy is a common mistake, and creates a false visual to the readers.  It’s the wrong choice.  Accuracy of the data visualization is more important than any other part of the design.

In visualizations, the design is supposed to visually compare values to create context and understand for the readers.  Because some of these circles are larger than their actual values, this creates the impression that most of the football positions have similar risk, instead of clearly highlighting how less risky some positions truly are.

I do like the design layout that places the circles into their correct player positions.  Readers can grasp this layout in a fraction of a second, and understand where the riskiest positions are.

Thanks to Melanie for sending in the link!

Thursday
Nov212013

Finding Waldo by Visualizing Patterns

Where's Waldo BooksGraphic by Slate. Illustration by Martin Handford published by Candlewick Press.

Here’s Waldo is a great analysis and article by Ben Blatt on Slate.com about trying to determine a strategy for finding Waldo by visualizing patterns from the Where’s Waldo series of books.

In Chapter 1: The Science of Infographics of my new book, Cool Infographics, I cover that our ability to see patterns is a huge factor in why data visualizations and infographics are so effective.  Humans can see patterns and recognize differences where computers can’t.  You can read about this topic and more in the Free Sample Chapter available for download.

Illustrator Martin Handford published the first in his beloved series of Where’s Waldo books over 25 years ago.* The books challenge readers to find the titular cartoon man, clad in his trusty red-striped shirt and red-striped hat, as he hides in a landscape of red-striped red herrings. When attempting to find Waldo you can scan the page completely from top to bottom, or you can focus your search around certain landmarks where Waldo seems likely to be hiding (in a castle’s moat, riding a blimp). Neither approach is particularly efficient. Which got me to wondering: What if there’s a better way?

I sought to answer these questions the way any mathematician who has no qualms about appearing ridiculous in public would: I sat in a Barnes & Noble for three hours flipping through all seven Where’s Waldo books with a tape measure.

The map born of my experiment is below.

Mapping Waldo Locations

It may not be immediately clear from looking at this map, but my hunch that there’s a better way to hunt was right. There isn’t one corner of the page where Waldo is always hiding; readers would have already noticed if his patterns were so obvious. What we do see, as highlighted in the map below, is that 53 percent of the time Waldo is hiding within one of two 1.5-inch tall bands, one starting three inches from the bottom of the page and another one starting seven inches from the bottom, stretching across the spread.

Finding Waldo Patterns

Check out the complete story on Slate.com

Found thanks to a post by Mike Elgan on Google+!


Thursday
Nov072013

Most Popular Pizza Chains Map Visualization

Most Popular Pizza Chains infographic

FlowingData has released a fantastic map visualization of the Most Popular Pizza Chains in the United States.

Most of the major pizza chains are within a 5-mile radius of where I live, so I have my pick, but I usually order from whatever place is closest to where I am. So it doesn’t matter if there are more Domino’s locations than Pizza Huts where I live. I just want my feeding time to come sooner rather than later, and if that place happens to be Pizza Hut so be it. (Although, if I’m not in a rush, I’ll go to the local sit-down place.)

This is the point of the map above, which shows the nearest pizza place within a 10-mile radius across the United States. Nice and clean data courtesy of AggData.

You can also see the major chains individually:

Most Popular Pizza Chains Separate Maps

Found on LaughingSquid.

Now I’m hungry.

Tuesday
Oct222013

Strata Conf London Nov 11-13 - 20% Discount Code

O'Reilly Strata Conference: London, England


If you have any thoughts of attending the 2013 Strata Conference in London, England, the discount code “AFF20” will cut 20% off the registration price for readers of Cool Infographics!  Big data, visualization, privacy, science and business!  What’s not to love?!?

This is an expensive conference, so the 20% discount is a BIG deal; saving hundreds of dollars!  The 2013 conference will run from November 11-13, 2013 in London, England.

The future will be data-driven.  But who’s driving the data?

If it’s you—or it should be you—join us at Strata Conference to explore the opportunities made possible by the latest state-of-the-art data tools and analytic approaches.

Get the skills, tools, and technologies to make your data work successfully today—and the insights to plan for a data-driven future.


Friday
Sep062013

Visualizing the Microsoft-Nokia Deal

Visualizing the Microsoft-Nokia Deal

Good data visualization uses visuals to put data into context for the readers, making the information easier to understand.  This simple infographic takes a couple charts previously published by Nielsen, and uses them to provide context to the news story of Microsoft acquiring Nokia’s handset devices unit for $7.2 Billion.

Combining data visualization with text and images should make the information easier and faster to understand, and this design does a great job.

Designer unknown.  Thanks to Mike Elgan for posting on Google+ and Luke Millar (@ltm) for posting on Twitter.

Tuesday
May072013

Visualizing the School of Design

Visualizing the School of Design infographic

Visualizing the School of Design is a very data dense infographic poster that analyzes the School of Design at the Politecnico di Milano.

Politecnico di Milano, in order to present the School of Design in its own stand at Salone del Mobile 2013, asked DensityDesign to realize a 4 mt x 2 mt poster showing the structure and the efficiency of the School of Design system at Politecnico. The visualization is a picture of the 2010 / 2011 academic year.

Definitely take a look at the full-size version to appreciate the thought and effort put into the design.  This project was amazingly developed in one week by the team at DensityDesign.

Visualizing the School of Design close up

Found on Datavisualization.ch


Friday
Apr262013

2,000 Years of Continental Climate Changes

2,000 Years of Continental Climate Changes

Climate change is a complicated, and sometimes controversial, global topic.  I really like this data visualization of 2,000 Years of Continental Climate Changes that was included as part of the report published by the “2K Network” of the International Geosphere Biosphere Program (IGBP) Past Global Changes (PAGES) project.

Thirty-year mean temperatures for the seven PAGES 2k continental-scale regions arranged vertically from north to south. Colors indicate the relative temperature. The most prominent feature of nearly all of the regional temperature reconstructions is the long-term cooling, which ended late in the19th century. North America includes a shorter tree-ring-based and a longer pollen-based reconstruction. Modified from: PAGES 2k Consortium, 2013, Continental-scale temperature variability during the past two millennia, Nature Geoscience, DOI:10.1038/NGEO1797.

Each color band represents a 30-year mean temperature found on each continent.  Their choice of data visualization method is very compelling, and visualizes a huge amount of data in a small space.

I also love that a good data visualization can attract attention and build awareness all by itself.

Found on the post by Andrew Revkin on the NY Times Dot Earth blog.

Friday
Mar222013

460 Million Connected Internet Devices

Beautiful data visualizations of some very scary data!  

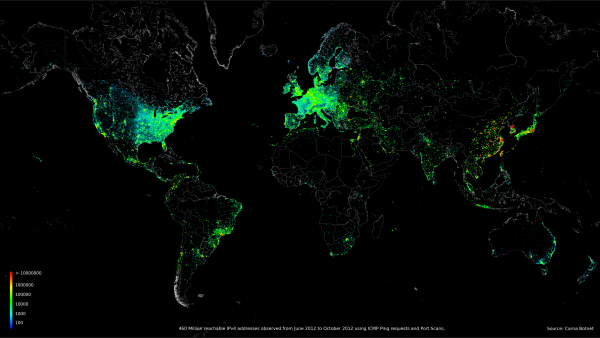
An anonymous hacker under the pseudonym of “Carna Botnet” has posted a comprehensive Internet Census 2012 report of over 460 million internet connected devices that responded to PING requests or were found to have open ports.  He was able to create a botnet using over 30,000 Internet devices that had remote administration available using the Telenet and still had the factory installed standard passwords.  He found several hundred thousand open devices, but didn’t need that many.

Abstract: While playing around with the Nmap Scripting Engine (NSE) we discovered an amazing number of open embedded devices on the Internet. Many of them are based on Linux and allow login to standard BusyBox with empty or default credentials. We used these devices to build a distributed port scanner to scan all IPv4 addresses. These scans include service probes for the most common ports, ICMP ping, reverse DNS and SYN scans. We analyzed some of the data to get an estimation of the IP address usage. 

All data gathered during our research is released into the public domain for further study. 

The visualizations he was able to create using the gathered data are fantastic.  Check out the IMAGES page of the report for beautiful, high-resolution images.

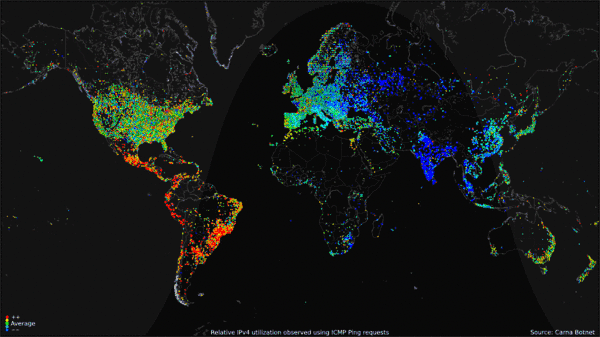
The map visualization above shows the geolocation data of all 460 million devices that responded to the queries from the botnet, clustered around population centers as you might expect.  The animated GIF below shows the geolocated devices that responded during the course of a day, showing that many devices are turned off overnight but many more are just left on constantly.

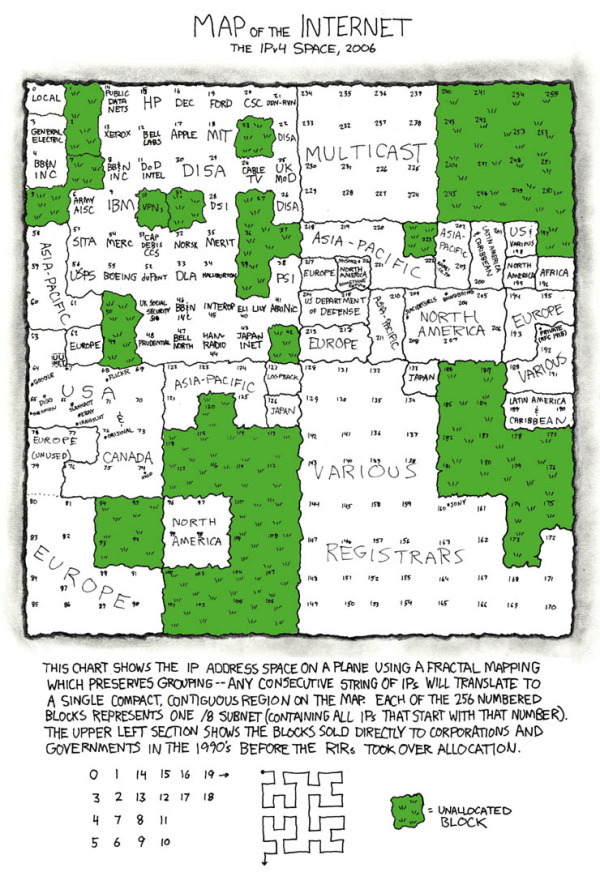
My favorite visualization from the data is the Hilbert Map, which uses the a 2-dimensional Hilbert Curve to map out the continuous sequence of IP4 addresses into a square area, and then color-codes the address blocks that responded to a PING request.  There’s even a cool zoomable viewer of the Hilbert Map that lets you drill into the details.


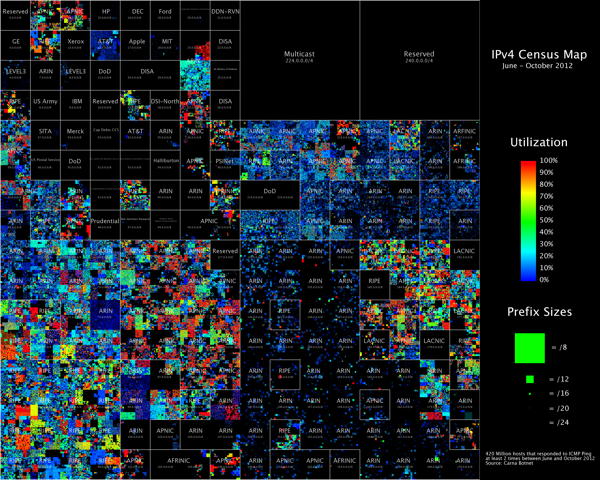
This form of mapping was inspired by the xkcd Map of the Internet, which shows the Internet addresses that were distributed to major corporations in the 1990s before the Regional Internet Registries took over the allocation.


Found on the Security Now podcast #396 and FlowingData

Monday
Mar182013

See Conference April 20th

see#8 | 20 APRIL 2013 | SCHLACHTHOF WIESBADEN from Scholz & Volkmer GmbH on Vimeo.


I really wish I could make it to the See Conference (The Conference on Visualization of Information) in Germany (www.see-conference.org).  This year looks like they have a great conference lined up!

For eighth years now the see conference has been gathering the most creative people and exciting ideas on the topic of information visualization. The interdisciplinary platform brings together fields like design, art, architecture and new technologies. Our international speakers will show the latest ideas and approaches on how to deal with the current flood of information, on how to visualize it and turn it into something that can be experienced. Among our new speakers at see#8: Data journalist Francesco Franchi, Dutch design studio Catalogtree and British-born Antony Turner from Carbon Visuals. More info regarding program and tickets at www.see-conference.org

Event: see conference #8 
Date: 20 April 2013 
Location: Wiesbaden, Germany 
URL: www.see-conference.org

If you have a chance to make it to this conference, I would highly recommend it.  When I looked today, there were only 161 seats left!

Let me know what you think if you make it to the conference!