About
Randy Krum
President of InfoNewt.
Data Visualization and Infographic Design

Infographic Design

Infographics Design | Presentations
Consulting | Data Visualizations

DFW DataViz Meetup

Join the DFW Data Visualization and Infographics Meetup Group if you're in the Dallas/Fort Worth area!

Search the Cool Infographics site

Custom Search

Subscriptions:


Feedburner

The Cool Infographics® Gallery:

How to add the
Cool Infographics button to your:

Cool Infographics iOS icon

- iPhone
- iPad
- iPod Touch


Read on Flipboard for iPad and iPhone

Featured in the Tech & Science category

Flipboard icon

Twitter Feed
From the Bookstore

Caffeine Poster

The Caffeine Poster infographic

Entries in web (190)

Tuesday
Dec032013

Understanding Healthcare.gov’s Rocky Rollout 

Understanding Healthcare.gov’s Rocky Rollout infographic

Understanding Healthcare.gov’s Rocky Rollout infographic from SEER by Galorath is a very tall infographic design that does a thorough job of examining the Healthcare.gov site rollout.

Galorath Inc. (the SEER Cost, Schedule, Risk Model Developers) watched the healthcare.gov rollout difficulties, the outcries and finger pointing and decided to take a more analytical look. While it is easy to throw stones at stakeholders, this was a huge IT project and there were bound to be challenges. Could it have gone better? Sure. Were there adequate resources? Seems so. Should testing and quality assurance been more rigorous? Yes, but there didn’t appear to be adequate time. Were the requirements firmed up in advance? That could have been a significant contributor.

Although longer than I usually like for infographic designs, this one tackles a fairly complicated topic and breaks it down nicely.  The use of icons and minimal text make this design easy for readers to skim through, but read the details they are interested in.

Also available as a large, high-resolution PDF for download.

Thanks to Shell for sending in the link!

Friday
Nov292013

Seven Myths of Email Marketing

Seven Myths of Email Marketing infographic

The Seven Myths of Email Marketing infographic from Alchemy Worx addresses many of the misconceptions about email marketing head on.

Many beliefs that email marketers hold true regarding email are simply false, according to research and analysis conducted by my email marketing agency, Alchemy Worx. We analyzed data sourced from our work with customers and industry figures to arrive at our conclusions.

Here are seven such email myths, which are also presented in an infographic at the end of this article.

Great information with fun illustrations that attract viewers.  The statistics should be visualized though, instead of just shown in text.  Big fonts are not data visualizations, and don’t make the data any easier to understand for the readers.

Footer has good information with full links to the sources, a clear copyright and the company logo.  It’s only missing the URL link back to the infographic landing page so readers can find the orignal when people post it without a link back to the Alchemy Worx site.

Thanks to Christine for sending in the link!


Monday
Nov252013

How NOT To Look Ugly on a Webcam

How NOT To Look Ugly on a Webcam infographic

How NOT To Look Ugly on a Webcam from Mixergy and Lemon.ly lays out the top 10 tips for successfully using your webcam.

No matter who you are and how good you look, it’s pretty easy to look terrible on a webcam. We teamed up with our friends at Mixergy to showcase just how NOT to look bad on a webcam with this handy infographic. By just following a few of our easy webcam tips, you’ll look as good as you feel in your next webcam interview. What do you think? Have any other tricks to add?

Nice instructional how-to infographic.  There’s no data visualized, just illustrations of the 10 tips.  Quick and easy to read.  This design also has a long Online Lifespan.  The topic is so universal, the infographic will be relevant for years!

The footer should include the text URL link to the infographic landing page on either Mixergy or Lemon.ly so when readers see smaller thumbnail versions posted on Facebook, Pinterest, Twitter, Google+ or blogs without a link, they can still find the original full-size version!

Thanks to @jasongaloob on Twitter for the link!


And Guy Kawasaki on Facebook:

Friday
Nov222013

EFF Encrypt The Web Report

EFF Encrypt The Web Report infographic

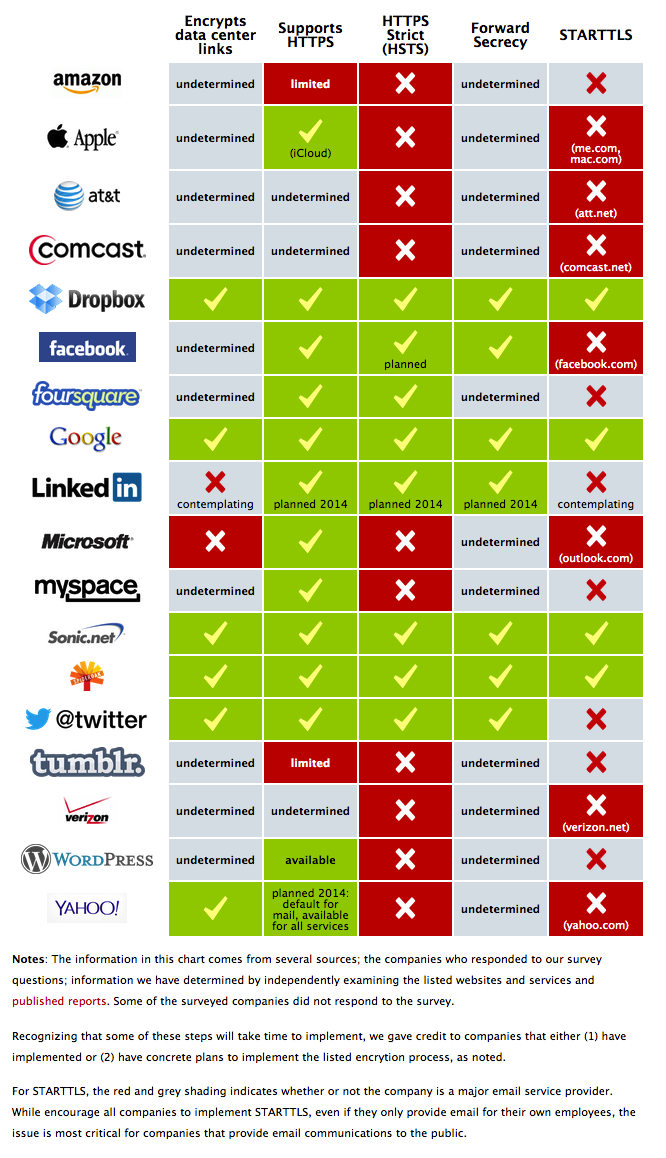
The EFF recently released their Encrypt The Web report and included the cool infographic above.  

We’ve asked the companies in our Who Has Your Back Program what they are doing to bolster encryption in light of the NSA’s unlawful surveillance of your communications. We’re pleased to see that four companies—Dropbox, Google, SpiderOak and Sonic.net—are implementing five out of five of our best practices for encryption. In addition, we appreciate that Yahoo! just announced several measures it plans to take to increase encryption, including the very critical encryption of data center links, and that Twitter has confirmed that it has encryption of data center links in progress. See the infographic.

By adopting these practices, described below, these service providers have taken a critical step towards protecting their users from warrantless seizure of their information off of fiber-optic cables. By enabling encryption across their networks, service providers can make backdoor surveillance more challenging, requiring the government to go to courts and use legal process. While Lavabit’s travails have shown how difficult that can be for service providers, at least there was the opportunity to fight back in court.

While not every company in our survey has implemented every recommendation, each step taken helps, and we appreciate those who have worked to strengthen their security. We hope that every online service provider adopts these best practices and continues to work to protect their networks and their users.

Crypto Survey Results

UPDATE, November 20, 2013: Facebook and Tumblr have provided further information to supplement the Encrypt the Web Report. We’re pleased to report that Tumblr is planning to upgrade its web connections to HTTPS this year and implement HSTS by 2014, and Facebook is working on encrypting data center links and implementing STARTTLS.

Great visual table array design that uses the company logos instead of text to make it easier for readers.  The color-coding in each cell is also super-easy for readers to follow.  It only takes seconds to skim through the design.  The data is clearly communicated to the audience!

However, as an infographic released on the web, it’s missing a number of key features.

  • No title.  The infographic image will be shared on other sites, so the image file itself needs to have a title and a short introduction to what readers are seeing.
  • No date.  This information will obviously change over time, and they have already added the update you see in the text above.  This infographic should clearly state that this information is current as of 11/20/13 so they can make future updates.
  • No logo.  Someone seeing this infographic posted anywhere else would have no idea that it comes from the EFF.  The EFF brand has a lot of positive equity and the infographic would be more believable if readers know if comes from the EFF
  • No copyright.  The EFF would probably release this under Creative Commons, but that needs to be explicitly stated in the infographic itself.
  • No original URL.  The URL link to the original landing page on the EFF site should be included in the footer of the design so readers can find the original full-size version when they see smaller thumbnails posted on other sites.

Thanks to Mervik Haums for posting it on Google+!


Wednesday
Nov202013

The Online Shopping Cart Experience

Shopping Cart Experience infographic

Online shopping is a convenience that a lot of people take advantage of. But the convenience varies. The Shopping Cart Experience infographic from checkoutoptimization.com finds the optimal situation to make customers happy.

Over the course of the last few years, I have been in and out of the details of conversion rate optimization. My career at a digital marketing agency affords me the privilege of working with some of the top brands in the world. I am equally lucky to know some great entrepreneurs with very small businesses. Among the fascinating things that I get to see every day and across the spectrum is how much of an impact a small improvement at the checkout makes.

Simply, more sales equals more sales. Given finite resources to optimize a thousand different things, I’m awestruck that the shopping cart is not a greater focus. And as sites have changed in incredible ways over the last few years, shopping carts remain unchanged.

In 2009 I thought about this issue and started researching attributes across a number of shopping carts. It was a story of small diversity and great uniformity. I started writing a book on the subject, but I shifted focus to double down and grow a separate business. (Which has been extremely rewarding and I now get to work with a growing group of talented, bright, extremely funny people that are accomplishing amazing things for the world’s coolest brands, but that’s another story.) A couple of months ago, I came back to the idea of checkout optimization, and thought it would be really interesting to compare my 2009 research to the current state of things.

And that’s how this infographic came to be. My hope is that this is useful to anyone curious about shopping cart design patterns, or perhaps someone looking for a standard to measure up against. Let me know what you think, and you want more like this, you can sign up here.

Nice overview of the differences sites choose when setting up checkout pages on e-commerce sites.  Some of the subtle visualizations work very well, like the multiple pages shown behind the numbers in the User Friendly section.  However, some values aren’t visualized at all, like the percentages for the different merchant features.

The infographic landing page explicitly asks people to repost the infographic with links back to the original page, but sadly, most people don’t do that.  The landing page URL should be included in the infographic image itself so readers can find the original when bloggers don’t include the link.

Thanks to Nicholas for sending in the link!

Thursday
Sep192013

A Visual Guide to What Colors Communicate

The Essential Guide to What Colors Communicate infographic

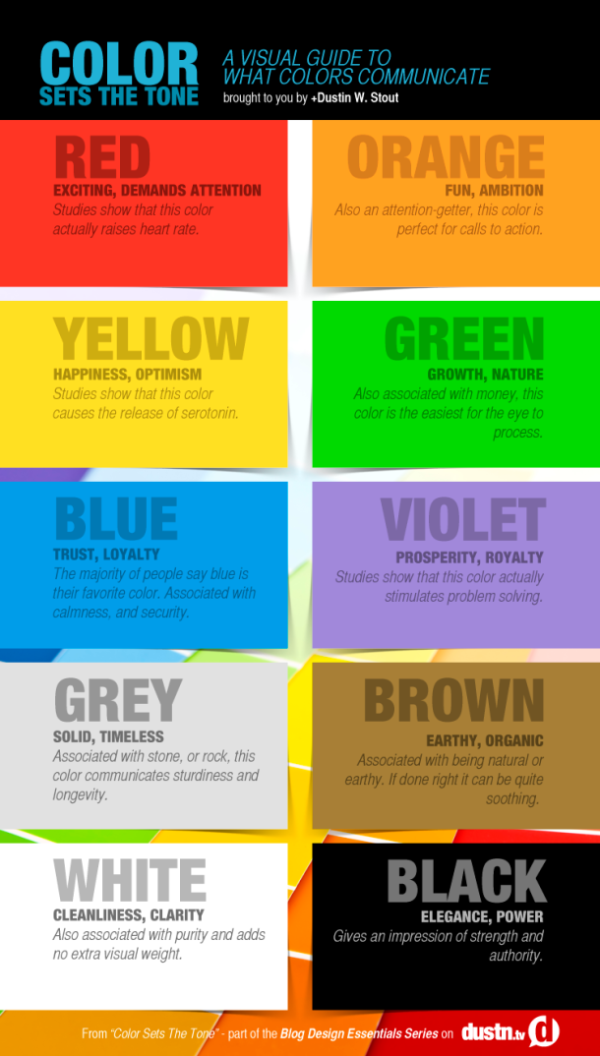
When you are designing your blog or website, how do you decide what colors to use? Your choice will make a difference on how others receive and interpret your content. Dustin Stout from dustn.tv has created Color Sets the Tone: A Visual Guide to What Colors Communicate infographic to educate website builders and bloggers on how to communicate to their readers with color.

Did you know that colors communicate? The use of color in your blog design can be an essential part of how your personal brand is perceived. Color usage can either make or break your blog design, and I will show you how to choose your colors wisely by understanding what they communicate.

When new visitors land on your blog, the first things they interpret are colors. Before they read a single character, their brain is registering colors which are subconsciously (or consciously) tied to emotions, states of mind, or [preconceived ideas]. If you do a poor job at putting together the colors in your blog design, it can be detrimental to the growth of your brand.

I’ve come up with an essential guide to what colors communicate, as well as a quick infographic to reference that is free to download! 

Simple design that tells one story really well.  Quick and easy for readers to digest, and the text associated with each color is really short.  Less text is better for infographics.

The footer should include the URL back to the landing page to make it easier for readers to find the full-size original version.

Found on http://dustn.tv/what-colors-communicate/

Tuesday
Aug272013

World's Biggest Data Breaches Visualization

World's Biggest Data Breaches Visualization

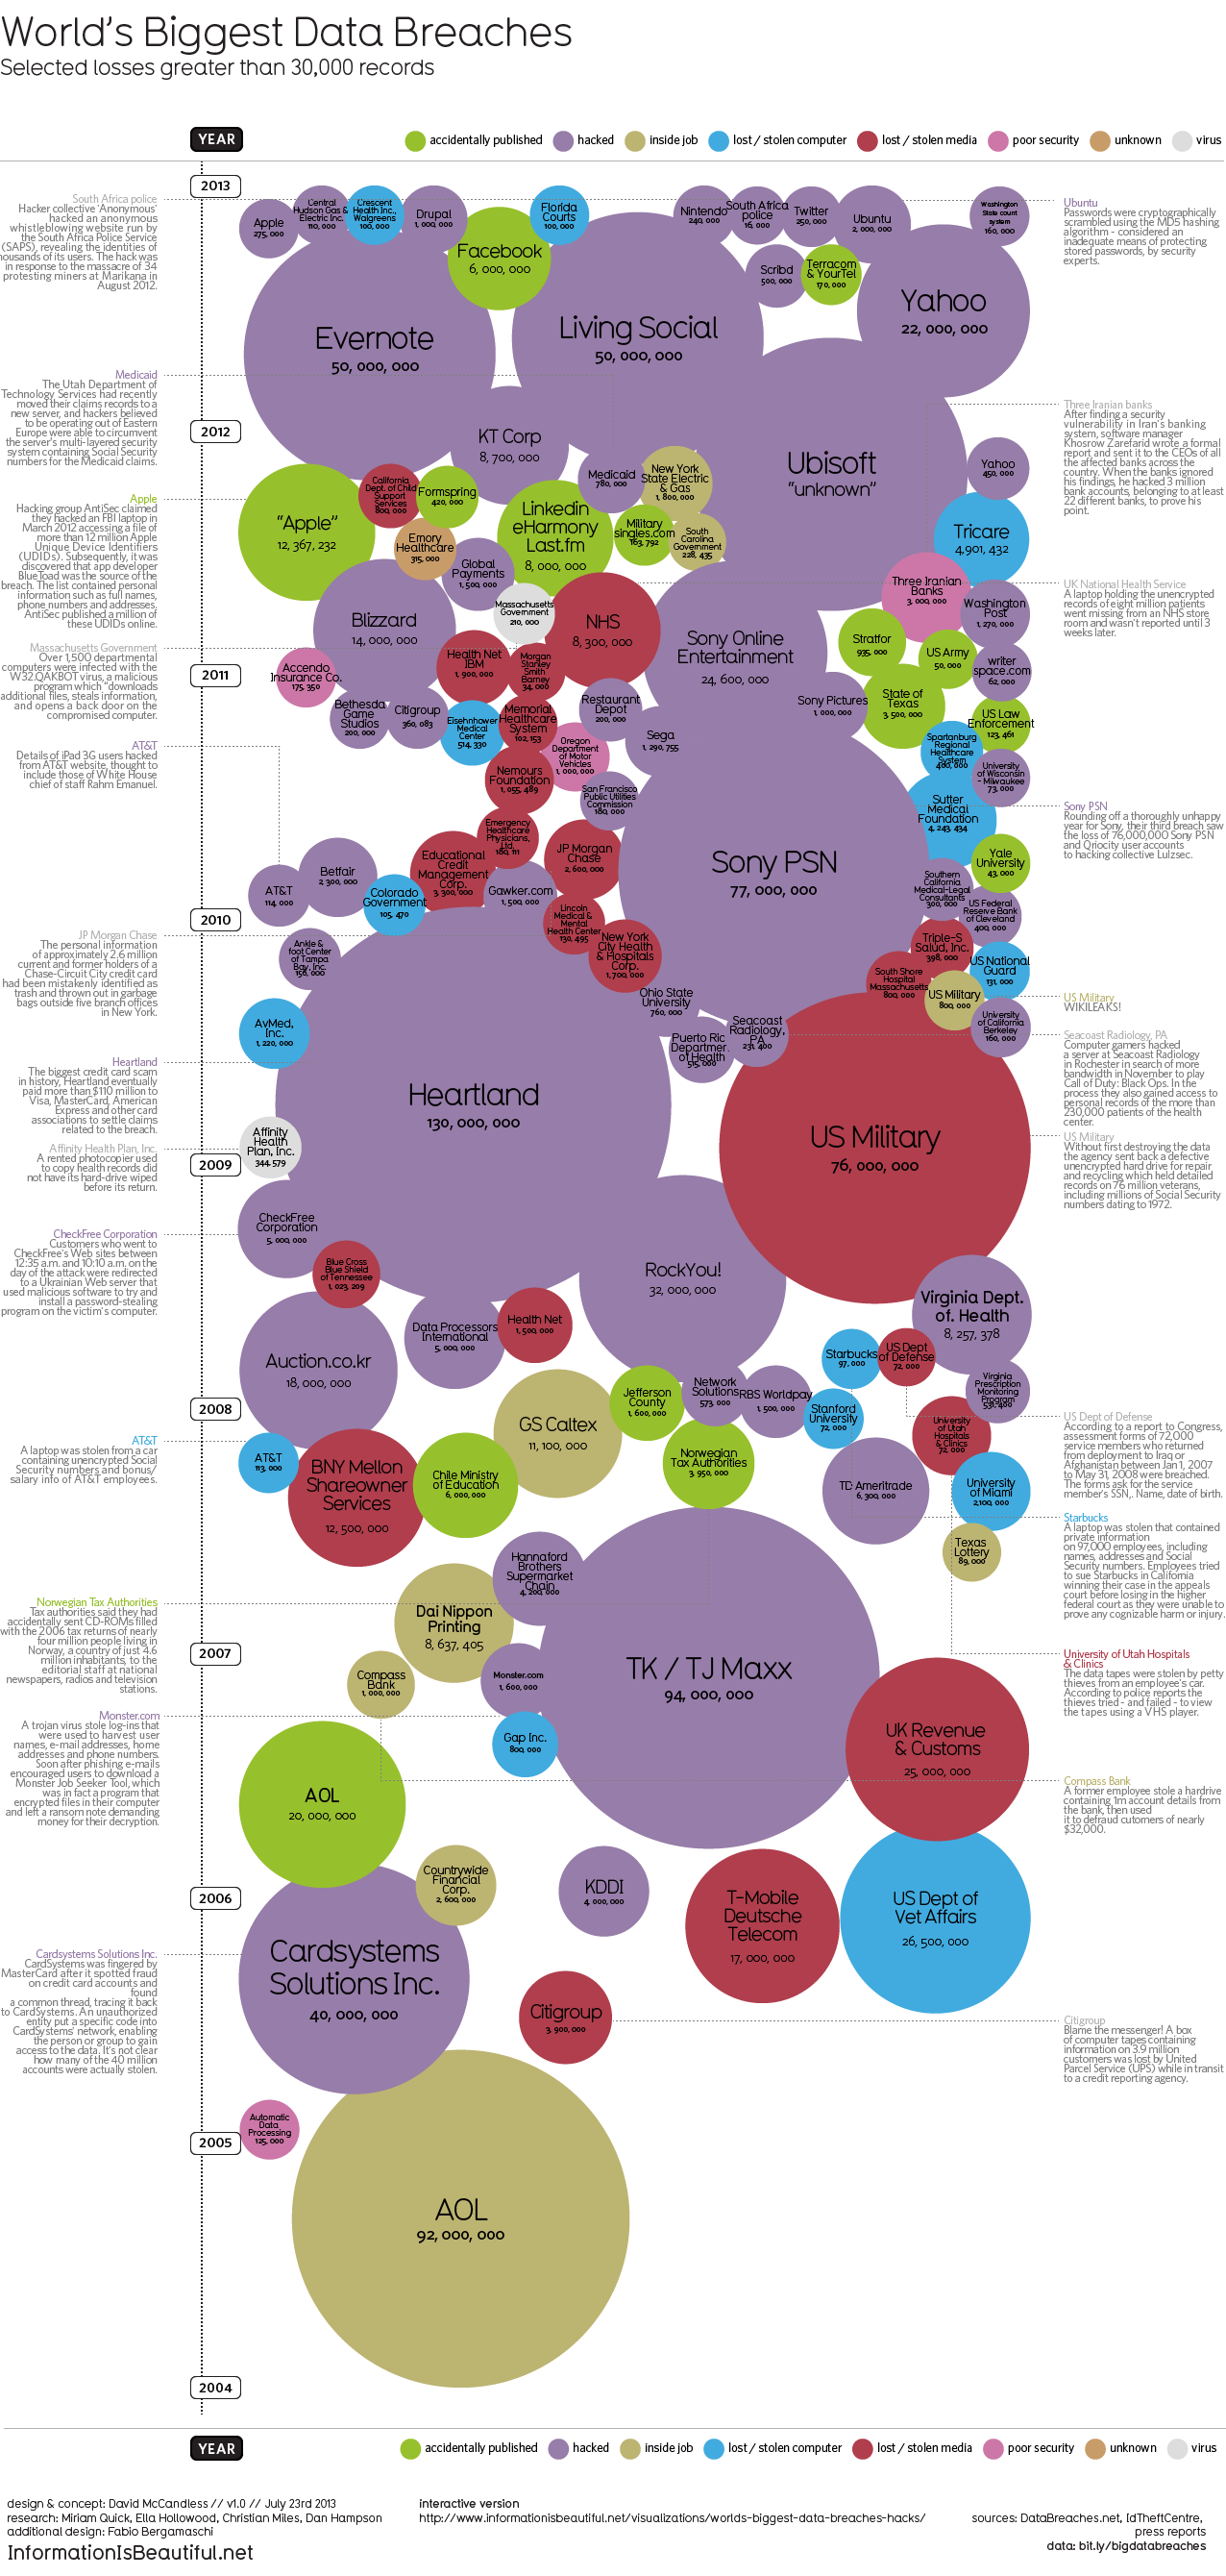
David McCandless and the team from Information Is Beautiful recently released both static (seen above) and interactive versions of the new World’s Biggest Data Breaches visualization.

This weekend, Apple’s developer site was hacked. 275,000 logins, passwords and other records potentially compromised. Two days before that, popular open-source operating system Ubuntu had its forums hacked. 1.82 million records stolen.

Are those big data breaches? Or just pin-points in the big data universe?

We’ve pulled out the interesting and funny stories out of the data. Click on the bubbles to read.

A fantastic design, the interactive version allows you to adjust the sorting, circle size and color-coding parameters.  It’s very easy for the reader to understand how one data breach fits into the overall history of stolen data.

In a move for transparency, the entire data set gathered and used in the design is available publicly to anyone through a Google Docs Spreadsheet.  Anyone can access the source data to verify the visualization or to create their own.

Found on Fast Company

Wednesday
Aug212013

A Website Design Process

A Website Design Process infographic

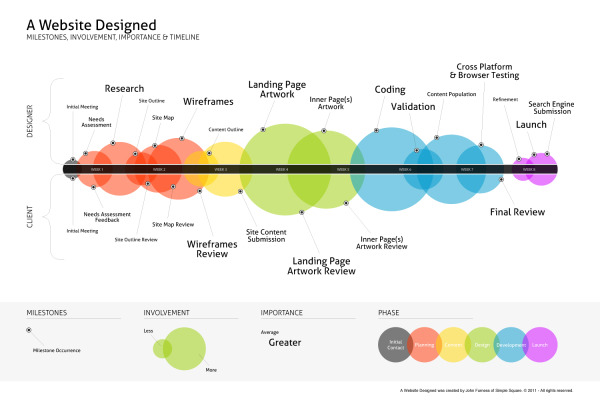
A Website Designed is a process explanation infographic, created by John Furness of Simple Square, highlights the phases of creating a website for a designer and the client. 

A Website Designed is an infographic of the average website’s creation. Feel free to download and share this, or link directly to it here on our blog.

Great visualization design of a business process.  The sequential events are arranged along a straight timeline, but a number of additional elements of information have been added.  Color-coding, sized circles and milestones all add valuable information to the reader.

A high-resolution PDF is available in multiple languages: English, French, Russian, Spanish, Italian, Hebrew and Dutch.

Found on Simple Square!

Thursday
Aug012013

Choosing a CMS for Your Business

Choosing a CMS for Your Business infographic

This graphic will help you figure out what is the best Content Management System (CMS) for you and your business. Discover what a CMS is, types of CMS, popular CMS, market shares and advantages with, The Most Popular CMS for Your Business Needs infographic posted on Dot Com Infoway

Chennai, India Dot Com Infoway (DCI), a premier IT company providing offshore IT outsourcing solutions to businesses across the globe, has announced the release of its latest infographic, titled “Content Management Systems: Choosing the Right One for Your Business Needs”. The infographic provides a top to bottom look at various CMSs and chalks out a road map for organizations, businesses and individuals looking to choose content management systems perfect for their needs.

The infographic outlines the fundamentals of content management systems, the industries in which they find use and the types of CMSs available. It is replete with information, data, statistics and illustrations such as the date of initial release, the platform used, the latest version, the number of themes it has, average setup and customization cost, average monthly maintenance cost, the number of websites using the CMS, the popular websites that use the platform and the top industries using the CMS.

“With the recent exponential growth of nightly builds of CMSs’ modules and plugins, we thought this would be the perfect time to showcase the CMS industry with an infographic that provides users with an all-around perspective. Our run through of key aspects of various CMSs, will help firms make better business decisions by taking advantage of all the information at their disposal,” said Venkatesh C. R., CEO of Dot Com Infoway.

The infographic also provides statistics on the market share of various content management systems. Based on the analysis and research data, WordPress, with a market share of 54.4%, has a competitive advantage over other top CMSs. Following WordPress, (with margins of difference of more than 45%) are Joomla and Drupal with market shares of 8.9% and 7% respectively.

Personally, I run this site on the Squarespace.com CMS platform, and I’m very surprised that it wasn’t listed in the infographic.  I realize there are over 1,200 CMS platforms, so they had to make some hard choices about which ones to include.

The design does a good job of using the platform logos to clearly identify the different players.  I wish the numerical data associated with each platform was visualized instead of just shown in text.  It very hard for a reader to compare the costs or stats between the platforms when all of the data is only in text.

Also, the data is not clearly sourced.  The sites where the data was gathered from are listed, but no specific links the pages with the actual data used, like market share numbers.  Most of the source sites are actually lookup and comparison tools, so it would be hard to list specific URLs for some of the data.

Found on bestinfographics.co

Friday
Jul122013

Battle of the (Social) Sexes

Battle of the (Social) Sexes infographic

The Battle of the (Social) Sexes infographic from InternetServiceProviders.org explores some of the demographic data behind social media.

You’ve no doubt heard the old, oft-quoted adage, “men are from Mars, women are from Venus,” used to denote the fact that men and women may not always see completely eye to eye. While this light-hearted statement isn’t taken literally, when it comes to the virtual world of Internet interactions, similar sentiments may be formed surrounding the different ways men and women use social networking. While the majority of adults in the US are plugged into some sort of social media outlet, not all of them are used in equal measure, and not all of them are used by both genders equally. For instance, the average Google+ user spend just three minutes per month on the network, while the average Facebook user will spend 405 minutes per month updating statuses, posting pictures, and checking out others’ profiles. So what can be learned about men and women in the world of the web? As is turns out, men and women tend to dominate very different social media networks. The following infographic takes a look at some of the differences between male and female-dominated social media sites: How many users each one has, as well as how they interact.

There’s so really good data they have compiled in here, and most of the data visualizations are easy to understand.  I would not have expected to see that Twitter has 40 million more female users each month.

There are a handful of minor tweaks that would help improve the design:

  • The salmon/orange/peach color for women is unexpected compared to the traditional pink.
  • Go ahead and use the official Twitter and Facebook icons.  No need to design their own.
  • The pie slices for time spent would work much better with colors that are more distinct.  The different shades of gray are very hard to differentiate.
  • For the pie charts, the text label should be placed next to the pie slice its describing, instead of the opposite side as shown in this design.  Flipping the pie charts horizontally would fix that easily.

I appreciate the clear Creative Commons license in the footer, but the URL to the original infographic lansing page is missing.  Since the infographic image file is shared by itself, the URL always helps readers to find the original.

Found on Ragan’s PR Daily