About
Randy Krum
President of InfoNewt.
Data Visualization and Infographic Design

Infographic Design

Infographics Design | Presentations
Consulting | Data Visualizations

DFW DataViz Meetup

Join the DFW Data Visualization and Infographics Meetup Group if you're in the Dallas/Fort Worth area!

Search the Cool Infographics site

Custom Search

Subscriptions:


Feedburner

The Cool Infographics® Gallery:

How to add the
Cool Infographics button to your:

Cool Infographics iOS icon

- iPhone
- iPad
- iPod Touch


Read on Flipboard for iPad and iPhone

Featured in the Tech & Science category

Flipboard icon

Twitter Feed
From the Bookstore

Caffeine Poster

The Caffeine Poster infographic

Entries in Data (85)

Monday
Oct202014

DFW Data Visualization & Infographics Meetup Group

DFW Data Visualization & Infographics Meetup Group

Announcing the launch of the local DFW Data Visualization & Infographics Group through Meetup.com. The group is free to join, and I’m partnering with SMU CAPE to provide us with a location to meet in the Dallas-Fort Worth area. If you’re in the area, please join and share the group with your friends and coworkers!  We strive to be a group of visualizers that includes a mix of marketers, entrepreneurs, managers, researchers, teachers, scientists and of course designers. Anyone that deals with presenting or communicating data.

I’m also looking for potential speakers and future event ideas, so let me know if you, or anyone you know, would be interested in engaging with this group. I would love to schedule a full range of beginner to advanced topics covering data visualization, data communication, infographics, data analysis, charts and graphs, presenting data, visual marketing, infographic resumes, content marketing and more!

Our first event will be November 12th in the SMU CAPE building (Continuing and Professional Education). I’ll give a presentation sharing many Innovative Ways Companies are Using Infographics, and the group will have an open discussion about the kinds of speakers, topics and events that we would like to see from this group in the future.

We are also looking for interested partner companies to help sponsor the group by providing refreshments, event locations or funding for future group events and speakers.

If you love the idea, but aren’t in the DFW area, check out these other great DataViz Meetup Groups across the country:

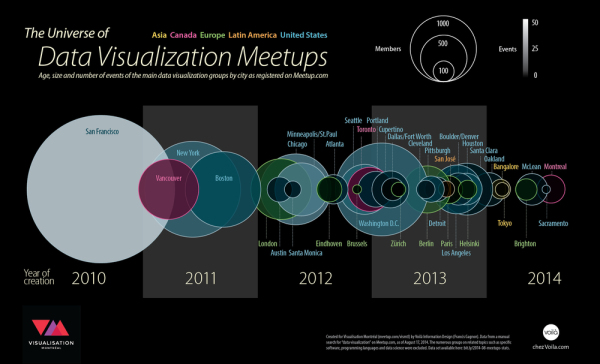
Also, check out The Universe of Data Visualization Meetups infographic which a great visualization design by Voilà Information Design in Montréal, Canada to find many more active groups.

The Universe of Data Visualization Meetups infographic


Friday
Oct032014

The Graphic Continuum

The Graphic Continuum data visualization poster

The Graphic Continuum is a new poster of data visualization styles and methods from Job Schwabish and Severino Ribecca. Available as a printed poster for $25 on Mimeo.

The Graphics Continuum shows several ways that data can be illustrated individually or combined to show relationships. Use of various shapes, chart types, and colors can help identify patterns, tell stories, and reveal relationships between sets and types of data. Bar charts, or histograms, for examples, can illustrate a distribution of data over time, but they also can show categorical or geographic differences. Scatterplots can illustrate data from a single instance or for a period, but they also can be used to identify a distribution around a mean.

This set of charts does not constitute an exhaustive list, nor do the connections represent every possible pathway for linking data and ideas. Instead, the Graphic Continuum identifies some presentation methods, and it illustrates some of the connections that can bind different representations together. The six groups do not define all possibilities: Many other useful overlapping data types and visualization techniques are possible.

This chart can guide graphic choices, but your imagination can lead the way to other effective ways to present data.

The Graphic Continuum data visualization poster closeup 1

I’ve seen a few other attempts to gather and categorize data visualization techniques, and I really like this poster. One of the biggest challenges for people is to break out of the Big Three chart styles: bar charts, line charts, and pie charts. It doesn’t matter if they’re designing an infographic or a PowerPoint presentation, I am often asked to help clients find new ways to visualize their data.

The Graphic Continuum data visualization poster closeup 3

Jon Schwabish has posted a great article on Visual.ly about the development process and includes images of some other arrangements they attempted during the design process.


Friday
Aug292014

False Visualizations: Sizing Circles in Infographics

Accuracy is the most important aspect of an infographic design!

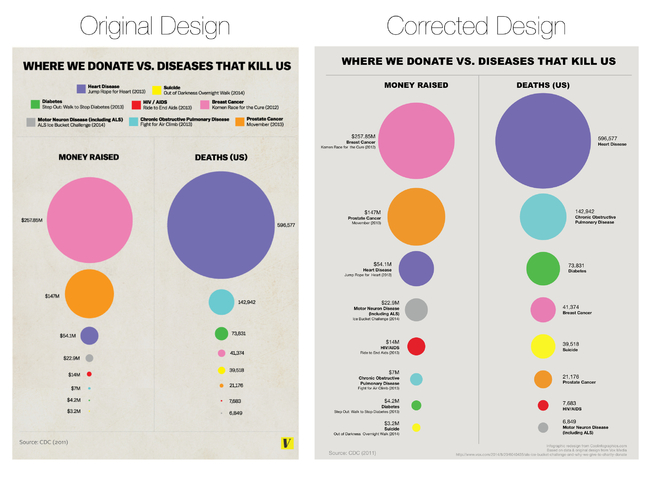
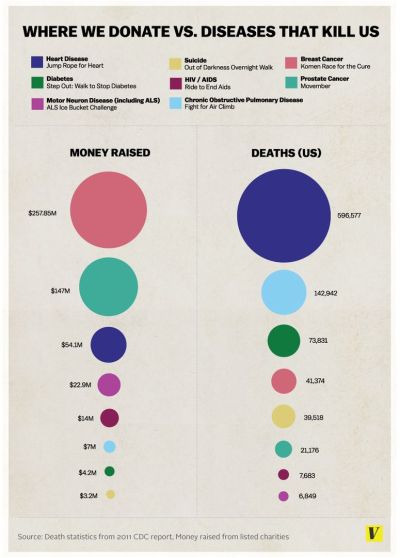
Last week, the article The Truth about the Ice Bucket Challenge by Julia Belluz on Vox Media included the infographic, Where We Donate vs. Diseases That Kill Us, that used proportionally sized circles as its data visualization. The problem with this design is that the circle sizes don’t match the values shown. This is a false visualization and significantly over exaggerates the smaller amounts of money contributed to each charity and the deaths attributed to each cause.

This causes problems because readers often just look at the visuals without reading the actual numbers. They start with the assumption that a visualization accurately represents the data. The Vox Media story and infographic already have over 12,000 shares on Facebook, and this is a great case study for designers to understand how important it is to visualize data accurately.

As readers, we see the area of two-dimensional shapes on the page to represent the different values, but design software only allows width and height adjustments to size shapes. Designers make the mistake of adjusting the diameter of circles to match the data instead of the area, which incorrectly sizes the circles dramatically. It takes some geometry calculations in a spreadsheet to find the areas and then calculate the appropriate diameters for each circle. To demonstrate, I created this corrected version of the infographic.

False Visualizations: Sizing Circles in Infographics Revised

My Google Docs spreadsheet of the correct circle area and diameter calculations is available here.

Assuming this was a design mistake, and there was no intent to deceive the audience, this is a common mistake that many designers make.  So many designers, that I included an entire section on this topic in the Cool Infographics book to help designers understand how to size the area of circles.

I made one other improvement to the corrected design above by removing the color legend and listing the charities and causes of death right next to the appropriate circles. This makes the whole visualization easier for the audience to read by eliminating the need to look back-and-forth from the circles to the color legend to figure out what each circle represents.  Placing the text next to each circle keeps the information in the reader’s field of view which minimizes eye movement.

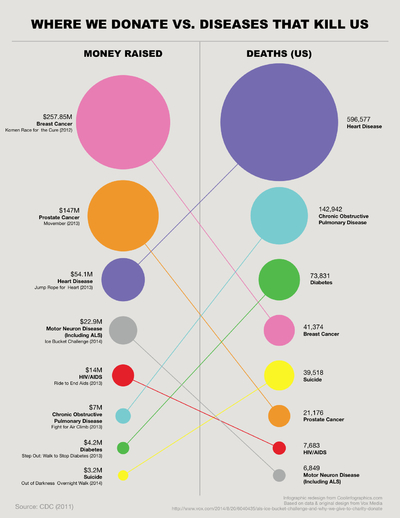
Sticking with the circles data visualization style, I wanted to take the design a little bit further. I would recommend one of two alternate improvements.  First, adding colored connecting lines is one way to make it easier for the audience to find the related circles in the columns sorted in descending order.

False Visualizations: Sizing Circles in Infographics Revised Lines

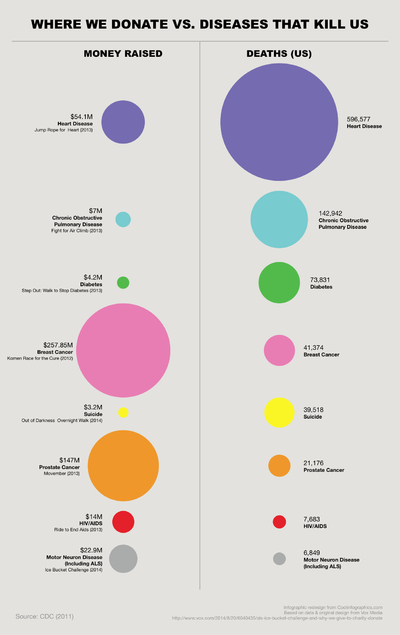
A second alternative would be to sort the lists to line up the related circles.  This makes it much easier for the audience to see the direct comparisons between charitable contributions and death rates related to the same cause.

False Visualizations: Sizing Circles in Infographics Revised Descending Sort

I’m passing over any discussion about whether using proportionally sized circles (a bubble chart) is the best visualization method for this data. If a designer makes the choice to use sized shapes, my point is that the data visualizations in the infographic must match the numbers using area.  David Mendoza published a good analysis worth reading and designed an alternative way to visualize the data in his article, This Bubble Chart Is Killing Me.

How else would you improve this design?

NOTE: I was able to contact the designer who created the infographic at Vox Media, and he had already realized his error after the infographic had been published. As I had guessed, he had mistakenly adjusted the diameter of the circles instead of the area. He told me that he’s working on updating the official infographic design in the article, but it hasn’t been published on the Vox Media site yet.


Tuesday
Aug192014

Voice of the Photographer: Photographers Actively Engaged in Growing Skills

Voice of the Photographer: Photographers Actively Engaged in Growing Skills infographic

The field of Photography evolves quickly due to advances in technology. Eyefi has uncovered the latest trends in the field and have organized them into the Voice of the Photographer: Photographers Actively Engaged in Growing Skills infographic.

There’s just no arguing that today’s most prominent photographers are evolving at the speed of technology. Those that remain relevant do so by merging their visual talents with the latest advances, like WiFi SD cards, cloud storage, and new ways of lighting and photo manipulation.

Photographers at the top of their game must maintain a staunch dedication to continuous improvement as well. Thankfully, the web provides a bevy of opportunities to hone their craft, from top-ranking bloggers to photography-focused online magazines.

To find out exactly how and where today’s best photographers are expanding their knowledge base, Eyefi.com, creators of innovative WiFi cards, apps, and cloud services, in partnership with influencer marketing agency Evolve!, reached out to their accomplished user base with a myriad of relevant questions. The results showcase where the most influential photographers online are spending their time, money, and efforts to advance their abilities. Some are professionals, while others are hobbyists; but all these folks know how to move us with their visual storytelling skills. Check out the fascinating infographic below to learn more about the photography world’s current ever-evolving habits and trends.

I love seeing all of this survey research data shown in a visual, infographic form.  It’s so much more engaging and easier for the audience to understand.

When visualizing data with grids of icons, rows with 10 icons across are the easiest for your readers to understand.  This design includes some odd row quantities like 12, 13 and 20 icons across, which are not intuitive to the audience.  Our number system is Base-10, and icons shown in groups of 10 are the easiest to comprehend.

Thanks to Katie for sending in the link!

Monday
Aug112014

12 Reasons Your Business Needs to Get Visual

12 Reasons Your Business Needs to Get Visual infographic

If we’ve said it once, we’ve said it a million times… but once more wont hurt! Visuals are important!!! This infographic from re:DESIGN attempts to summarize the reasons why in 12 Reasons Your Business Needs to Get Visual.

The shift to the visual is evident everywhere we look, in all media — the infographic explains why.

A good, strong visual married to a good concept — with the right strategy and the right words — wins every time, especially in today’s busy, noisy media world. One thing is clear: visuals and all that traditional creative expertise brings to the table has never been more important for capturing eyeballs, expanding brand influence, and getting people to act.

Love the message and most of the points included.  Good choice of images for each section. However, big fonts are not data visualizations and the infographic looks like it’s pushing the use of bigger fonts instead of visuals. Data shown in a big font does not provide the audience with any context, not do they make the data easier to understand.

I also noticed the popular false statistic included in the design: “Visual data is processed by the brain 60,000 times faster than text.”  It’s a statistic often quoted in presentations and infographics about the value of visual information, but it’s not true.  I’d love for this statistic to be real, but no one has been able to track down the original research.  It was used decades ago in some 3M marketing materials for transparencies used with overhead projectors (yes, that long ago).  It’s quoted so often now that everyone believes it.

If this topic interestes you, check out Chapter 1 of my book, Cool Infographics, called The Science of Infographics.  There I cover the research and data behind why visual information is more effective and why infographics are so popular.  You can download a free sample PDF of the chapter on the BOOK page.

Found on re:DESIGN

Tuesday
Jun242014

HelpMeViz: DataViz Community Feedback for Your Charts

HelpMeViz: DataViz Community Feedback for Your Charts

Have you ever struggled with which type of chart to use in your presentation? Or how to get Excel to display the chart the way you want it to appear?  Or don’t know what software will create the data visualization you would like to use?

Jon Schwabish is a data visualization specialist, and in 2013 he launched a new website to help everyone become better at data visualization called HelpMeViz.  The HelpMeViz site invites you to submit your data visualization projects to get feedback from the community.  The community is encouraged to offer suggestions, critiques and debate ideas about chart formats, software tricks, visual applications and visualization methods that can be valuable feedback to make your data more understandable and impactful.


The data visualization community consists of people who use data and design to tackle a variety of issues and challenges. Outside of a few specific blogs and tutorials however, there isn’t a place where that community can provide in-depth comments and criticism on data visualization projects. This site is designed to facilitate discussion, debate, and collaboration from the data visualization community.

The site is open to anyone who is searching for feedback on their visualization designs, from seasoned designers and data visualization specialists to individual analysts searching to improve their graphic displays. All types of visualizations are welcome: simple, single line or bar charts to full-blown infographics to interactive visualizations.

If you have a chart that just isn’t working, or getting your message across to your audience, you can upload it to the site, and get really useful, actionable advice from the Community.
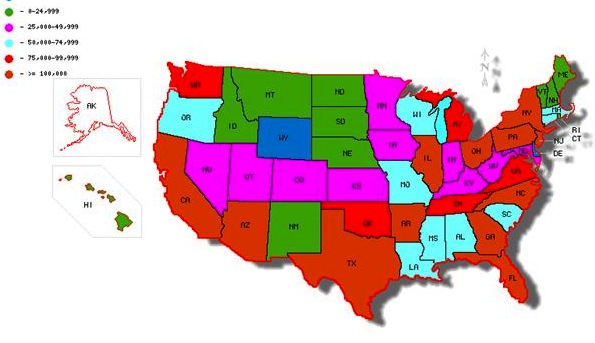
Mapping Program Participation by State

Jon is currently the Senior Researcher and Data Visualization Expert at the Urban Institute in Washington, DC, and he took some time to answer a few interview questions from me about the HelpMeViz site:

Cool Infographics: Who is the target audience of the site?

Jon Schwabish: The site was created for anyone—truly anyone—to seek feedback or submit comments. I want anyone to be able to use the site—from the data visualization expert to the experienced JavaScript programmer to the research assistant using Excel. To attract that broad audience, I decided against using established tools or sites like Flickr, Pinterest, Behance, or Dribbble. Many of those sites require users to create an account, or have some other barrier to easy entry and I wanted to avoid those types of barriers. Additionally, I felt that sites like Stack Overflow and GitHub appeared too difficult for the everyday user. So, although it’s often said that you should refine your audience, I wanted to go broad here to make it as accessible as possible.


Cool Infographics: How often do people post new visualization questions to HelpMeViz.com?

Jon Schwabish: To date, I’ve posted at least one visualization per week. There have been a few weeks when I’ve been able to do more. Interactive visualizations and ones that have a unique design question—for example, how to create something in Excel—generate the most interest.


Cool Infographics: Are you having success getting the audience to engage and recommend design ideas?

Jon Schwabish: For the most part, I haven’t had to engage the audience much on my own; community members have taken most of the initiative to engage with the content, making light work for me on that end. I’d like to see more requests on the design side—questions about font or color or layout. To date, requests have been primarily about tools and creation of the visualization. But I think a lot of people would benefit from asking basic design-style questions.


Cool Infographics: Does it take much of your own time to participate and keep the site running?

Jon Schwabish: It doesn’t take too much of my own time, but that will change, I hope, as the amount of content increases. I oftentimes have to rewrite the text to clarify the challenge or goal. Sometimes I need to tweak an image or extract an image from a larger document. I rarely fiddle with the data—if the person who submitted the visualization could use it to create the graphic, then it’s probably close enough for others to use. I’ll usually correspond with the submitter once or twice to make sure he or she is okay with my edits and then I post the submission.


Cool Infographics: What are the best examples of successful projects posted to the site?

Jon Schwabish: There have been a number of interesting challenges.

Perhaps the thing I’m most excited about for the site right now is the live Hackathon that will be held on Saturday, June 28, with Bread for the World Institute. We are inviting 25 coders, designers, and data scientists to help the Institute with two data visualization challenges. I will be live blogging the event and will make the data available on the HelpMeViz site so that anyone around the world can join the discussion and provide his or her own visualization suggestions.

This site is truly made for everyone, and I encourage you to check it out.  The feedback can range from Excel charting tips to visualization programming code.  You can upload your own charting challenges, offer recommendations on other people’s charts or just lurk and learn from the advice of other experts.

If you’re in the DC area, be sure to check out the HelpMeViz Hackathon event on Saturday, June 28th! HelpMeViz will bring together coders, data scientists, and data visualizers in Washington, DC, to help Bread for the World Institute with two data visualization challenges for its 2015 Hunger Report, which focuses on why women’s empowerment is essential to ending global hunger.

Thanks to Jon for creating this incredible resource, and taking the time to answer a few questions!

Monday
May052014

The Explosive Growth of Cloud Computing

The Explosive Growth of Cloud Computing infographic

Cloud computing is definitely a growing trend. Are you in the position to enjoy all of what cloud computing has to offer? The Explosive Growth of Cloud Computing infographic from Eclipse lets you know what you could be missing if you don’t join their network. 

Now is the time to get on the growth curve of cloud services as we are seeing ever-increasing demand for these services – look at how they have developed in the home with subscription services such as Netflix and Love Film. There is a real on-demand economy and as a result, a new, smarter way of working.

So, if it’s time to investigate cloud services for your business it’s also time to look at your connectivity partner, and a partner who provides both connectivity and cloud services will know exactly what you need to ensure a robust internet connection. Look for a partner who is prepared to really understand your business needs and the role of both the cloud and connectivity in those needs; a partner that will tailor-make solutions to your exact business requirements and stay away from the one-size-fits-all mantra; and a partner who provides a high service assurance accompanied by easily accessible monitoring systems so you can be ‘in the know’ regarding your network’s performance.

Great use of doughnut charts, bar charts, logos and icons to tells the story of the growth of cloud computing.

Thanks to David for sending in the link!

Friday
Apr252014

Every Job In America

Every Job In America infographic

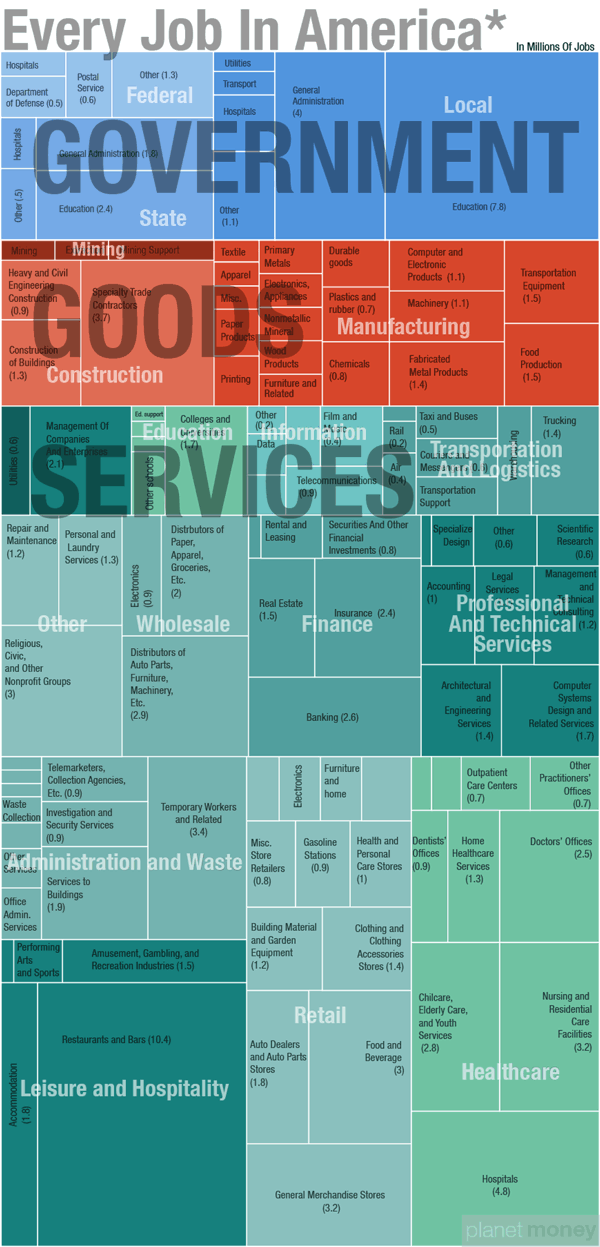
Every Job In America is a treemap data visualization design from Quoctrung Bui at NPR based on the data that the U.S. government collects for the monthly Jobs Report.  I think I probably fit somewhere in the Services-Professional and Technical Services-Specialized Design section.

Whatever Friday’s monthly jobs report says, it won’t change the big picture. There are roughly 137 million jobs in this country. About two-thirds of those jobs are in private-sector services; the remaining third are split between goods-producing jobs (mainly manufacturing and construction) and government work (mostly at the state and local level).

Here’s a closer look, drawn from the same data that the government collects for the monthly jobs report.

Notes: 
*The data come from the government’s non-farm payroll report — which, as the name suggests, does not include farm jobs. Update: The report also excludes military personnel, government intelligence employees and some self-employed workers.

There isn’t much I would change about this design.  The treemap visualization is well done, and carefully organized to allow for the color coding rectangles.  Titles are missing from any rectangle that was too small to hold the text, but a smaller font could have been used, or a reference to a list at the bottom.

Even though this is part of an article posting, the infographic image itself has a title for easy sharing without the rest of the article.  Including a few other elements in the image file like the data sources and the URL to the landing page would be very helpful.

This is the type of project where I think a link to a public spreadsheet with the numbers used would be helpful.  The article links to the U.S. Bureau of Labor Statistics press releases, but then someone would have to dig through the reports.

Monday
Mar172014

The State of Infographics at SxSW 2014

The State of Infographics at SxSW 2014

I post all types of infographics and data visualizations from designers all over the world here on Cool Infographics, and as a recap, I wanted to take stock of the state of infographics and data visualization at this year’s SxSW Interactive conference in Austin, TX.

I’ve been going to SxSW for a few years now, and infographics have been a growing presence in the Interactive portion of the conference every year.  You can find hidden sessions about data visualization, visual communication and infographics in different portions of the conference like the new SXsports, Health and Business sessions.

Check the links and search the presentation hashtags on Twitter to find more information and audience comments from each event.  I know I didn’t catch everything, so send me links to anything (Events, notes, slides, etc) I missed through the Contact page or the comments and I’ll add appropriate ones into the post!

*Sessions I was able to attend

Official Events:


Unofficial Sessions:


  • The Attention Economy with Walter, book signing by Ekaterina Walter @Ekaterina, co-author of The Power of Visual Storytelling
    • “Attention is the new commodity. Visual storytelling is the new currency,” say co-authors Ekaterina Walter and Jessica Gioglio in their new book The Power of Visual Storytelling.  The first 100 attendees for Ekaterina’s signing will get a copy of her book. Come chat with Ekaterina about the visualization revolution and her thoughts about SxSW Interactive 2014.
    • Hosted by Vocus @Vocus
    • http://www.eventbrite.com/e/wtf-sxsw-visualize-a-powerful-future-tickets-10822280733
  • FH Black Box lounge at the Four Seasons (#FHBlackBox)
  • Column Five announced the release of Visage
  • Cool Infographics Meetup
    • Special thanks to the team at the Fleishman Hillard Black Box Lounge!  They allowed me to host the Cool Infographics @Coolinfographic meetup event after my book signing on Monday for anyone that wanted to hang out.  It was also an opportunity to meet fans and sign books for people that didn’t have official SxSW badges.


Please help add anything I missed by posting in the comments below or sending me a note through the Contact page.  I’ll add new content into the post above.


Tuesday
Jan142014

Information Destruction Through History

Information Destruction Through History infographic

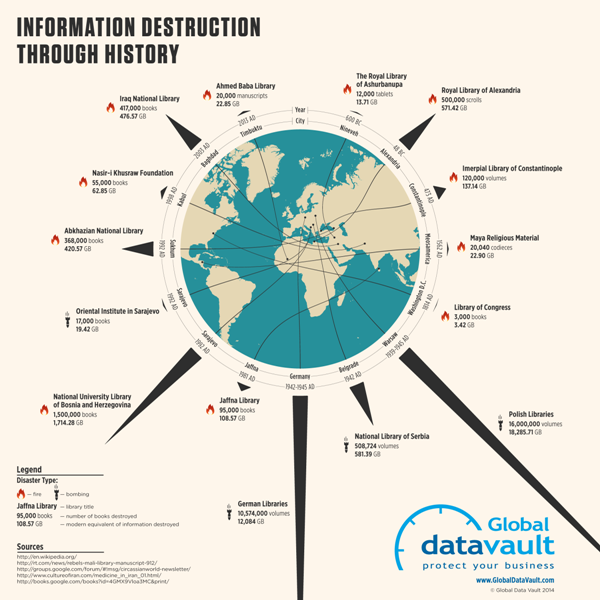
Information Destruction Through History from Global Data Vault explores and quantifies the worst data disasters in history.

Information the most valuable commodity in the world. All human progress depends on the accumulation and preservation of information. When information is lost, human progress suffers. This infographic displays some of the most significant loses of information human civilization has suffered.

The circular timeline shows the data disaster events in chronological order, while also connecting to their geographic locations.  The triangles are proportionally sized so readers can visually compare the modern data equivalents between the events.  This really helps put the disasters into perspective for the audience.

A great infographic design that tells one story really well, but there are a few things I would recommend to improve the design:

  • I wouldn’t have any of the triangles run off the page, because the audience will lose perspective on how disastrous those specific events were.  Show the full impact of those events to the readers.
  • Add the URL directly to the infographic landing page so readers can find the original full-size version when people don’t link back correctly
  • I wouldn’t list Wikipedia as a data source if possible. Track the Wikipedia references back to the original data source to include in the list.

Thanks to Joe for sending in the link!