About
Randy Krum
President of InfoNewt.
Data Visualization and Infographic Design

Infographic Design

Infographics Design | Presentations
Consulting | Data Visualizations

DFW DataViz Meetup

Join the DFW Data Visualization and Infographics Meetup Group if you're in the Dallas/Fort Worth area!

Search the Cool Infographics site

Custom Search

Subscriptions:


Feedburner

The Cool Infographics® Gallery:

How to add the
Cool Infographics button to your:

Cool Infographics iOS icon

- iPhone
- iPad
- iPod Touch


Read on Flipboard for iPad and iPhone

Featured in the Tech & Science category

Flipboard icon

Twitter Feed
From the Bookstore

Caffeine Poster

The Caffeine Poster infographic

Entries in poster (133)

Wednesday
Dec172014

An Illustrated Guide To The Galaxy Of Women's Shoes

An Illustrated Guide To The Galaxy Of Women's Shoes infographic

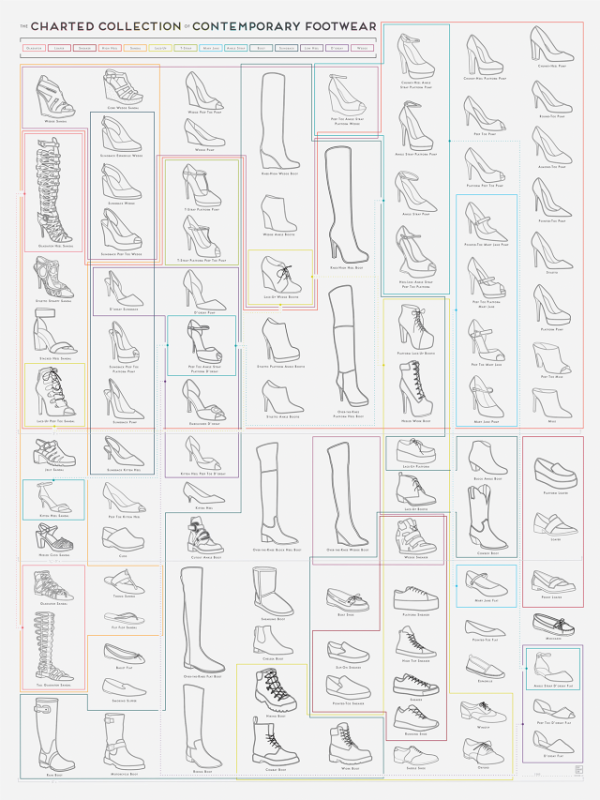
An Illustrated Guide to the Galaxy of Woman’s Shoes is the all knowing cheat sheet to any shoe that a woman could wear. Created by Pop Chart Lab, the color coding around the shoes d distinguishes the categories that each shoe falls under.

Can’t tell the difference between a slingback espadrille wedge and a peep-toe ankle strap platform wedge? The prolific infographic design studio Pop Chart Lab has you covered. The Charted Collection of Contemporary Footwear is a handy, color-coded cheat sheet of the many shoes the modern woman might go sauntering—or, in some cases, teetering—out of the house wearing.

It just boggles my mind.

Found on http://www.fastcodesign.com/

Tuesday
Nov042014

Supermovies: Calendar of Comic Movies

Supermovies: Calendar of Comic Movies infographic

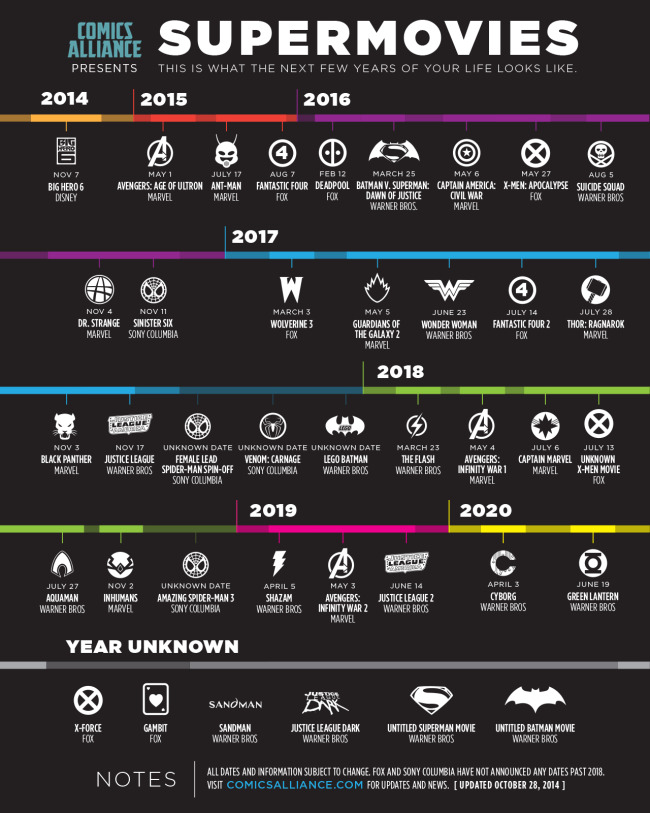
Supermovies is a calendar infographic created by graphic artist Dylan Todd (in collaboration with Comics Alliance).

ComicsAlliance’s own graphics maestro Dylan Todd put together a timeline that reveals what those six years look like, including 29 confirmed release dates between now and the end of 2020, with several dates and titles still to be announced. For anyone who remembers the days when just one Spider-Man movie seemed an impossible dream, it’s an astonishing representation of how comic book superheroes now dominate popular entertainment.

Our timeline makes the assumption that the Warner Bros movies will be released in the order listed in their press release, which seems a safe assumption. We can also assume that some of the “year unknown” movies on the bottom tier, like Thor 3 and Gambit, may eventually be placed in some of the existing slots in the timeline, and that Marvel Studios, Fox, and Sony Columbia will announce further dates in 2019 and 2020.

The above graphic was updated October 28 to reflect the confirmed Marvel Studios Phase 3 releases

Love it. The design minimizes text and gives you only the most basic information to keep it simple. Icon-Date-Title-Comic Publisher.

I don’t like the years wrapping around the edge at all. This would be much easier to understand if each year were shown as its own row.

Knowing that this will update over time, the URL to infographic landing page where updates will be posted (not the Comics Alliance front page) would be immensely helpful to readers. The text URL included in the footer of the infographic image would ensure that readers can find the current, full-size verison.

Found on GeekTyrant!

Monday
Nov032014

Filmography Print Series Posters

 Filmography Print Series Posters infographics

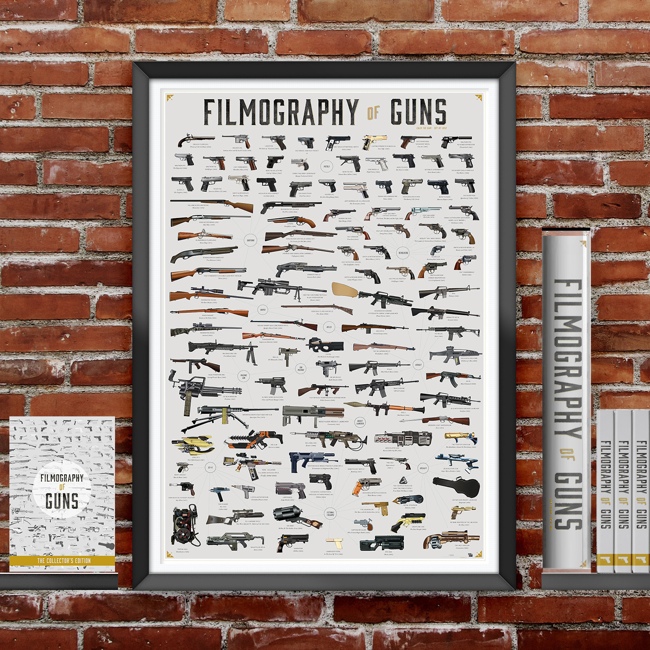
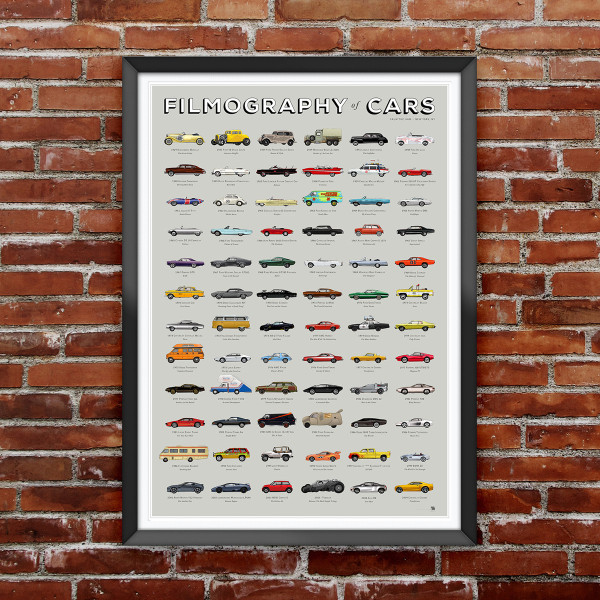
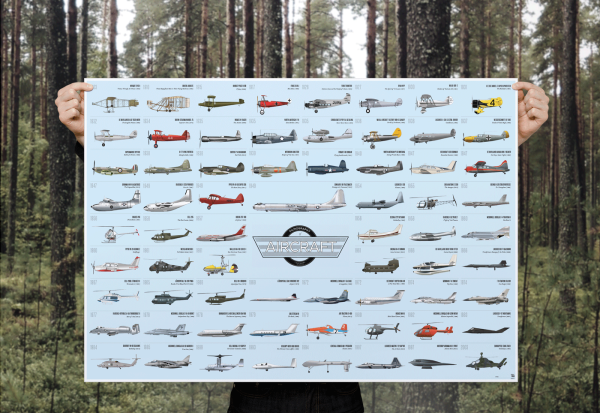
The Filmography Print Series was created by Cathryn and are all available for purchase at Calm The Ham. The Filmography of Guns (above), the Filmography of Cars, and the Filmography of Aircraft show a collection of popular icons from film and TV shows. Also available are book versions of the prints.

My name is Cathryn, and I’ve created the Filmography print series. Through the illustration of iconic items from film and television I wanted to create artwork for fans of popular culture, like myself. 


Each gun was sketched by hand with meticulous attention to every detail. It was then converted to a digital illustration. By drawing each gun at a large size (approx 12” x 18”) the detail of the weapon remains crisp when reduced in scale on the print.


The Filmography of Cars which illustrates popular cars from TV and film.


The Filmography of Aircraft, which illustrates 100 years of aviation in film.


Congratulation to Cathryn for her most recent project being funded on Kickstarter!

Friday
Oct032014

The Graphic Continuum

The Graphic Continuum data visualization poster

The Graphic Continuum is a new poster of data visualization styles and methods from Job Schwabish and Severino Ribecca. Available as a printed poster for $25 on Mimeo.

The Graphics Continuum shows several ways that data can be illustrated individually or combined to show relationships. Use of various shapes, chart types, and colors can help identify patterns, tell stories, and reveal relationships between sets and types of data. Bar charts, or histograms, for examples, can illustrate a distribution of data over time, but they also can show categorical or geographic differences. Scatterplots can illustrate data from a single instance or for a period, but they also can be used to identify a distribution around a mean.

This set of charts does not constitute an exhaustive list, nor do the connections represent every possible pathway for linking data and ideas. Instead, the Graphic Continuum identifies some presentation methods, and it illustrates some of the connections that can bind different representations together. The six groups do not define all possibilities: Many other useful overlapping data types and visualization techniques are possible.

This chart can guide graphic choices, but your imagination can lead the way to other effective ways to present data.

The Graphic Continuum data visualization poster closeup 1

I’ve seen a few other attempts to gather and categorize data visualization techniques, and I really like this poster. One of the biggest challenges for people is to break out of the Big Three chart styles: bar charts, line charts, and pie charts. It doesn’t matter if they’re designing an infographic or a PowerPoint presentation, I am often asked to help clients find new ways to visualize their data.

The Graphic Continuum data visualization poster closeup 3

Jon Schwabish has posted a great article on Visual.ly about the development process and includes images of some other arrangements they attempted during the design process.


Friday
Sep052014

Alchemy of Tea

Alchemy of Tea Infographic Poster

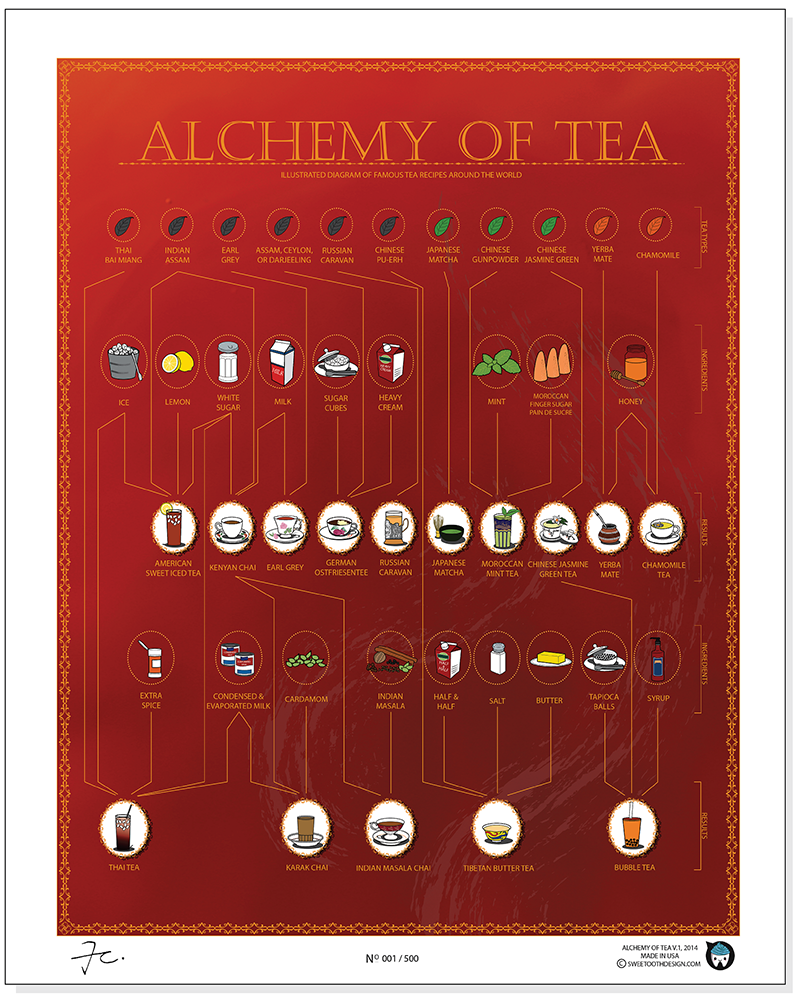
The Alchemy of Tea infographic poster from SweeTooth Design Company maps out 15 traditional tea recipes from around the world, paying homage to the 4,000 year old beverage. Posters are available for $25 through the Kickstarter project, and will ship in November.  They have already exceeded their funding goal, so these will definitely go to print.

“Alchemy of Tea” is the first infographic illustration that depicts traditional tea recipes from around the world. It is not only a poster, but an informative recipe diagram of one of the most favorite drinks, tea.

There is a total of 15 tea recipes. Through mixing tea base with different ingredients, there are different results. What is more interesting is that simply by adding one or more ingredients, the entire recipe may becomes an entire different drink. 

Alchemy of Tea Infographic Poster Red Closeup

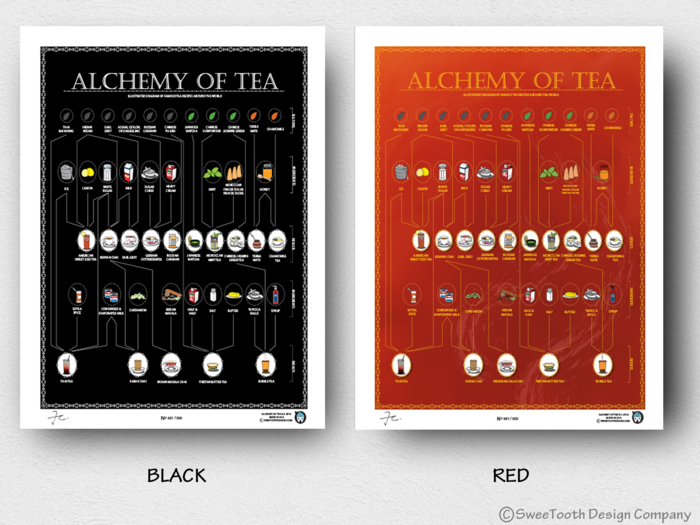
Posters will be printed in Red and Black:

Alchemy of Tea Infographic Poster Red Black

Found on http://www.fastcodesign.com

Thursday
Sep042014

Abby & Chris: Wedding Invitation

Abby & Chris: Wedding invitation

Another fun way to spruce up your life with visuals! The Abby & Chris Wedding invitation from Abby Ryan Design takes an ordinary wedding invitation, and makes it extraordinary with data v visualization Fun idea! Maybe try it out for your next party?!

Abby & Chris: Wedding invitation

This illustrative wedding package was designed to reflect the playfulness of Abby and Chris’s food truck wedding. First, a 18 x 24 screen printed wedding infographic that works as an invitation, program and menu. The poster was designed with the rehearsal dinner invitation as the bottom section so it could be removed for guests only coming to the wedding. Next, the save the date card, which focuses on important events in Abby and Chris’s relationship with the final date being their wedding. A wedding website was also created to keep their guests informed.

This is fun and original. A keepsake for all the guests! It also gives a lot more useful information than most wedding invitations!

Thanks to Abby for sending in the link!

Friday
Jun272014

The Basic Wine Guide

Basic Wine Guide infographic

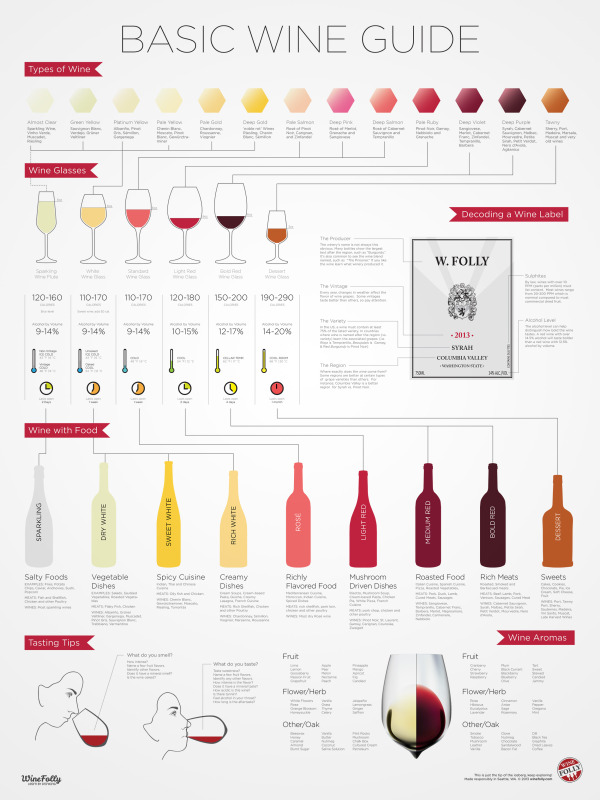
The Basic Wine Guide infographic from Wine Folly is full of the helpful tips one needs when trying to understand wine etiquette. This infographic has tips about what glass each wine should be in, what the wine should be eaten with, some tasting tips, and other things.

The infographic is now available for purchase as a poster for $24.

Wine is more than just a drink; it’s a lifestyle, a survey into history, a gastronomic adventure, a study in farming and a way to explore different cultures. But with so many different angles to approach wine, how do you get started?

Fortunately, there are only a few basic techniques to learn as well as some common wine knowledge. With a little practice you will be over the hump of being a rudimentary wine ‘dabbler’ to becoming an upstanding wino, capable of ordering wine like a pro.

The wine for beginners infographic has the answers to your questions. Learn the different wine styles, wine glasses and tips on tasting like a wine connoisseur.

This design keeps the types of wine in the same order all the way down the infographic, creating a nice and tidy visual for anyone who is looking for specific information on the infographic.

Found on winefolly.com

Wednesday
May142014

The Drone Survival Guide

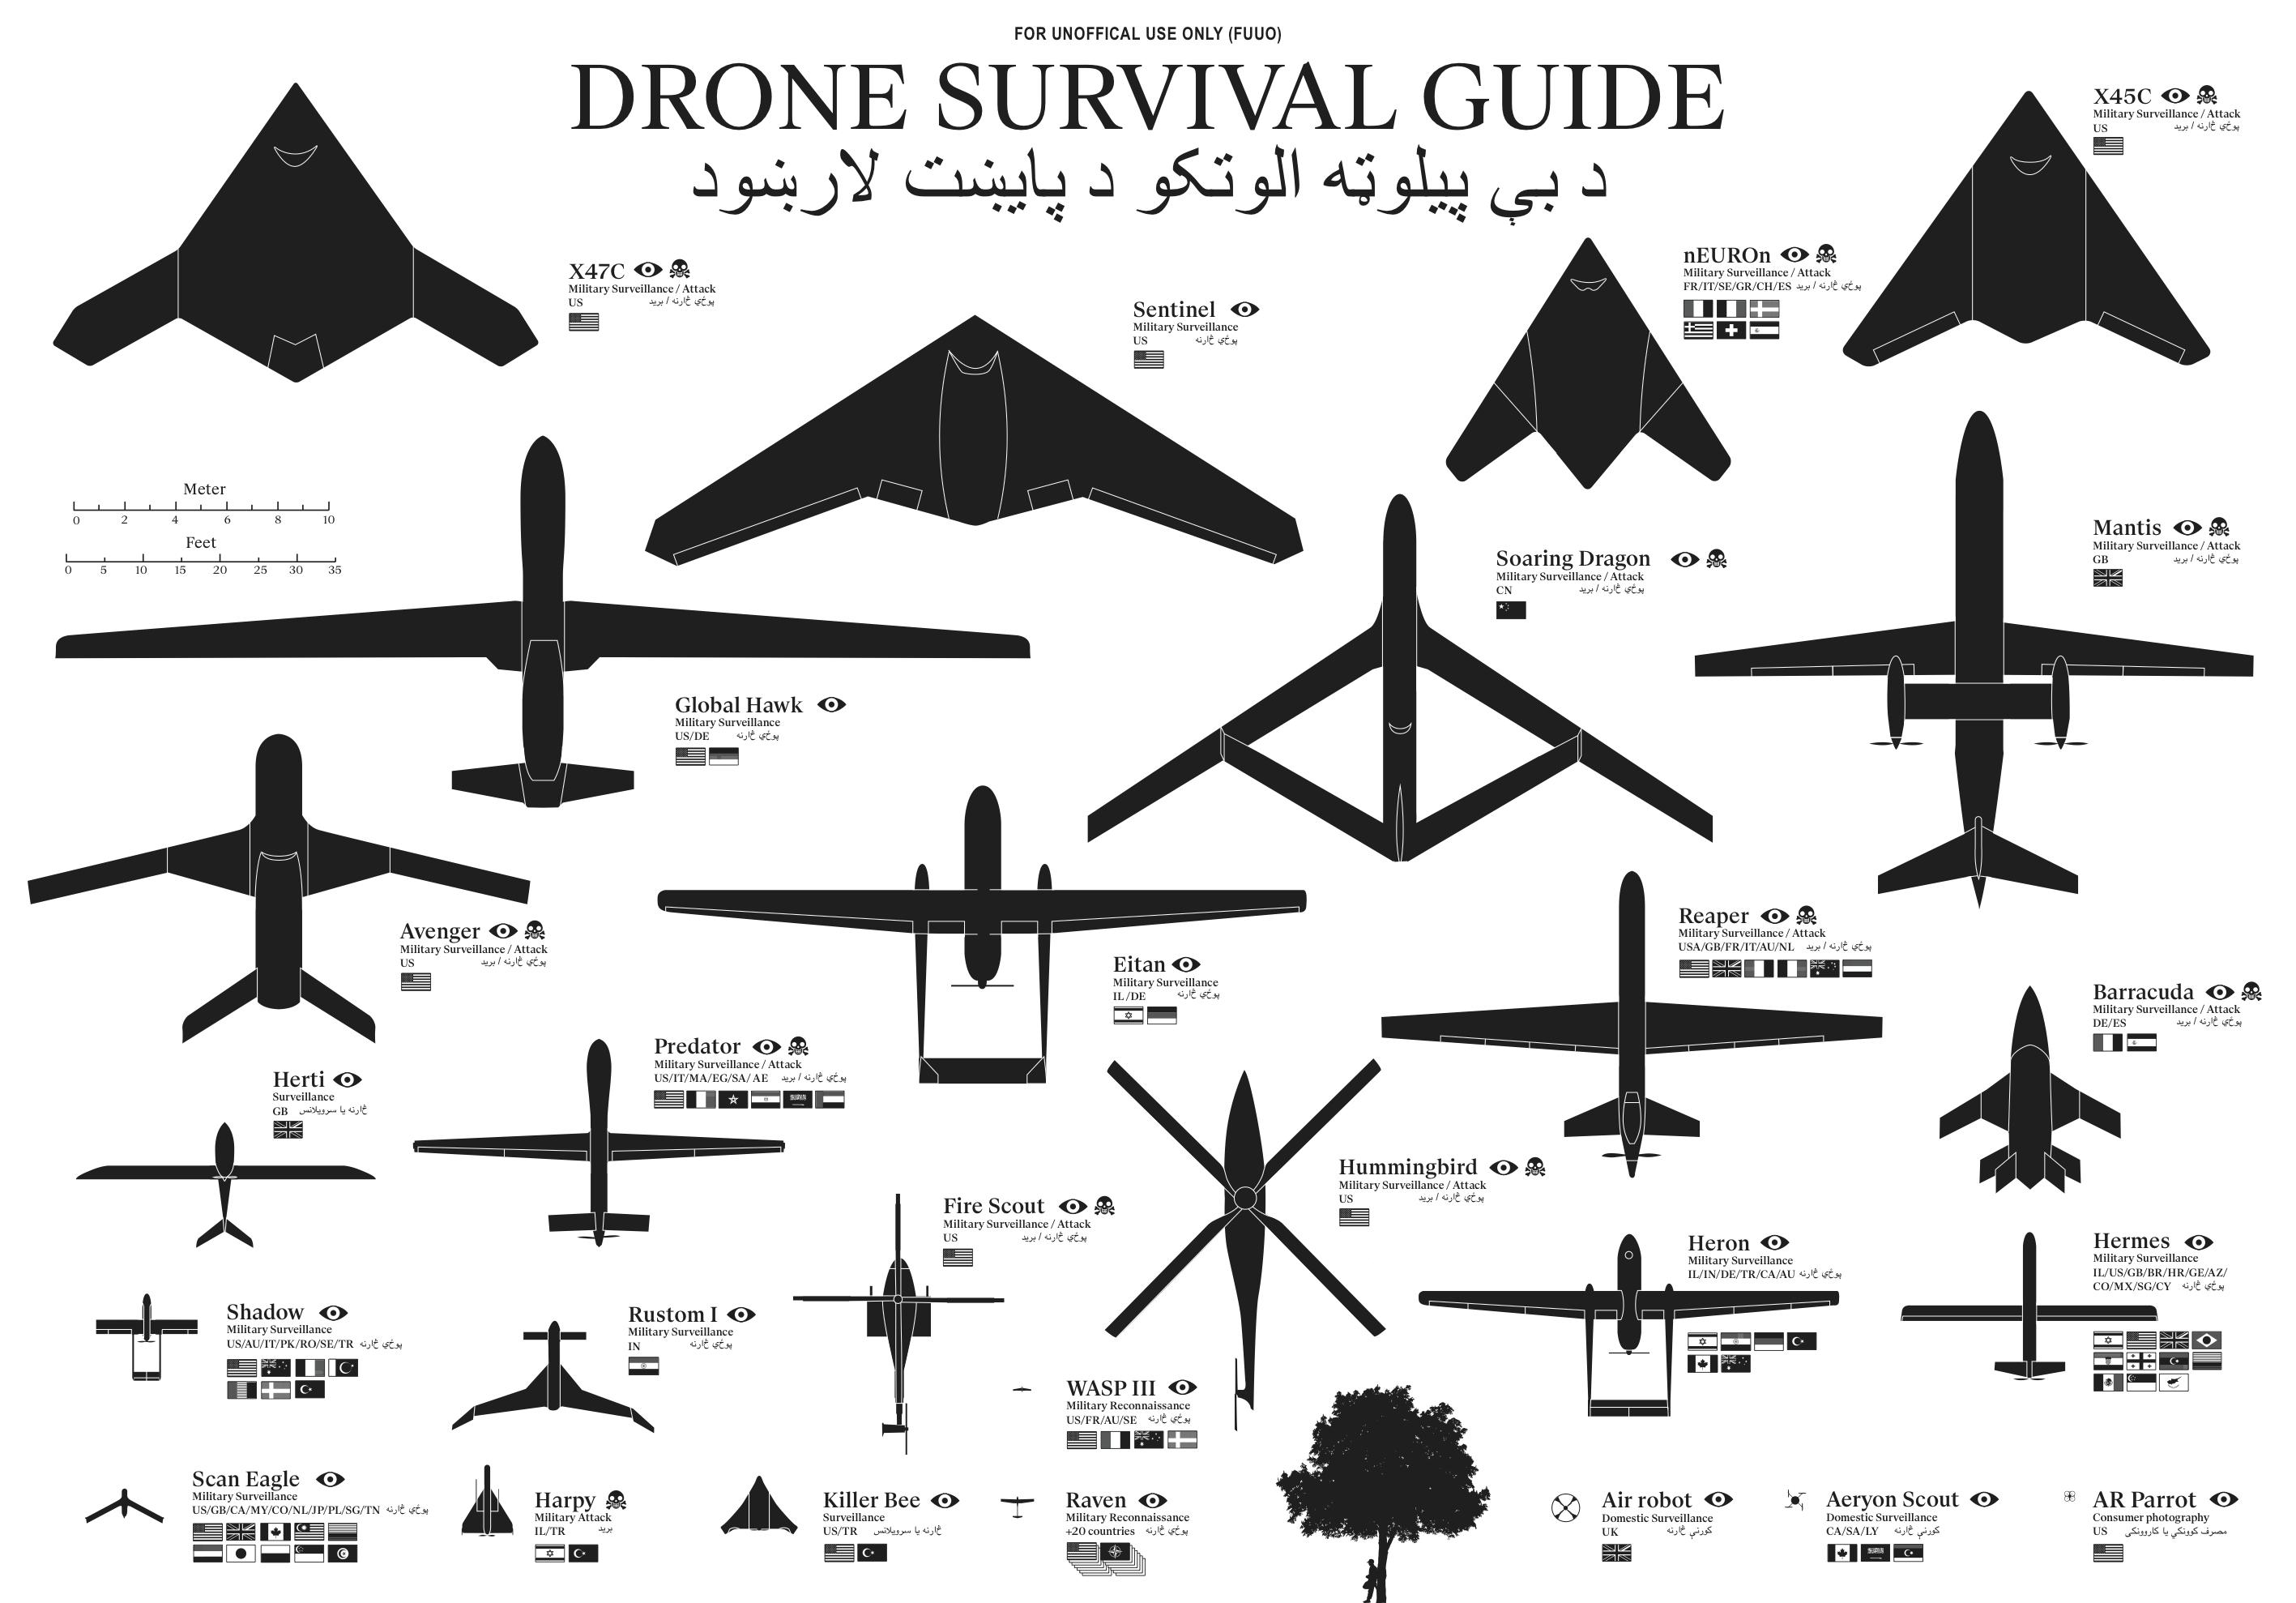
Drone Survival Guide infographic poster

The Drone Survival Guide is a poster and online infographic that uses proportionally sized silhouettes of the most common UAVs (Unmanned Aerial Vehicles).  Designed by Ruben Pater, a self-employed artist/graphic designer from the Netherlands, the poster is available for download as a PDF.

Posters printed on aluminum reflective Chromolux ALU-E mirrored paper are available from the site for €10, which included worldwide shipping.

TWENTY-FIRST CENTURY BIRDWATCHING

Our ancestors could spot natural predators from far by their silhouettes. Are we equally aware of the predators in the present-day? Drones are remote-controlled planes that can be used for anything from surveillance and deadly force, to rescue operations and scientific research. Most drones are used today by military powers for remote-controlled surveillance and attack, and their numbers are growing. The Federal Aviation Administration (FAA) predicted in 2012 that within 20 years there could be as many as 30.000 drones flying over U.S. Soil alone. As robotic birds will become commonplace in the near future, we should be prepared to identify them. This survival guide is an attempt to familiarise ourselves and future generations, with a changing technological environment.

This document contains the silhouettes of the most common drone species used today and in the near future. Each indicating nationality and whether they are used for surveillance only or for deadly force. All drones are drawn in scale for size indication. From the smallest consumer drones measuring less than 1 meter, up to the Global Hawk measuring 39,9 meter in length. 

Concept and design by Ruben Pater. Want to know more about the motivation behind this project? Read the FAQ.

The poster is also being publicized in conjunction with the Drone Salon seminar coming up on May 23, 2014.

The drone salon aims to provide a multidisciplinary overview of challenges, opportunities and speculations on future transitions caused by the use of drone technology both in the battlefield and in the civic realm. This seminar, punctuated by demonstrations and presentations, will consist of five conversations between Malkit Shoshan, Ethel Baraona Pohl and experts in the field: lawyers, activists, civic and military drone operators, artists, novelists and designers. The conversations will bring together multiple views, examples and projects on the spatial effects of the implementation of drones in war and in peace time. The seminar is part of the ‘Drones and Honeycombs’ project and one of a series of public events on the topic of drones organised in collaboration with Studio-X, Columbia University, DPR-Barcelona, The Center for the study of the Drone in NYC and Het Nieuwe Instituut in Rotterdam.

The design is actually very similar to the SciFi Starship Comparison Chart, but on a much smaller scale.  Many people in Ruben’s audience have sent in translations for the text included in the poster, so he has posted the text in at least 32 different languages.  I would like to see those translations offered as full versions of the poster, instead of the text only, but I understand that takes a lot of work.

I’m fascinated by drones, and I own and fly one of the AR Parrot Drones you see in the bottom right corner of the poster.

Thanks to Ethel Baraona Pohl for posting on Facebook!


Monday
Mar312014

Map of the Internet 2.0 Poster

Map of the Internet 2.0 Poster

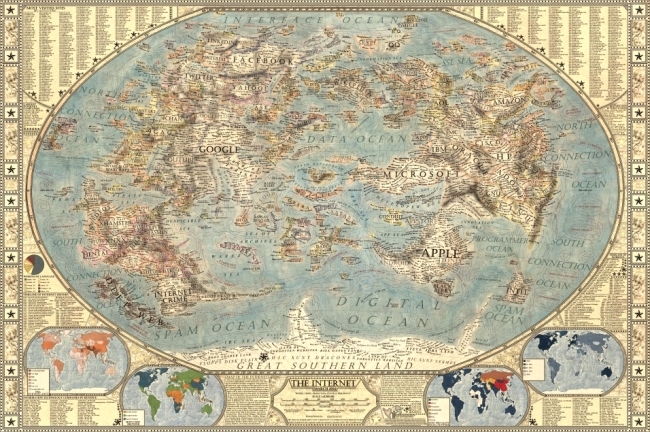
Designer Martin Vargic has released an updated version of his Map of the Internet 2.0 that creates what looks like a vintage-style map.  However, this version plots out the major websites and technology companies, with related sites grouped together on the same continent.  The sizes of the websites on the map are scaled relative to their number of visitors, so bigger sites show as bigger geographic regions.

Second version of our flagship project, the Map of the Internet.

This conceptual work of cartography treats major internet sites and enterprises such as Google, Yahoo, Microsoft, HP, and Apple like sovereign states, on a classic map of the world. To explain the dominance and relationships of these entities, they were all given a visual hierarchy that gives prominent treatment to companies with the most users (or sites with the most visitors), surrounding them with smaller countries representing related websites and services.

This poster includes one full map of the internet, 4 minimaps showcasing NSA surveillance, most used social networks, most used internet browser, and worldwide internet penetration, list of Alexa Top 500 websites, quick timeline of the Internet History, top software companies and much more!

The map includes more than 250 separate websites/enterprises as sovereign states, and more than 2000 separate labels.

A high-resolution version is available online, and you can also order 24” x 36” printed posters on Zazzle.

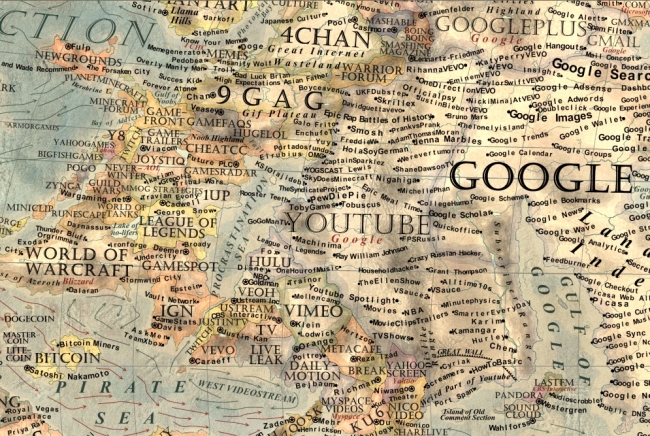
This what I call a 2nd level design, which means it’s a highly detailed design that is meant to present a ton of information to the audience.  This type of design isn’t trying to communicate a key message in a few seconds, but is intended for readers to zoom-in and explore.

Map of the Internet 2.0 Poster Zoom


Found on Business Insider

Monday
Feb032014

The Beautiful Flow of Pi

Flow Of Life Flow Of Pi data visualization poster

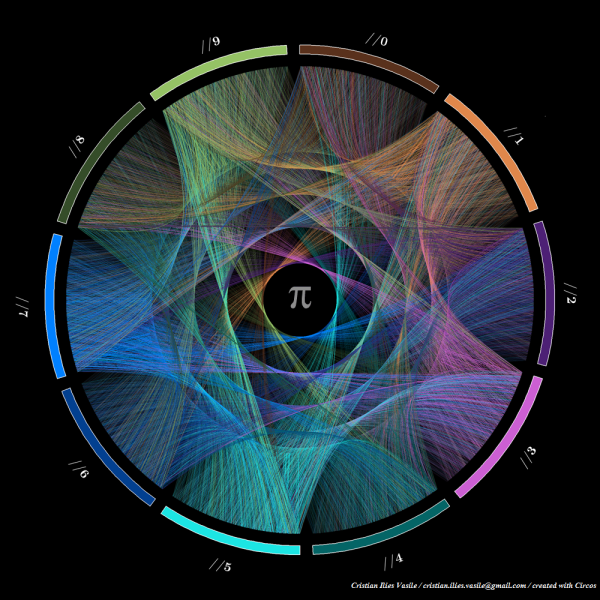
Flow Of Life Flow Of Pi.  Cristian Ilies Vasile designed this visualization of the first 1,000 digits of the mathematical constant pi using Circos to plot the sequence of digits…in a circular pattern of course!.  You can buy a print copy of the poster for $22 from Fine Art America.  Cristian has create a few different varieties of the artwork that you can see on his page.

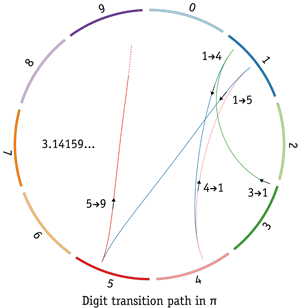
Starting with the first digit “3”, a connecting arc is drawn to each subsequent digit (3.14159265358979323846…).  Since the sequence is theorized to be a random sequence, it creates a beautiful visualization that appears evenly distributed among the digits.  Check out this explanation by Martin Krzywinski along with some of his own artwork.  He demostrates the sequence with this visualization of just the first five digits 3.14159…

I had not heard of Circos before, so I have now added a link to it on the Cool Infographics Tools page.

Thanks to Matt Baker for posting on Google+