About
Randy Krum
President of InfoNewt.
Data Visualization and Infographic Design

Infographic Design

Infographics Design | Presentations
Consulting | Data Visualizations

DFW DataViz Meetup

Join the DFW Data Visualization and Infographics Meetup Group if you're in the Dallas/Fort Worth area!

Search the Cool Infographics site

Custom Search

Subscriptions:


Feedburner

The Cool Infographics® Gallery:

How to add the
Cool Infographics button to your:

Cool Infographics iOS icon

- iPhone
- iPad
- iPod Touch


Read on Flipboard for iPad and iPhone

Featured in the Tech & Science category

Flipboard icon

Twitter Feed
From the Bookstore

Caffeine Poster

The Caffeine Poster infographic

Entries in world (200)

Thursday
Feb072013

Syria: The Basics, an infographic presentation

Syria: The Basics is an infographic slide show using the Prezi presentation tool.  It plays like a movie, and does a great job utilizing the new features of Prezi like Fade-In animation and Audio Overlay.

Designed by Lara Setrakian (@Lara), co-founder and managing editor of Syria Deeply, a single issue news website.  Fantastic design work!  The presentation utilizes data visualization design concepts including relative sizing to put the size of the country into perspective, a timeline layout of events, related news photos and world map information.

Syria: The Basics, an infographic presentation

Monday
Dec312012

Water Changes Everything

I have heard it argued that clean water has been the single greatest medical advancement in mankind’s history.  With effects including longer lifespan, reducing diseases, reducing birth defects and generally improving health, it’s easy to undertand how important clean water is.  Water Changes Everything is an infographic promotional for the Charity Water organization.

I’ve started the “Start 2013 Clean” campaign to raise $1,000 for Charity Water from Cool Infographics readers.  Start off 2013 right, and help me support making the world a better place.

Almost a billion people live without clean drinking water. We call this the water crisis. It’s a crisis because it only starts with water — but water affects everything in life.

Health. Education. Food security. And the lives of women and children, especially.

We can end the water crisis in our lifetime. But first we have to let everyone know it’s happening. Learn how water changes everything — and share this with everyone you know. 

It was an infographic map design by John Snow in 1854 that led to the discovery that a cholera outbreak in Soho, London was geographically tied to the location of a water well.  At the time, the popular belief was that cholera was airborne, and people would become sick by breathing “bad air.”  But John Snow’s early data visualization of reported cases was used to convince local officals to shut down the potentially contaminated well (by removing the handle).  This action is commonly credited with ending the epidemic.

Original map made by John Snow in 1854. Cholera cases are highlighted in black.

Video was designed by Jonathan Jarvis, who also designed the Crisis of Credit infographic video, and the voiceover is Kristen Bell.

Found on Daily Infographic and FastCoDesign

Friday
Dec072012

Nobel Prizes and Laureates Timeline Visualization

Nobel Prizes and Laureates Timeline Visualization 

Nobel Prizes and Laureates is great visualization from the Milanese design firm Accurat.  From 1901-2012 this information design breaks down the winners by category, age, principal university affiliates and even hometowns.

The high-resolution version is available on Visualizing.org

The visualization explores Nobel Prizes and Laureates from 1901 to 2012 analyzing the age of recipients at the time prices were awarded, average age evolution through time and distribution among categories, grade level, main affiliation universities and principal hometowns of the laureates.

Designed as a part of an ongoing series for the Milanese newspaper Corrierre della Sera, La Lettura is a culture supplement.  You can see this design and the rest of the series in the collection on Visualizing.org.

The timeline takes a lot of information, and makes it easy to understand for the readers.  I especially appreciate the transition from line chart of ages to the bar chart of education grade levels to the sankey diagram of universities at the right end of the timeline.  Beautifully done.

Each dot represents a Nobel laureate, each recipient is positioned according to the year the prize was awarded (x axis) and age of the person at the time of the award (y axis).

Found on FastCoDesign

Monday
Nov192012

The Difference Between the United Kingdom, Great Britain, and England

The Difference Between the United Kingdom, Great Britain, and England infographic

Do you know the Difference Between the United Kingdom, Great Britain, and England? This infographic from sa-la.jp spells out the differences. It also includes a timeline of major events and some ideas for the future.

The terminology of the UK is quite complicated, so it’s no wonder that people get confused. Are Great Britain, the UK and England the same thing? Is Ireland part of the UK? What’s Wales!? To help explain things, I put together this infographic to define the parts that make up the UK and how it came about. If you still have any questions by the end of it, feel free to ask in the comment section below.

Really good infographic design that uses different visualization methods in the visual explanation.  Maps, icons and a subway map style timeline are easy to understand, and give the reader a basic understanding of the UK.

The sources should be more specific, linking to specific web pages, and there should be a URL to the original infographic landing page in the footer.

Thanks to Tim for sending in the link!

Tuesday
Nov062012

Daylight Savings Time Explained

Daylight Savings Time Explained infographic

Daylight Savings Time Explained designed by a Visual.ly member under the name Germanium, visually explains the end result of recognizing Daylight Savings Time.  DST is used mostly in North America and Europe, while most of the world does not change their clocks.

I tried to come up with the reason for the daylight saving time change by just looking at the data for sunset and sunrise times. The figure represents sunset and sunrise times thought the year. It shows that the daylight saving time change marked by the lines (DLS) is keeping the sunrise time pretty much constant throughout the whole year, while making the sunset time change a lot. The spread of sunrise times as measured by the standard deviation is 42 minutes, which means that the sunrise time changes within that range the whole year, while the standard deviation for the sunset times is 1:30 hours. Whatever the argument for doing this is, it’s pretty clear that reason is to keep the sunrise time constant.

By visualizing the daylight hours, the reader can see the pattern.  Both the change in total hours, and the impact of daylight hours on their normal day.

The reasoning for DST is very controversial, but now we can see the impact clearly.

Thursday
Jul052012

A Woman's Place: Best and Worst Places To Be A Woman

National Post A Woman's Place infographic

An informative infographic called A Woman’s Place by Richard Johnson at the National Post.  Very interesting analysis of some different ways to measure the best and worst places in the world to be a woman.

Canada ranked 17th on a list of the best and worst places to be a woman in the world. In the report, researchers from Save the Children looked at the health, education and economic status of women in 165 countries to develop the ranking, with Norway claiming the top spot and Somalia the bottom. The National Post graphics department analyzes the data:

I like this use of circles to visualize the scores, numbers and percentages because it’s easy for the viewer to compare values on the page.  Circles are usually tough to differentiate when the values are close together, but there’s enough range in the values here to make the circles effective.

A high-resolution PDF of the infographic is also available.

Found on HolyKaw

Tuesday
May292012

Hans Rosling TEDTalk: Religions and Babies

Another great TEDTalk from Hans Rosling called Religions and Babies about the growth of the world population.

Hans Rosling had a question: Do some religions have a higher birth rate than others — and how does this affect global population growth? Speaking at the TEDxSummit in Doha, Qatar, he graphs data over time and across religions. With his trademark humor and sharp insight, Hans reaches a surprising conclusion on world fertility rates.

In Hans Rosling’s hands, data sings. Global trends in health and economics come to vivid life. And the big picture of global development—with some surprisingly good news—snaps into sharp focus.

Wielding the datavis tool Gapminder, Professor Rosling is a master at using data visualization to tell his story.

The video is also avilable on YouTube for portable devices:

Wednesday
May232012

Fast Facts on Coffee Consumption 

Fast Facts on Coffee Consumption infographic


Pouring in Your Cup: Fast Facts About Coffee Consumption is a good infographic from Hamilton Beach.

This is a good example of a company publishing an informative, marketing infographic about a topic related to their products (coffee makers), without feeling like a sales pitch or ad for their products.  However, I don’t think there is a clear story told by the infographic.  It’s generally a bunch of coffee and caffeine statistics put together in an infographic without a clear message.

I like the design and the simple color palette.  Most of the visualizations are clear and easy to understand except the bunch of coffee cups lined up in the middle.  I think each cup is supposed to represent the 20 cups/week the average office worker drinks, and all of the cups together is supposed to represent a year of coffee consumption.  When you line up images like this, the rows really should have only 10 images each for the reader to easily understand the quantity.  So, there should be 52 cups to represent the whole year, but there are only 48 cups shown.

There are a handful of stand-alone statistics that are just shown in text, that could have been visualized.  The clock image shown next to the stats “24 minutes a day” should have had a highlighted portion showing 24 minutes.  I like the male/female symbols used on the coffee cups, and the Venn-diagram style of coffee blends is great.

I’m going to go pour myself my third cup of coffee this morning…

Found on Infographics Showcase, Infographic Pics and Infographipedia

Friday
Apr132012

Lakes & Oceans: A Deep Infographic


Another great infographic from Randall Munroe’s xkcd online comic.  Lakes & Oceans visualizes the various depths of the worlds water, and even includes…a mysterious door that James Cameron built his deep-sea submersible to reach at the bottom of the Marianas Trench and open?


Found on FlowingData.com

Thursday
Mar222012

The Health Benefits of Guinness vs. Beer

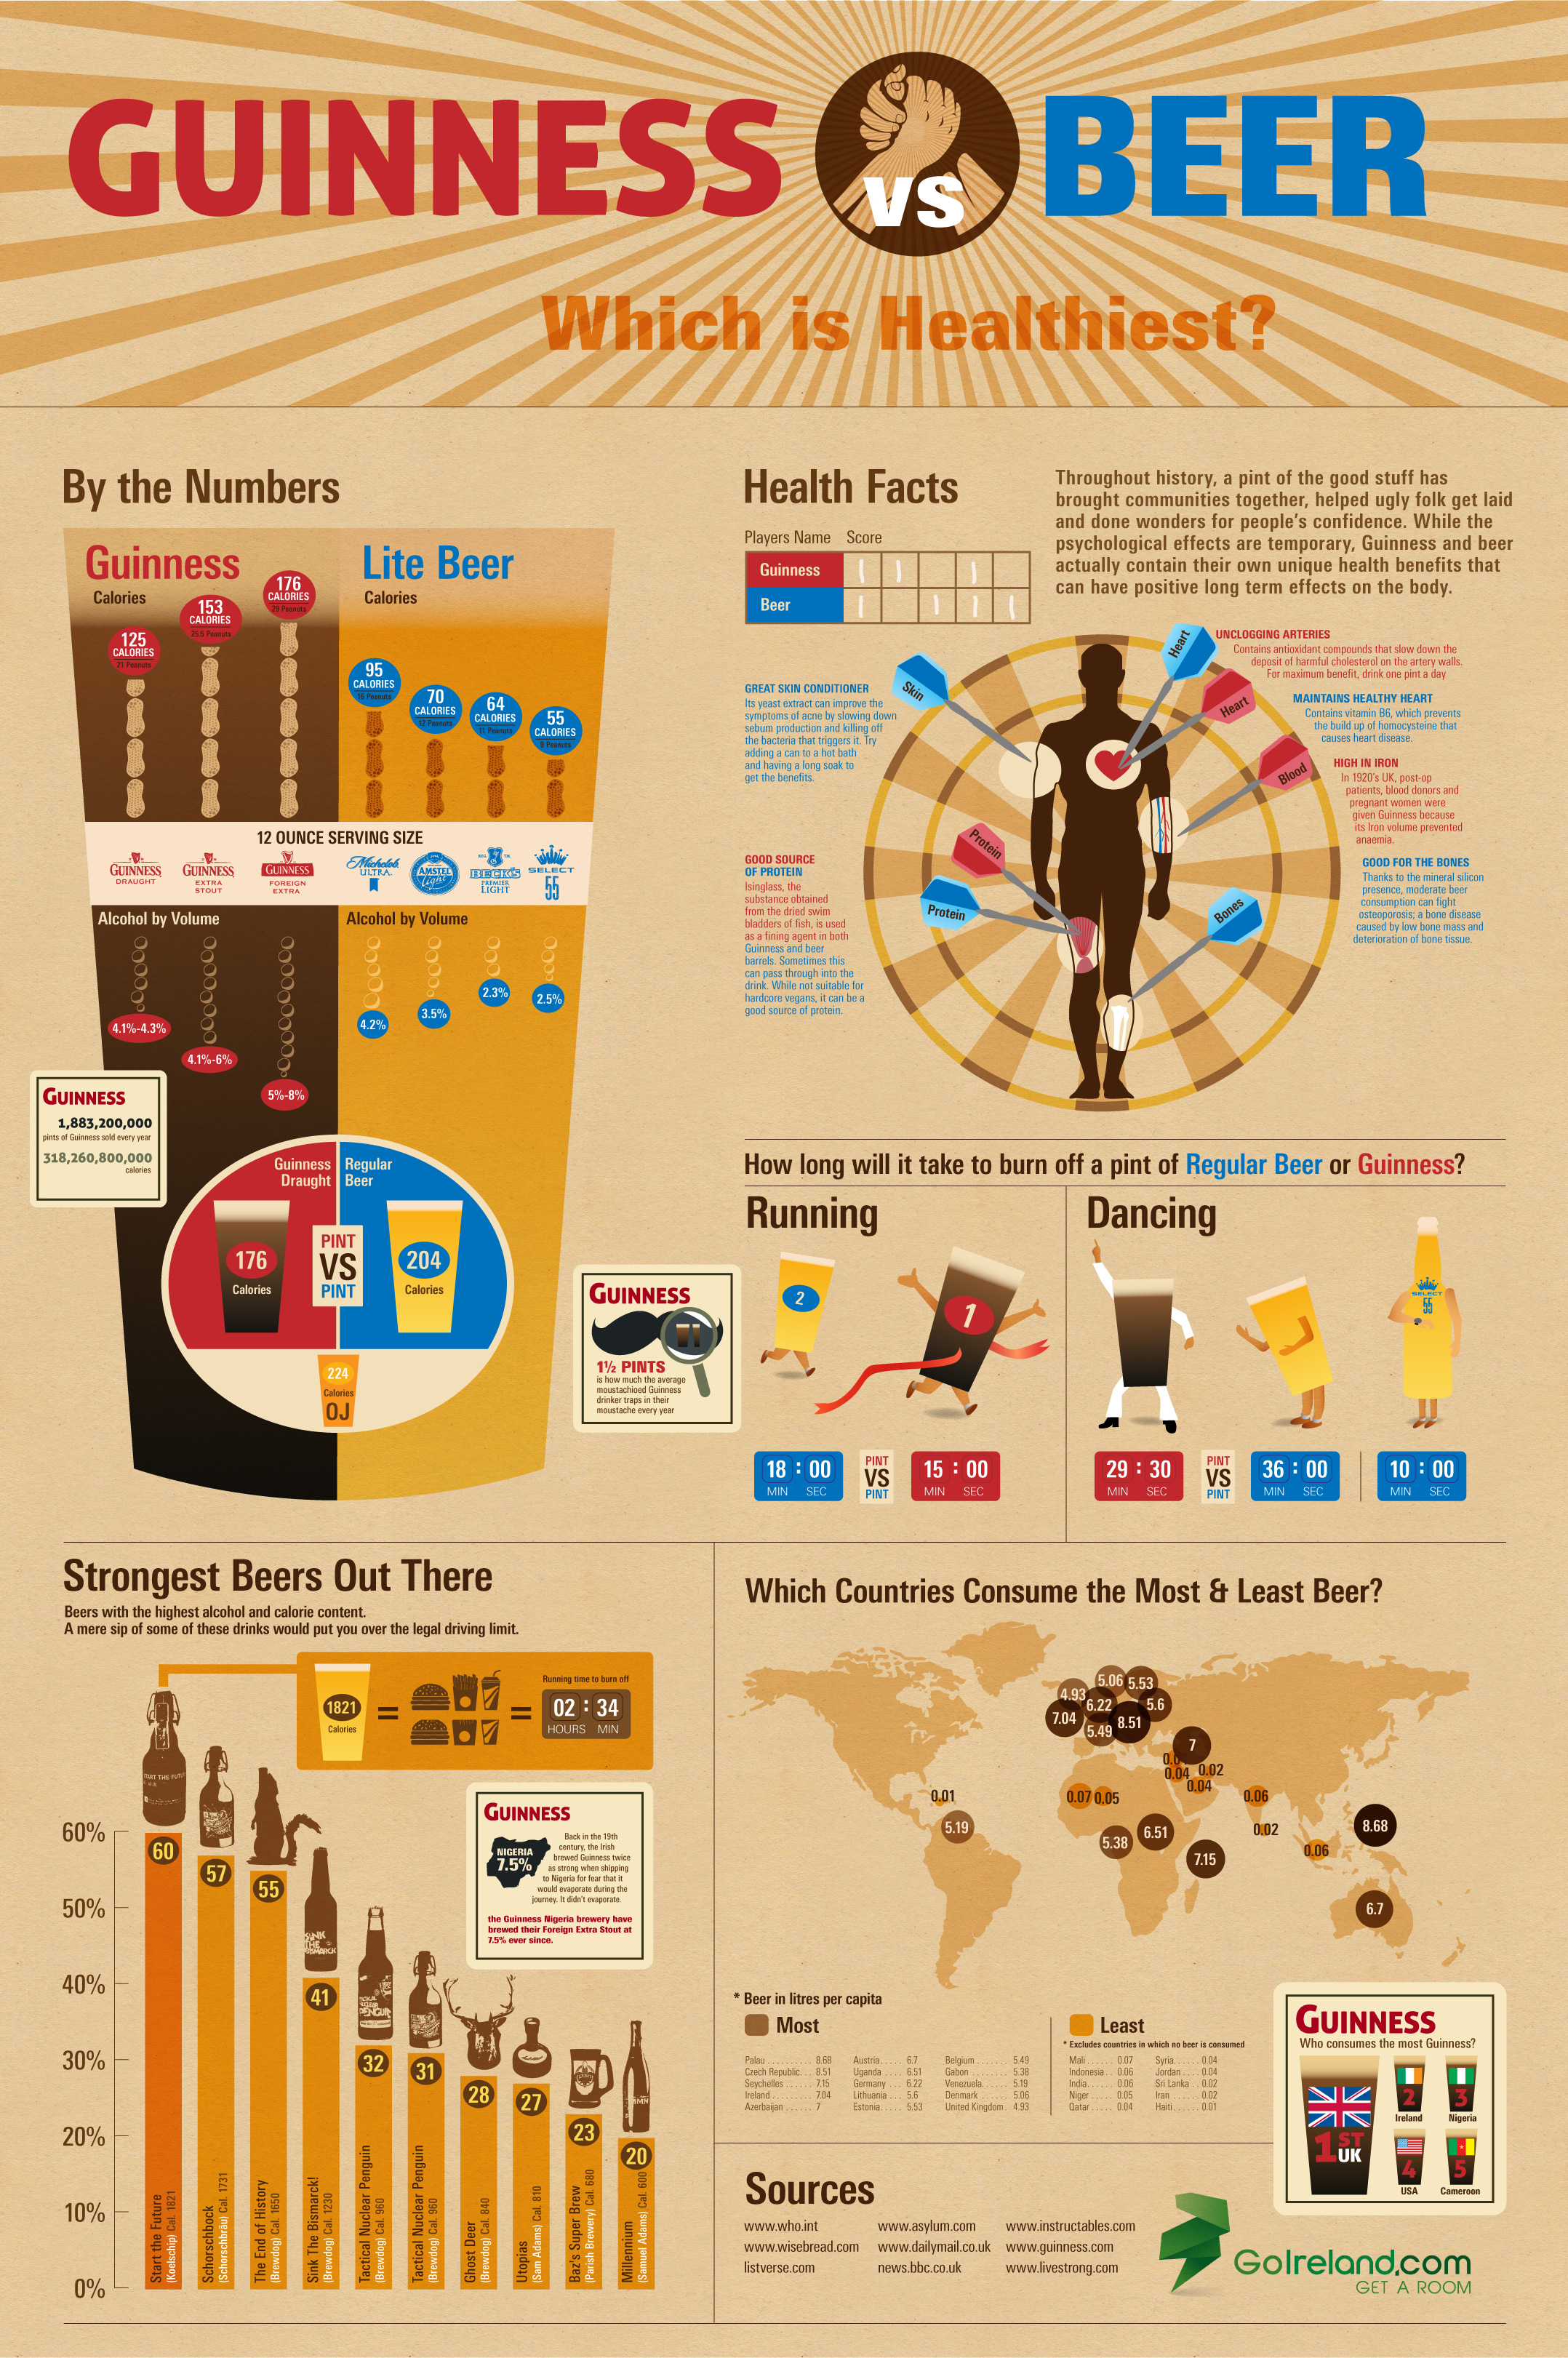
The Health Benefits of Guinness vs. Beer is a new infographic from the team at GoIreland.com.  Primarily focused on calories, this infographic does a good job at visualizing comparisons.

We at GoIreland have rustled up a useful infographic about Guinness and other beers. But not just any infographic about booze. We recognize that folks in the 21st century are more health conscious than ever, so have combined these two facets to look at the health benefits of Guinness vs. other types of beer.

Whether you enjoy the dark stuff, or lean towards lager, the results show that a pint of one, or the other, can have positive effects on various areas of the body, such as the heart, bones and even your skin. Through painstaking research, we even worked out how many individual peanuts each drink is the equivalent to eating, how long it would take to burn off those calories and taken a look at some of the strongest beers known to mankind.

This infographic is really well designed, and it’s focused on one of my favorite drinks in the world!  The visual comparison between Guinness and a handful of light beers is clear and easy to read.  However, when they start comparing to “Regular Beer” it’s unclear what brand they are using as the average beer and where that data comes from.  I like the Running and Dancing comparisons that are fun and make understanding the differences easier to an average reader.

The only visualization error I see is the circles on the world map.  Circles have to be sized by their AREA, so if we assume the Ireland circle is the correct baseline, then the circles for values of 0.06 and 0.02 would only be a couple pixels wide.  The circles in the design are shown larger than their actual values, which is a false visualization.

At the bottom, I wish there was a URL to the original landing page for readers to get back to the original, and some form of copyright statement.

Thanks to Oli for sending in the link!

Here is an alternate, shorter and in my opinion “better” version.  What do you think?


Page 1 ... 3 4 5 6 7 ... 20 Next 10 Entries »