About
Randy Krum
President of InfoNewt.
Data Visualization and Infographic Design

Infographic Design

Infographics Design | Presentations
Consulting | Data Visualizations

DFW DataViz Meetup

Join the DFW Data Visualization and Infographics Meetup Group if you're in the Dallas/Fort Worth area!

Search the Cool Infographics site

Custom Search

Subscriptions:


Feedburner

The Cool Infographics® Gallery:

How to add the
Cool Infographics button to your:

Cool Infographics iOS icon

- iPhone
- iPad
- iPod Touch


Read on Flipboard for iPad and iPhone

Featured in the Tech & Science category

Flipboard icon

Twitter Feed
From the Bookstore

Caffeine Poster

The Caffeine Poster infographic

Entries in world (200)

Wednesday
Oct092013

An Infographic Profile of the Modern Travel Blogger

An Infographic Profile of the Modern Travel Blogger

An Infographic Profile of the Modern Travel Blogger from the Sandymount Hotel in Dublin, Ireland, takes a closer look at answering the question “Who are these travel bloggers?”

As today marks the start of the TBEX European Conference – the world’s largest gathering of travel bloggers, writers and new media content creators – we thought we would celebrate their choice of Dublin as this years’ venue with an infographic profile of the modern travel blogger.

Today and tomorrow, Dublin will play host to scores of travel bloggers and writers, but what makes a contemporary travel blogger? It’s an interesting and pertinent question – it’s a demanding occupation (albeit a fun one!) and one that requires a huge amount of hard work, dedication and the potential of not making a huge amount of money, at least in the formative years.

So what’s the average profile of the modern travel blogger? How old are they? What countries do they visit? How do they monetise their writing and what contemporary technology do they utilise to facilitate their writing? To answer these questions and numerous others, we completed an in-depth survey of travel bloggers, giving us some revealing and unique insights into what makes up a travel blogger.

Rather than present all our finding in a page of text, we thought we’d turn them into a far more eye-catching format, so here’s our infographic profile of the modern travel blogger:

The design is clean with a great color palette.  It’s easy for readers to look through the information quickly.

A few of the statistics are shown in text only, while others are visualized.  The stats in text only will be perceived as less important by readers, and I don’t think that was the intent of the designers.  If the data is important enough to include in the infographic, they should also be visualized.

Thanks to David for sending in the link!

Tuesday
Sep102013

Our World Ski Calendar โ€“ Seasonal Ski Resorts around the World 

Our World Ski Calendar – Seasonal Ski Resorts around the World infographic

Avid Skier? Want to know where to go at anytime during the year? Our World Ski Calendar – Seasonal Ski Resorts around the World infographic from Monarch has all the financial and event information that you need to know to plan a ski trip during any month out of the year!

To celebrate our new ski flights we produced a world ski calendar so you can ski all year round across the world. For each destination we have provided some interesting stats plus individual piste information. Let us know your favourite ski destination by commenting below!

Thanks to Sam for sending in the link!

Thursday
Jun132013

Visualizing International Criminal Tribunals


Visualizing International Criminal Tribunals

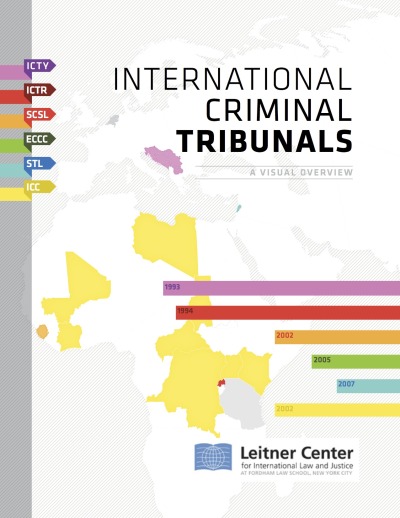
Very cool report that uses data visualization and infographics design to communicate complex information about International Criminal Tribunals from the Leitner Center for International Law and Justice at Fordham Law School, New York City.

The Leitner Center launches a new report, “International Criminal Tribunals: A Visual Overview,” providing an introduction to the work of the international tribunals and the conflicts which led to their establishment. Despite widespread interest in these tribunals and the view that they represent a definitive advance of international law and justice, there is also much confusion and misconception about their work. This new 90-page report, providing analysis and information through written summaries and detailed visualizations, aims to make the work of the courts more accessible to the general public and legal professionals alike.

Media attention dedicated to the work of the tribunals is too often superficial, and tends to confuse key distinctions between them; more informed scholarship, on the other hand, is largely confined to specialty publications, remaining inaccessible to most. “International Criminal Tribunals: A Visual Overview,” aims to provide well-researched and accessible information for anyone wishing to more fully understand these issues. This will help democratize engagement with these courts, which are tasked with delivering justice for victims of some of the world’s worst atrocities. Examples of the visual graphics in the report are included below.
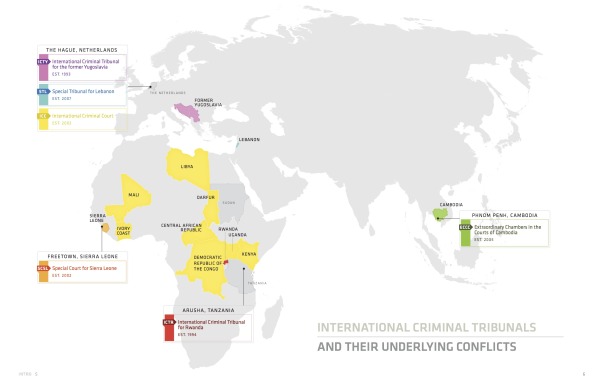
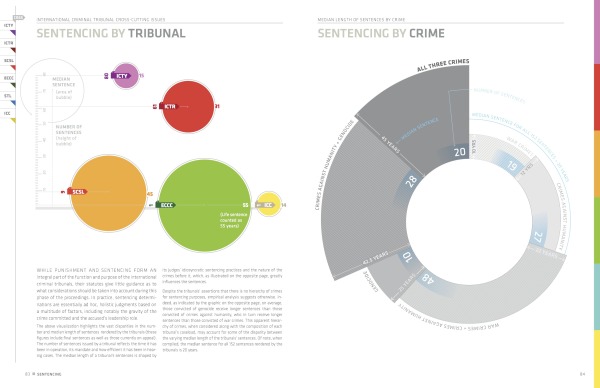
 

Awesome use of different styles of data visualization to summarize the often-complex information behind these tribunals.  Timelines, maps, area charts, polar grids, rose diagrams and treemaps.  The Case-by-Case timeline are fascinating.

The complete report is publicly available as a PDF for download.

I asked Daniel McLaughlin a few questions about the development and design of the report:

Cool Infographics: What software, websites or tools did you use to create the visualizations?

Daniel: We used Adobe Illustrator and InDesign to create the visuals for the report.

Cool Infographics: Did you create the report yourself, or use a design team?

Daniel: As a lawyer working with law students on this project, I was dependent on graphic and information design volunteers to create the visuals. The students and I carried out all the substantive research and then worked with these volunteers to figure out how best to translate it visually. Paula Airth of www.bepeculiar.com, in particular, was instrumental in bringing the project to life.

Cool Infographics: How long did the report take to design and put together?

Daniel: The report started out as a short (8-9 page) publication on the work of the international criminal tribunals. It grew into the present 90 page version as we continued to accumulate new data and the graphic/information design volunteers continued to create new graphics. All told, the research took around 4 months and the creation of the visuals/layout took another 5 months or so.

Cool Infographics: How has the use of data visualization design and social media impacted your marketing?

Daniel: The goal of this publication was to make the work of the international criminal tribunals more accessible to lawyers and non-lawyers alike. As indicated in the publication,

“There is wide awareness, though little true understanding, of the work of the international criminal tribunals.  International prosecutions of high-ranking civilian and military leaders, including former heads of state, on charges of crimes against humanity, war crimes and genocide, represent for many the ultimate condemnation of these individuals’ past actions and a measure of their fall from power. Yet, despite the tribunals’ grasp on the popular imagination, they are the subject of significant misconceptions and confusion. Much of the media coverage dedicated to their work remains superficial, at best, and largely muddles over key distinctions between various tribunals, past and present. Conversely, the more informed scholarship is largely confined to specialty publications that remain inaccessible to most. In truth, many lawyers and non-lawyers alike lack a clear understanding of the role and functioning of these increasingly-pivotal international institutions.  This publication seeks to redress this knowledge gap by providing well-researched and accessible information for those wishing to more fully understand the international criminal tribunals and the conflicts over which they have jurisdiction. An informed public is an engaged public - and the issues that animate these tribunals, including delivering justice for victims of some of the world’s worst atrocities, are too significant to be discussed solely by a small cadre of international criminal law specialists.

Notably, this publication was created in partnership with graphic and information designers so as to reach a broader public. The designers’ visualizations present information regarding the tribunals and their underlying conflicts in a direct and accessible manner to a wide range of viewers, including those without a legal background. Beyond this democratizing function, information visualization also serves to reveal important data and trends that might otherwise go unnoticed in a more conventional format. Ideally, the following information, which is current as of January 2013, would be integrated into a continually updated interactive webportal dedicated to engaging a global public on issues of international justice.

In sum, this publication aims to facilitate a broader discussion of the international criminal tribunals’ notable accomplishments, as well as ongoing shortcomings.”


Thanks to Daniel McLaughlin for sending in the link!

Thursday
May302013

Water in the Anthropocene

Water in the Anthropocene is a very cool infographic video looking at the different ways we humans are changing the global water cycle.

Water in the Anthropocene is a 3-minute film charting the global impact of humans on the water cycle.

Evidence is growing that our global footprint is now so significant we have driven Earth into a new geological epoch — the Anthropocene.

Human activities such as damming and agriculture are changing the global water cycle in significant ways.

The data visualisation was commissioned by the Global Water Systems Project for a major international conference (Water in the Anthropocene, Bonn, Germany, 21-24 May, 2013). 
conference2013.gwsp.org

The film is part of the first website on the concept of humans as a geological force, anthropocene.info

Thanks to Owen for sending in the link!

Monday
Apr292013

What Guests Want...at Hotels

What Guests Want at Hotels infographic

Hotels.com has released the 2013 version of their Global Hotel Amenities Survey, summarized in the infographic What Guests Want.  Part of an ongoing series from Hotels.com on their press site, the infographic takes a fun look at what hotel-stayers value most.  Apparently everyone wants free WiFi!

You just checked into your favorite hotel and are ready to enjoy all it has to offer. What kind of amenities inspire you? We surveyed travelers from all over the world to see what perks they valued most when spending a night away from home. 

The infographic is an additional content piece to the release of the complete survey, Global Travelers Want To Stay Connected And Comfy.  The Hotels.com press site is primarily targeted at an audience of hotel industry executives and the news media, and they maintain a dedicated infographics page.  The addition of the infographic to the press release helps to make the often dry survey data more engaging, and additional press releases were also published to highlight some of the hidden gems in the data: Danish Hotel Guests Most Honest; Americans Come In 23rd Place

Designed by Jeremy Yingling with InfoNewt, the infographic is essentially an executive summary of the much larger survey report that Hotels.com publishes each year.

I’ve posted a short, behind-the-scenes Q&A with Hotels.com about their experiences using infographics on the InfoNewt blog.

Thursday
Apr042013

How Far is it to Mars?

How Far is it to Mars? motion infographic

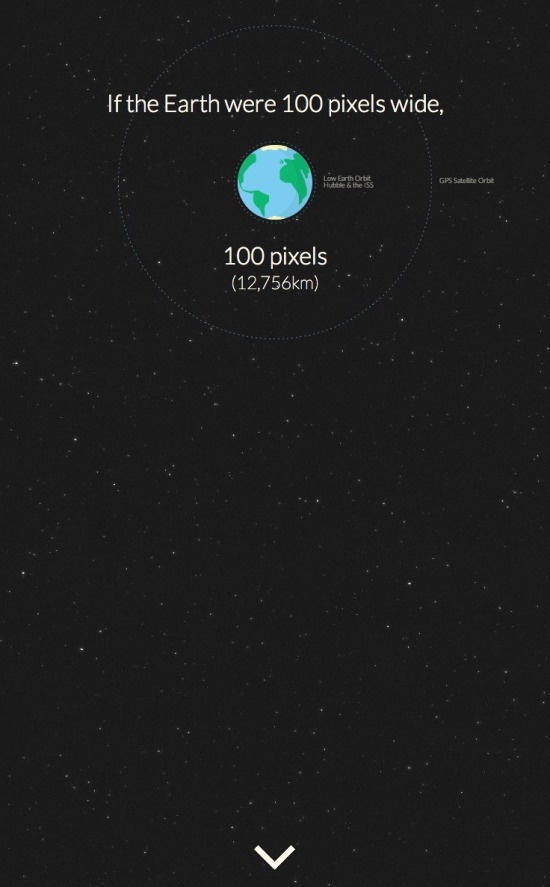
How Far is it to Mars? by David Paliwoda is a fantastic animated, interactive infographic website that shows the viewer the scale of the distance to the Moon and to Mars as measured in pixels.  David calls this a motion-infographic.

Click the image above to see the animated site.  Very cool! 

Found on Daring Fireball

Thursday
Mar282013

Asteroids!

Asteroids Close Encounters infographic

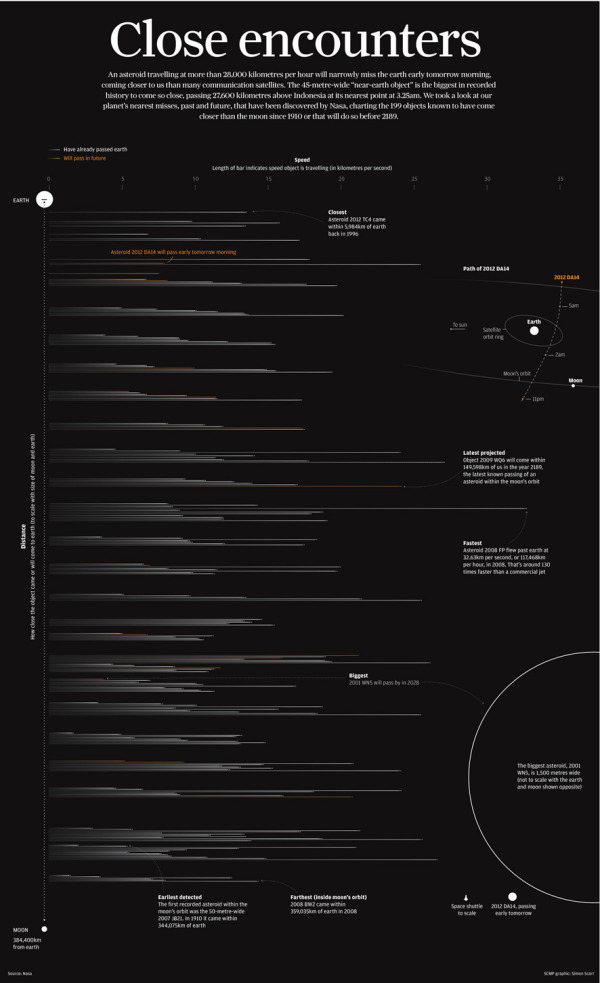
Simon Scarr is doing some great work as the Graphics Director at the South China Morning Post in Hong Kong.  Last month he designed Close Encounters, the full-page visualization of the Near-Earth-Objects that have passed within the Moon’s orbit (or will pass by) from 1910-2189.

A 45-metre-wide asteroid came remarkably close to Earth on Friday, even closer than communication and weather satellites. It was be the nearest known close miss for an object of its size.   

When this story was first mentioned in the newsroom, a few days before the incident, it sparked debate. People were intrigued as to how close these objects come to Earth. How many pass by? And how fast or large are they? A perfect opportunity for an interesting graphic.    

As usual, NASA had every piece of information we needed. Their Near-Earth Object Program was established in 1998 to help coordinate, and provide a focal point for the study of comets and asteroids that can approach the Earth’s orbit. They have data sets on all close approaches to Earth since 1900 and projected forward to 2200.    

This is a beautiful design that shows the distances to scale by placing them in between the Earth and the Moon, and the horizontal lines show the relative speeds of all the objects.  Orange lines are future, predicted passes.

Simon has posted more behind the scenes information about putting this infographic design together on his own blog.  I highly recommend the post, and you can check out his other work.

Found on Visual Loop.


Monday
Mar252013

The Water Rich vs The Water Poor

The Water Rich vs The Water Poor infographic

The USA is lucky to be in the top 5 countries that have annual renewable water resources. Because of this, we are very wasteful. This is considered to be “Water Rich”.  For the countires that are considered Water Poor, they do not have the wasteful luxury, in fact 88% of fatal cases are due to inadequate water access. The Water Rich vs Water Poor infographic by seametrics.com tells the story of both water rich countries and water poor countries.

While some might say gold or diamonds, as far as human life goes, water is the world’s most precious commodity.  As the world population increases, and industry continues to expand, Earth’s freshwater reserves are being stretched dangerously thin.  See the disparity in water consumption between wealthy and underdeveloped nations.

This is a good side-by-side comparison design, that has a lot of information.  Maybe too much information, because it can be overwhelming to readers.

Thanks to Ngoc for sending in the link!


Side note: There are only 5 DAYS LEFT to participate in the Cool Infographics Start 2013 Clean charity drive!  If you are able, please visit our campaign on Charity:Water and donate to the cause of providing clear, drinkable water to everyone that needs it.

Thursday
Feb142013

I Love You in 130 Languages

I Love You in 130 Languages infographic pink

Fun design for Valentine’s Day from GlobalNova.  The I Love You Map, shows the phrase “I Love You” translated into 130 different languages and positioned on the map based on the primary language spoken in that country or region of the world.

When setting out on any language-related project, one can count on unexpected discoveries and changing perspectives.  Our World Valentine project seemed simple to me at the outset – just map ‘I love you” in 100 or so languages onto a world map.  I thought of it pretty simply as a Valentine card for my wife.

But the real blow landed in choice of languages.  Setting out with no goal beyond rendering a selection of languages geographically, I quickly wandered into a thicket.  Where did Mongolian go? And many others?  Were we bounded by chance and limited space, or less forgivably prey to political naiveté? 

Here is the design also in Black:

I Love You in 130 Languages infographic black

Thanks to Matt for sending it the link!

Monday
Feb112013

The Submarine Cable Map 2013

The Submarine Cable Map 2013 infographic poster

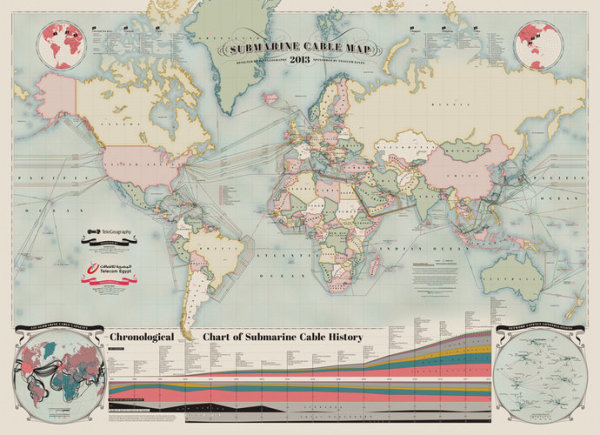
A beautiful map of the World’s undersea Internet cables, The Submarine Cable Map 2013.  Brought to us be TeleGeography, sponsored by Telecom Egypt and design credit is listed as Nick Browning, Markus Krisetya, Larry Lairson, Alan Mauldin.

Cables depicted include all active international and U.S. domestic cables.  In-service cables have an announced Ready for Service (RFS) date by December 31, 2012.  Planned cables include those actively under construction and those that have announced they were fully funded as of year-end 2012.  Map does not depict proposed cables that have not announced landings or configuration.  Cable routes are stylized and do not reflect physical cable location.

I love the hand-drawn design style, meant to pay homage to old maps, but overlaid with very current information.  This is also available for purchase as a poster 36” x 50” for $250.

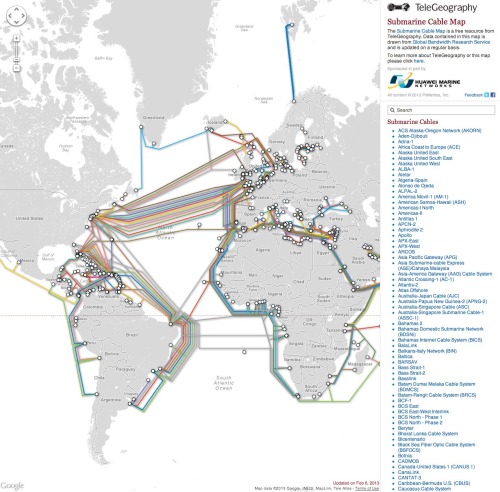
An interactive website with more information about all of the cables is also run by TeleGeography and can be found at submarinecablemap.com

Found on FastCoDesign.