About
Randy Krum
President of InfoNewt.
Data Visualization and Infographic Design

Infographic Design

Infographics Design | Presentations
Consulting | Data Visualizations

DFW DataViz Meetup

Join the DFW Data Visualization and Infographics Meetup Group if you're in the Dallas/Fort Worth area!

Search the Cool Infographics site

Custom Search

Subscriptions:


Feedburner

The Cool Infographics® Gallery:

How to add the
Cool Infographics button to your:

Cool Infographics iOS icon

- iPhone
- iPad
- iPod Touch


Read on Flipboard for iPad and iPhone

Featured in the Tech & Science category

Flipboard icon

Twitter Feed
From the Bookstore

Caffeine Poster

The Caffeine Poster infographic

Entries in world (200)

Thursday
Sep112014

A Comprehensive Look at the Ebola Virus

A Comprehensive Look at the Ebola Virus infographic

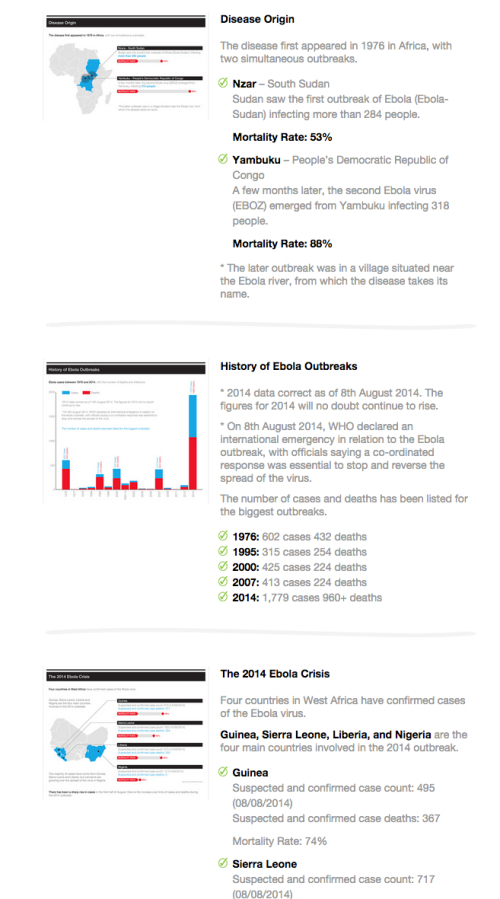
The newest outbreak of Ebola virus caused a lot of panic due to the lack of public knowledge of the disease. Buddy Loans has created A Comprehensive Look at the Ebola Virus infographic to increase (or maybe in this case decrease) the public’s exposure to the disease.

2014 has seen the worst outbreak of Ebola Virus Disease (EVD) in history, with WHO reporting more than 1,700 cases worldwide (as of August this year). In this infographic we take an in-depth look at the virus (formally known as Ebola Haemorrhagic Fever) and its history, origin, genus, transmission, symptoms, fatality rate, and treatment.

All information is correct as of mid-August 2014. Data sources include the World Health Organisation (WHO), the Center for Disease Control (CDC), Medecins Sans Frontieres (MSF), the BBC, The Guardian, and other high profile news outlets.

Infographics that explain anything health or medical related tend to be a little word heavy, due to their job of thoroughly and explaining complex information. This is a very clean design that implies authority and credibility, and uses a very simple red-blue color scheme. 

The chart in the History of Ebola Outbreaks section is interesting. They chose to only include the data of the biggest outbreak years instead of including every year on the timeline. This is a good method to use when you have a lot of specific data you want to highlight in a small space. If this infographic was focusing on a comparison between the good years and the bad years of Ebola, then including the data sets from smaller years would be appropriate.

The stacked bar chart is also a little tough to understand, and might have worked better as a clustered bar. The blue bar is the total number of reported cases, and the red bar is the portion of those cases that resulted in death. Not the normal way that people use a stacked bar chart.

I like that each section uses a different visualization method (bar chart, map, doughnut chart, etc.).  That makes it easier for the audience to read through clear separations between the sections.

The infographic landing page is also worth noting. On the original landing page, they correctly included some intro text, the full infographic, social sharing buttons and embed code for anyone that wants to post the infographic on their own site. They added a longer text description with more information about each data visualization. This gives reads additional incentive to view the original web page and provides additional text for the search engines to associate with the infographic.

Thanks to David for sending in the link!

Wednesday
Aug202014

Why are Superior's Cotton Threads 'Superior'?

Why are Superior's Cotton Threads 'Superior'? infographic

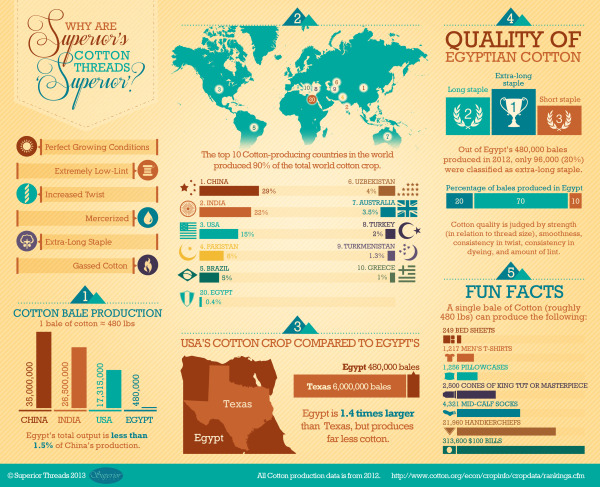
An infographic with information about Superior’s cotton from Egypt, Why are Superior’s Cotton Threads ‘Superior’? created by Superior Threads. This infographic focuses on comparing Egypt’s cotton to other cotton growing countries.

We created an infographic which explains why Egyptian-grown Cotton is so fantastic. Our Cotton threads are truly made from Cotton plants which are grown and harvested in Egypt.

Egyptian-grown extra-long staple Cotton

We put a lot of emphasis on ‘Egyptian-grown extra-long staple’ as a description for our Cotton threads. This is because the highest quality cotton available is Egyptian-grown extra-long staple Cotton when it comes to the textile/thread industry. ‘Extra-long staple’ means less lint and stronger thread. Egypt has the perfect growing conditions for Cotton and the result is a naturally strong and beautiful fiber.

The infographic gets straight to the point with answering its question about what makes Superior’s cotton so great. You can see in the text blurb above that Superior’s cotton comes from Egypt; however, it is not stated anywhere in the infographic.  So that information is lost when people share the infographic by itself.  Infographics take on a life of their own online, and all of your information needs to be included in that image file.

This is a great example for product companies.  Every product has a story about what consumer need it fills, or how it compares to the competition.  Companies should be using more infographic to help tell those stories to their potential customers. 

Thanks to Betsy for sending in the link!

Wednesday
Jul302014

World Records from the Commonwealth Games


World Records from the Commonwealth Games infographic

IVC Signs has compiled some statistics about the commonwealth games into the World Records from the Commonwealth Games infographic. Find out record holders names, time, and place where each record was made!

Following on from being appointed the official signage supplier for the 2014 Games, IVC Signs have followed this up with this fantastic info graphic, packed full of world records and global statistics from the Commonwealth Games over the decades.

The infographic has great, fun illustrations to portray the sports that are being discussed. I would of liked to see a better interpretation of time, distances and locations rather than the same graphic icon over and over again with the value underneath it. The infographic is missing the URL link at the bottom, as well as a list of sources.

Thanks to David for sending in the link!

Wednesday
Jul302014

Around the World in 80 Hats

Around the World in 80 Hats infographic

Around the World in 80 Hats infographic from Venere is a quick culture trip around the world with a little help from a fashionable article of clothing, hats.

All cultures of the world use the clothes they wear to define how they live, work, and respect their history. From the first world to the third world, hat styles especially have become important iconic markers of cultural dress. This infographic looks at 80 culturally significant hats from all corners of the earth, showing just how wonderfully diverse and interesting humanity can be.

A story like this depends on the visuals.  You have to see the hats to understand the history and connection to each country.  The footer should include the URL to the infographic landing page in text so readers can find the original when other sites post the infographic without the link.

Thanks to Thomas for sending in the link!

Tuesday
Jul012014

Defining Moments in Canadian History

Defining Moments in Canadian History infographic

Happy Birthday Canada! To celebrate, American Appraisal has created the Defining Moments in Canadian History infographic to commemorate the last 147 years that have shaped Canada into what it is today.

July 1st is Canada Day and from coast-to-coast, Canadians will celebrate our country’s 147th birthday with pride.

To kick off celebrations, here’s a fun infographic with little-known facts about Canada, events that made headlines, and uniquely Canadian milestones.

I like the visual timeline of major events and milestones with illustrations and icons.  The statistics should be visualized though.  Big fonts are not data visualizations, and numbers alone don’t give the audience any context about the values.

Thanks to Christine for sharing!

Wednesday
Jun182014

World Cup Final Stadiums: A Visual History

World Cup Final Stadiums: A Visual History infographic

The World Cup is in full swing with group play starting last week. We cannot tell you who will be the winner of this World Cup; however, the World Cup Final Stadiums: A Visual History infographic from Grass Form can tell you the countries, stadiums, and winners of the past.

La Coupe de Monde. La Copa del Mundo. The World Cup. No matter what language you say it in the biggest competition in football always means the same thing; a summer festival for millions watching the beautiful game.

Every edition of the World Cup is special in it’s own right but this year stands out from the rest; football is heading back to its spiritual home, Brazil.

The Seleção are aiming for a historic sixth triumph in front of an expectant home crowd – the pressure is on for Neymar & co. to deliver the goods in classic Jogo Bonito style.

Of course part of the World Cup legend are the iconic stadia; from the timeless twin towers of Wembley to the newly-revamped Maracanã which will take pride of place at this year’s tournament, these coliseums have provided the platforms for the most iconic moments in the history of the game.

A good visual representation of each stadium. Adding the flag of the host’s country on top of each of the stadiums is great touch. However, underneath the stadiums, we could use some better visuals.  The design could have visualized the relative sizes of the stadium capacities and used the flag of the winning teams.  The year each stadium was built isn’t really relevant information.

I love the topic choice by Grass Form, a turf company.  More information could have been included in the infographic about the type of grass used in each stadium to make the topic even more relevant to the publishing company.

Thanks to Dave for sending in the link!

Thursday
May292014

Born in 2010: How much is left for me?

Born in 2010: How much is left for me? infographic

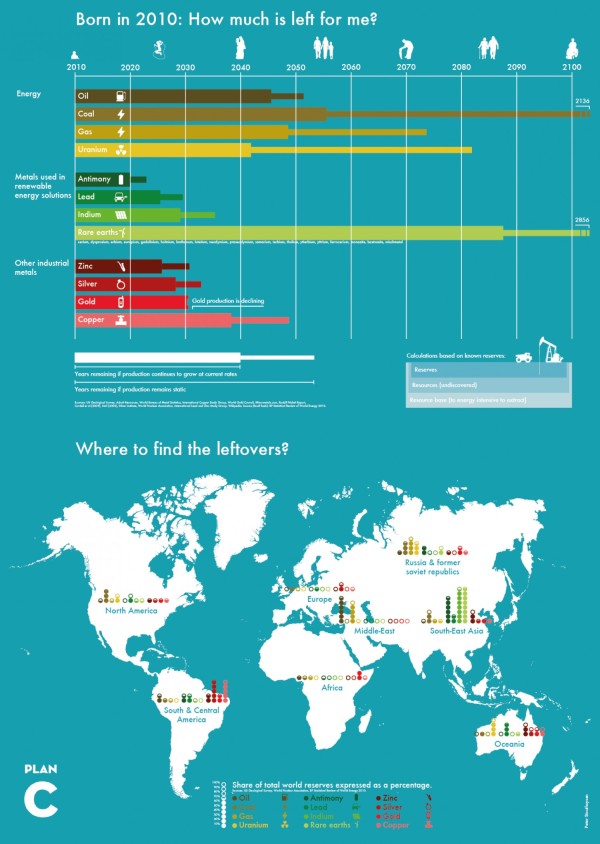
Resources are running low. The Born in 2010: How much is left for me? infographic puts the amount of each energy resource, metals used in renewable energy solutions, and other industrial metals left in perspective and which country to find them in. The infographic was created by Plan C.

I like the timeline design at the top.  Graphing the remaining resources is much more effective than telling someone in text that there are only 35 years of oil left.  However, I find the map visualization at the bottom confusing.  The color-coding and odd range of filled circles is difficult for readers to comprehend.

Found on Visual.ly

Friday
May022014

The Deadliest Animal in the World

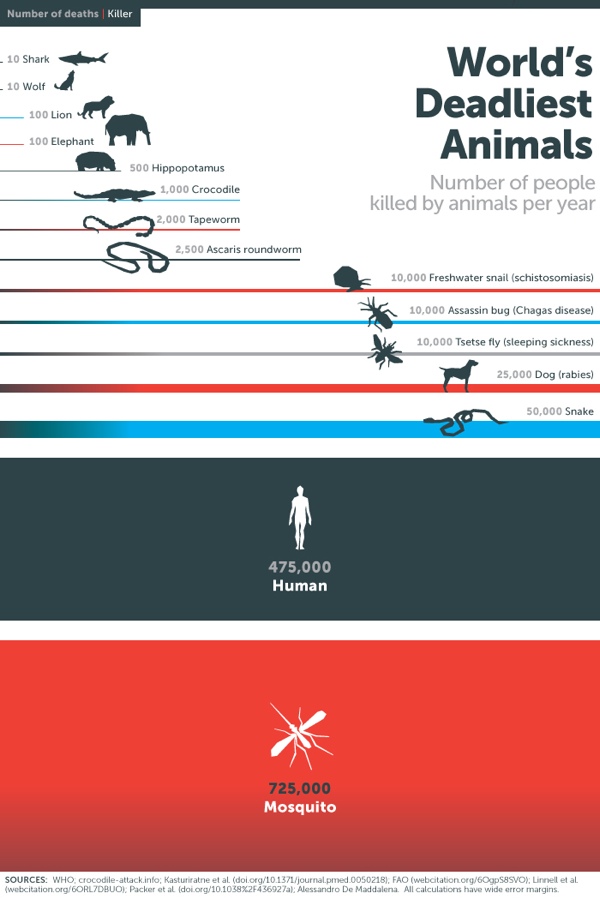
The Deadliest Animal in the World is an infographic posted by Bill Gates on his blog as part of Mosquito Week.

What would you say is the most dangerous animal on Earth? Sharks? Snakes? Humans?

Of course the answer depends on how you define dangerous. Personally I’ve had a thing about sharks since the first time I saw Jaws. But if you’re judging by how many people are killed by an animal every year, then the answer isn’t any of the above. It’s mosquitoes.

When it comes to killing humans, no other animal even comes close. Take a look:

Considering their impact, you might expect mosquitoes to get more attention than they do. Sharks kill fewer than a dozen people every year and in the U.S. they get a week dedicated to them on TV every year. Mosquitoes kill 50,000 times as many people, but if there’s a TV channel that features Mosquito Week, I haven’t heard about it.

This infographic does a number of things right from a design perspective, but the major point is that as humans we see the two-dimensional area of objects as representing the values.  This design uses both the width and height of the rectangles to visualize the scale of deaths caused by the various animals.

Sometimes it might be too subtle.  For example, the width is the same for the rectangles for tapeworms and crocodiles, but the height of the tapeworm box has twice the height to represent the value correctly.

The other thing it does well is to tell one story really well.  There’s isn’t any extraneous information like geographic locations or animal populations.  The infographic focuses on communicating one set of data.

Because the infographic will be shared online without the rest of the article, there are three piece of information that are missing from this design:

  1. The Gates Notes logo, or some type of identification of who published the infographic
  2. A copyright or Creative Commons license state to clearly identify the rights for people sharing the infographic
  3. The URL of the article where readers can find the original, full-size infographic and the associated text.

Thanks to Peter for recommending the link!

Friday
Mar212014

Life Expectancy at Birth

Life Expectancy at Birth infographic

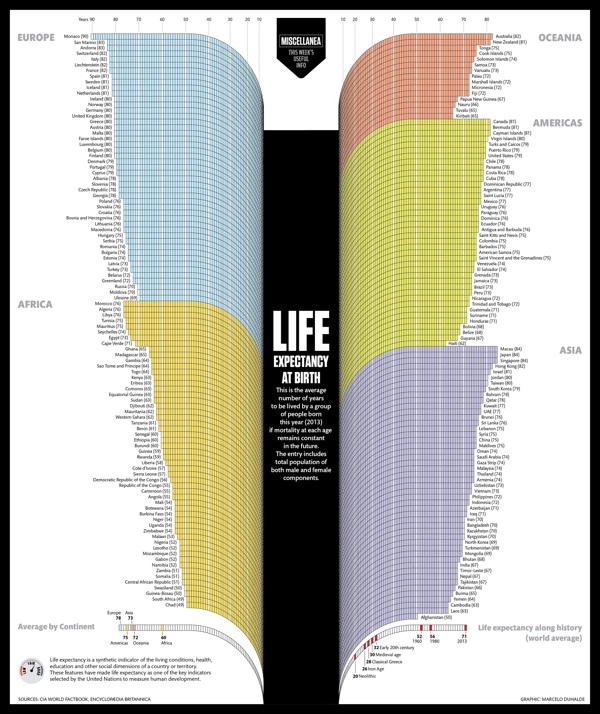
The Life Expectancy at Birth infographic by designer Marcelo Duhalde from Muscat, Oman is a fantastic data visualization of the current life expectancies by country if you were born 2013.

Average number of years to be lived by a group of people born last year (2013) if mortality at each age remains constant in the future.  The entry includes total population of both male and female components.

From a design perspective, this infographic tells one story really well.  The infographic focuses on communicating one set of data effectively (lifespan) without complicating the design with additional extraneous information.  The overall design is very attractive, and grabs the audience’s attention with a big, central visual element.  The curving bars are unusual, but have the benefit of condensing the early years so they take less space in the overall design.

At the macro level, it’s obvious there is a big difference between the various countries and continents.  The readers are drawn in to compare the details of the different countries they are familiar with.  Usually starting with where you live, and then looking to see which countries fare better or worse than your location.  Of course the data represents a massive generalization of millions of people, but does tell a great story at that higher level.

The design looks like it’s perfectly sized to be printed as a poster, but I couldn’t find any mention of one.  The sources could definitely be more specific than just listing the top level sites that data was gathered from, and the URL to the infographic landing page on Visualizing.org should have been included in the footer information.

Found on PolicyMic

Friday
Jan172014

Where in the World are the Best Schools and the Happiest Kids?

The Best Schools and the Happiest Kids infographic

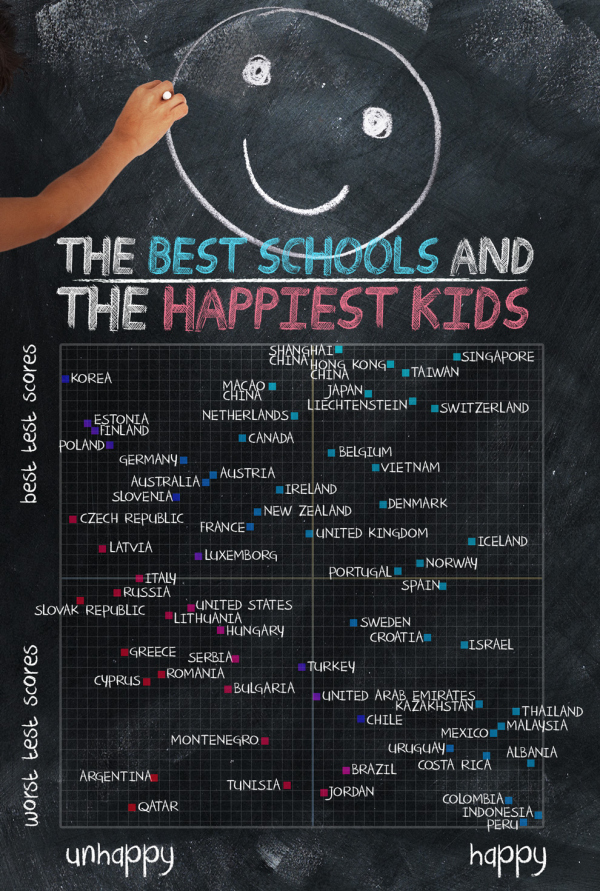
The best test scores don’t always mean the happiest kids at school.  The Best Schools and the Happiest Kids visualizes the results from a worldwide survey of over 500,000 15-year-olds globally.

The Organisation for Economic Co-operation and Development’s triennial international survey compared test scores from 65 countries. Happiness was ranked based on the percentage of students who agreed or disagreed with the statement “I feel happy at school.” Test scores were ranked based on the combined individual rankings of the students’ math, reading, and science scores.

I can’t tell for sure, but it appears that Jake Levy, Data Analyst at BuzzFeed created this data visualization based on the data from OECD survey results.  Infographics like these often get shared without the rest of the article, so it’s important to include all of the necessary framing information in the graphics itself.  Title, descriptive text, sources, URL, publishing company, copyright, etc.

Thanks to Ron Krate on Google+ for posting