About
Randy Krum
President of InfoNewt.
Data Visualization and Infographic Design

Infographic Design

Infographics Design | Presentations
Consulting | Data Visualizations

DFW DataViz Meetup

Join the DFW Data Visualization and Infographics Meetup Group if you're in the Dallas/Fort Worth area!

Search the Cool Infographics site

Custom Search

Subscriptions:


Feedburner

The Cool Infographics® Gallery:

How to add the
Cool Infographics button to your:

Cool Infographics iOS icon

- iPhone
- iPad
- iPod Touch


Read on Flipboard for iPad and iPhone

Featured in the Tech & Science category

Flipboard icon

Twitter Feed
From the Bookstore

Caffeine Poster

The Caffeine Poster infographic

Entries in design (479)

Wednesday
Jan272016

Color Trends from 2015

Color Trends of 2015 infographic

Hopefully by now you have stopped mistaking the date for 2015. So as we say our final good byes to 2015, let us take a look back on the year with Shutterstock's Color Trends of 2015 infographic.


Color Infographic Video from Shutterstock on Vimeo

Shutterstock's data team identified the fastest growing colors over the past year by matching pixel data with image download behavior from our customers including brand marketers and creative professionals around the
world.

The report identifies four colors that have grown most in popularity this year are:
Color #01B1AE contains mainly GREEN color, considered cyan and a cool color.
Color #2e1a47 contains mainly BLUE color, considered a dark pastel violet color.
Color #40c1ac contains mainly GREEN color, also considered cyan and a cool color.
Color #1F2A44 contains mainly BLUE color, considered a very dark desaturated blue.

Also an interactive map illustrates the top colors making an impact in 20 countries around the world. 
Thanks to Jenn for sending in the link!
Thursday
Jan072016

Three Simple Resolutions to Design Better DataViz

Welcome back to the office! You’re back to work in the new year with energy and ambitions of doing better work than you’ve ever done before. Very quickly though, you fall back into the old routine and find yourself making the same charts and the same presentation slides as always. There are tight deadlines, pressure from your boss, and it’s just easier to use the templates.

Let me offer a few simple resolutions that can make your content and business communication significantly better this year.
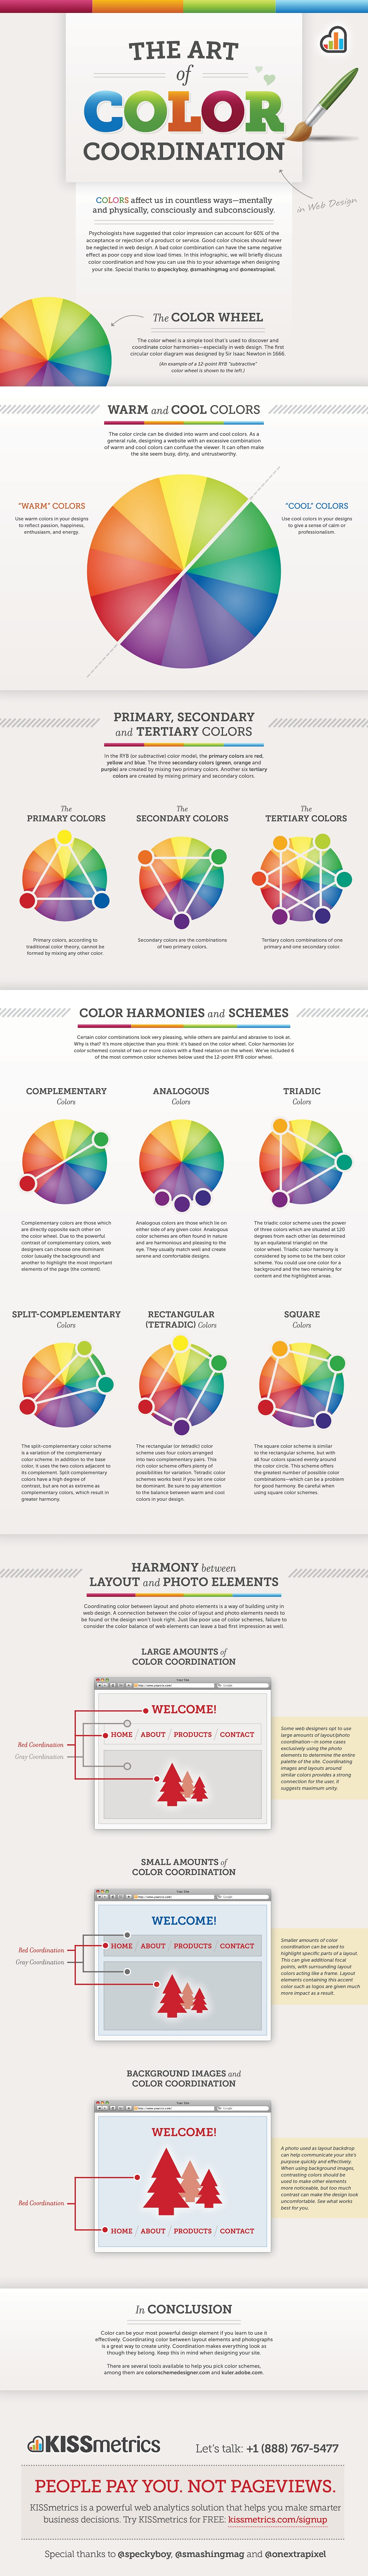
Visualize Your Data

Visuals are so much more powerful than text and numbers. I can’t tell you how many presentations and infographics I see from lazy designers that just make the numbers really big.

“Big fonts are NOT data visualizations!”

Picture Superiority Effect infographic

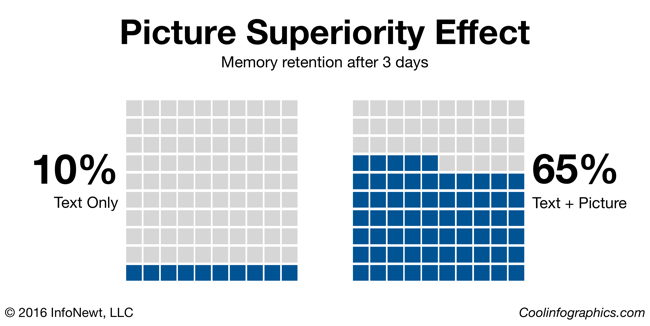
Our brains process visual information faster and more easily than text, and visual information is 650% more likely to be remembered by your audience than text alone (Brain Rules, John Medina, 2009). If you want to communicate a clear message, and you want your audience to remember that message, make it visual.

Visualize Your Data infographic

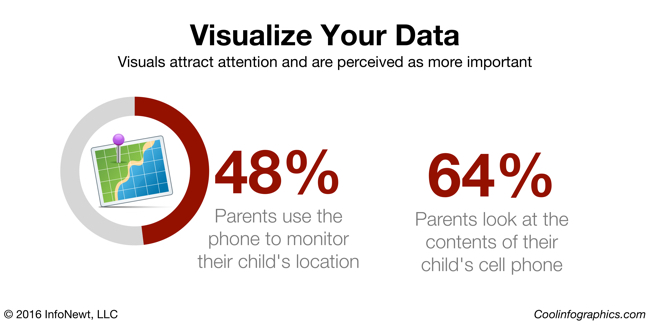
Look at these two statistics. They could be on a presentation slide, in a report, or included in an infographic. Your eye is drawn to the visualized number on the left, with both a doughnut chart and an illustration of the concept of GPS location. You as the reader are more likely to remember that statistic on the left than the number on the right, which just shows the stat in a big font size.

Remove Chart Legends

It’s frustrating that the most popular charting software in the world, Microsoft Office, always includes a chart legend by default. The “tyranny of the default” is that most designers will just accept it, and not improve their charts. It’s your responsibility as the dataviz designer to make your charts as easy as possible to understand.

Legends that are separate from the visualization of the data make your readers work much harder, looking back and forth between the data and the legend, to understand your visualization. Make understanding your data visualization much faster and easier by moving the data descriptions into the chart itself, and connected to the actual data.

Remove Chart Legends infographic

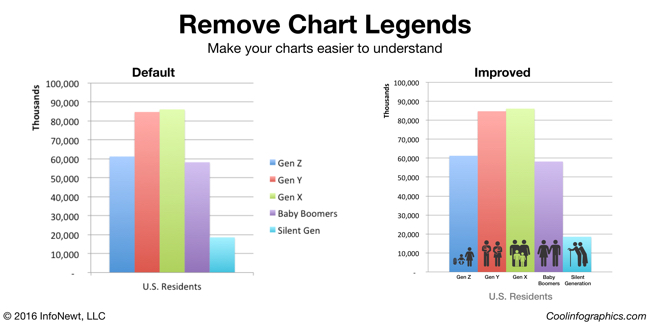
Here you can see the default column chart created by PowerPoint on the left, and an improved version on the right. In this example, I removed the chart legend and added the data descriptions below each column. To add a visual element, I also added stock icons to visually represent the age groups as images on top of the chart. These chart improvements only took 10 minutes to create, and the chart is much easier to read.

Try New Ways to Visualize Your Data

You do want your audience to remember your data, right? You’re trying to help them make better decisions based on your information, and for that to be successful they have to be able to remember your data. Purchase decisions, voting decisions, health decisions, financial decisions, business decisions, and many more are all impacted by the information people have, and can remember.

Breaking out of the Big 3 charts is tough. Bar charts, line charts and pie charts (the Big 3) make up most of the dataviz in the world. However, they can also make your data look like everyone else’s. In order for visuals to be memorable to your audience the visuals need to be unique and different.

Visualizing Percentages infographic

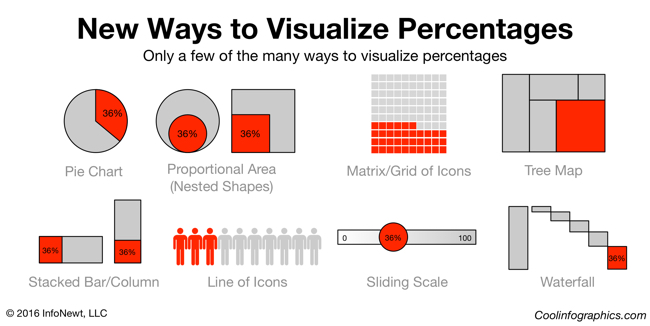
Consider a single percentage statistic: 36%. A percentage is actually two numbers in comparison. Your data value as it compares to 100%. Pie charts are the most common way to visualize a percentage, but there are easily more than 25 different ways to visualize this statistic.

Visit sites these sites to discover new ways to visualize your data:

Design Better DataViz This Year

I ask you to make your own resolution to improve your charts and dataviz designs this year. Start with the three resolutions above, and start communicating data more effectively.

Wednesday
Jan062016

Christmas Quiz: 10 Most Popular Stories

Christmas Quiz: 10 Most Popular Stories infographic

How well do you think you know your Christmas stories? Especially now immediately after the holidays?  Take the Christmas Quiz: 10 Most Popular Stories by Unplag and see how many you can guess right! 

Have you ever resorted to the Internet for Christmas must-do lists? Obviously, this thing can stand you in good stead to timely cope with holiday chores. Aside from stocking stuffers and holiday menus, you need to take care of leisure time activities too. So, why not add a quiz with the most popular Christmas stories to your list? Unplag created the one especially for you! It’s high time to remember the admired plots and characters and find out if you can guess all of them.

The creators of this infographic were quite creative. They told 10 of the most popular Christmas stories with a minimal amount of icons and illustrations! Do you think they choose the right ones? Would you have told the stories differently? Either way, this infographic is a fun holiday quiz to play with family and friends. 

Thanks to Anastasia for sending in the link!

Wednesday
Dec302015

Designing Infographics That Last

The web is inundated with new content on an hourly basis. So much so that it can be hard for any content to stand out. Readers have an attention span shorter than a goldfish! With trending hashtags, sponsored posts and the brevity of posting with fewer than 140 characters, hot trending topics often play a factor in the success of your infographics. But it doesn’t have to. 

While we’re busy flitting from one project to the next, always looking ahead, it’s possible to lose track of our content once it has passed the design phase. But the long-term success of your content relies on more than just good design. I define the Online Lifespan of your infographic as the amount of time it remains relevant to the audience, and it plays a huge role in the measurable success of your content. 

First, you need to determine your project’s goals. What is your goal for this infographic? Are you looking for a short-term boost in traffic? Or are you looking to post content that readers will view and share for years to come? 

Sometimes your infographic works with an online lifespan somewhere in between. For example, the annual “Death & Taxes” poster visualizes the Federal Budget and has a lifespan of a year before its information becomes outdated when a new budget is released.

Death and Taxes poster infographic

SOURCE: Timeplots

If you’re looking for longevity, however, choosing a lasting topic for your content can work to your advantage. Here are just a few of the benefits:

  • More bang for your buck: It essentially costs you the same amount of time and resources to design an infographic with a short online lifespan as it would for a design with a long lifespan. You spend the same amount of time and effort in your design and research, but gain two very different results.
  • Visibility: No one will be searching for the Top 10 Christmas Traditions in 2015 after December 25, 2015, so all of your traffic needs to happen within a short period of time. A longer-lasting way to frame this infographic would be to create a timeline of Christmas traditions over the last few hundred years. Although this isn’t typically “evergreen” content, you’ll see a resurgence of traffic every year around Christmas time. Without a hard end-date, your infographics can live on driving views, backlinks and social shares for years to come.

History of Christmas Traditions infographic

SOURCE: Balsam Hill

  • Less maintenance: Once you’ve created a piece of evergreen content, there’s little to no maintenance necessary to keep your content relevant.

While there are situations where trendy and timely content can work in your favor, creating content with a longer online lifespan can lead to longer lasting success. It all comes down to the topic choice and the type of data.

Selecting your topic is the most important factor in determining the online lifespan of your infographic. Jumping on a breaking news topic is a great way to get your client some quick visibility, but does little to increase its long-term exposure. However, coming up with truly evergreen content like the infographic below will keep your content relevant long after you’ve created it. 

Wine and Food Pairing Chart infographic

SOURCE: Wine Folly

Keep these goals in mind when selecting a topic for your next infographic. A blend of trending topics and evergreen content can build a very robust content strategy.

Wednesday
Dec232015

Old vs. New Graphic Design

The Ultimate Battle- Old vs New- Graphic Design infographic

The New Media Company has created the infographic The Ultimate Battle: Old vs New Graphic Design to explore 8 different aspects of graphic design and compare how the methods have changed through the years.

Are you an old school or a newbie designer?  

If you have ever worked in a Design Studio you will have experienced the constant conflict between “Old” and “New” Design... 

You know the ones: "Quark is better than InDesign", "We didn't have the internet in my day." Here we take a look back at some of the tools that older designers used to use and compare them to todays modern technologies. 

Fun variation on the side-by-side comparison infographic style.

Thanks to Danielle for sending in the link!

Wednesday
Dec022015

10 Things You Need to Know About Logo Design

10 Things You Need to Know About Logo Design infographic

Logos are more than just a stamp on a page, they embody the whole meaning behind your product. The 10 Things You Need to Know About Logo Design infographic from Blue Soda Promo wants to make sure that you make the best decision when choosing your design.

“People are more likely to remember the company logo, an illustration representing the company, than the actual name of the company. When it comes to purchase decisions, consumers are more likely to buy products from familiar companies. When buyers are in a store looking at products on the shelf, they are more likely to choose the products from companies they recognize, and logos are more likely to be remembered. Companies know this, and are very careful to design their product packaging to clearly show the company or brand logo.”

*Excerpt From: Randy Krum. “Cool Infographics.” - bit.ly/CoolInfoBook

There is a nice comical feeling to the infographic that is consistent throughout. It is good to keep consistency when designing all parts of an infographic.

Nike’s swoosh, McDonalds’s golden’s arches, and Apple’s bitten fruit all have one thing in common…

Well, that’s not exactly true as you’ll find out later in this post.

However! What they do share is the overarching success their logos have had on the world. People no longer need to be told what their logos represent. When their logos are stamped on something they have certain consumer expectations attached to it. Their logos became their own company’s spokespeople, while their products continue to prove their worth.

Examples are key for this kind of topic. People will understand the importance of the points better when the examples are clear and easy to recognize. It also helps reinforce the idea that a logo embodies the personality of the company. When the author changes one of the logos we are familiar with, it just doesn't feel right!

Thanks to Matt for sending in the link!

Thursday
Sep242015

Know Your Image Formats Mega Cheat Sheet

Know Your Image Formats Mega Cheat Sheet infographic

Know Your Image Formats Mega Cheat Sheet from Make a Website Hub is helpful when working with image files. You can't just use one image format for all your needs. You need to choose based on your use. Learn how to choose between JPEG, GIF, TIFF, PNG, or BMP.

Not all image formats are created equal. All have different uses and different attributes. Know exactly what image format to use for web use, print, social platforms, logos, and much more with this handy cheat sheet.

Found on http://infographicjournal.com

This is a little more detailed than a similiar infographic I posted on Cool Infographics last year that can be found here: http://www.coolinfographics.com/blog/2014/12/12/when-to-use-jpeg-gif-png-image-file-types.html

Monday
Sep212015

The Art of Color Coordination

The Art of Color Coordination infographic

The Art of Color Coordination infographic from Kissmetrics is a lesson on how to use the color wheel when picking colors to combine. The infographic introduces you to a variety of harmonies and schemes that you can use to your advantage.

Colors affect us in countless ways - mentally and physically, consciously and subconsciously.

Psychologists have suggested that color impression can account for 60% of the acceptance or rejection of a product or service. A bad color combination can have the same negative effect as poor copy and slow load times. In this infographic, we will briefly discuss color coordination and how you can use this to your advantage when designing your site. Special thanks to @speckboy, @smashingmag and @onextrapixel.

Great intro to choosing colors for a color palette used in web design, infographics, and even presentations. I often talk about these color choice schemes in my workshops and classes.

Thanks to Ray for posting the link!

Friday
Sep112015

RGB vs CMYK

RGB vs CMYK infographic

RGB vs CMYK infographic from Card Printing explores the differences between the two color modes. Your use of the finished product determines which color mode you should choose. RGB is the best choice when it comes to digital uses, and CMYK is perfect for printed products!

CardPrinting.us presents an infographic weighing the pros and cons of using both RGB versus CMYK color codes in the printing process.

Colorful and informative in equal measures, the infographic is divided in sections detailing the identifiers, stats, arsenal, strengths, weakness, and the verdict for each spectrum. RGB (red, green, blue) is at the right side, and CYMK (cyan, magenta, yellow, black) is at the left. Graphics and text make the infographic easy enough to understand even for those who aren’t well versed in color spectrum and printing process.

Reading through the infographic can help clients and artists decide on which works best for them, especially since the arsenal section lists down the tools and media suitable for both RGB and CMYK. As well, they can get tips from the strengths and weakness sections, plus the final verdict which states that as far as the digital realm is concerned, RGB wins while CMYK is tops in print form.

Nice simple comparison that uses the side-by-side format to explain the basic differences between the color modes. Perfect to send to that manager or executive that has no idea what you're talking about!

The infographic should have visualized the stats, like the difference in the number of colors. Also the direct URL to the infographic landing page should be included in the footer.

Found on Downgraf

Tuesday
Sep082015

DataViz & Infographics Fall Course at SMU CAPE

Cool Infographics Course at SMU

Infographics & Data Visualization Design

September 24-November 12, 2015 | 6pm-9pm Thursday Evenings | SMU CAPE Plano Campus | $595

$75 off discount code for Cool Infographics readers: RK215

This Fall, I will again be teaching a course as part of the CAPE program (Continuing and Professional Education). This time the course will be at a new location at the SMU Plano Campus. This is a very hands-on course where participants will start to develop better charts, infographics and your own infographic resume. Topics include:

  • The art and science of data visualization and infographics
  • The data visualization and infographics design process
  • Data analytics and basic statistics for the designer
  • Different chart types, dashboards and graphing options
  • How to use the various software and online tools readily available and when to use them
  • Strategies for publishing and promoting infographics online
  • Understanding IP, trademark and copyright issues and how they relate to infographics
  • And more...

Please share with anyone in the Dallas area, or join the class yourself. Enrollment is very limited, so register quickly!

Click Here to learn more: bit.ly/SMU-DataViz-Plano


Also check out the DFW Data Visualization & Infographics Meetup group with monthly speakers and events in the Dallas-Fort Worth area!