About
Randy Krum
President of InfoNewt.
Data Visualization and Infographic Design

Infographic Design

Infographics Design | Presentations
Consulting | Data Visualizations

DFW DataViz Meetup

Join the DFW Data Visualization and Infographics Meetup Group if you're in the Dallas/Fort Worth area!

Search the Cool Infographics site

Custom Search

Subscriptions:


Feedburner

The Cool Infographics® Gallery:

How to add the
Cool Infographics button to your:

Cool Infographics iOS icon

- iPhone
- iPad
- iPod Touch


Read on Flipboard for iPad and iPhone

Featured in the Tech & Science category

Flipboard icon

Twitter Feed
From the Bookstore

Caffeine Poster

The Caffeine Poster infographic

Entries in money (137)

Thursday
Jun112015

UK Tax Burden Infographic Video

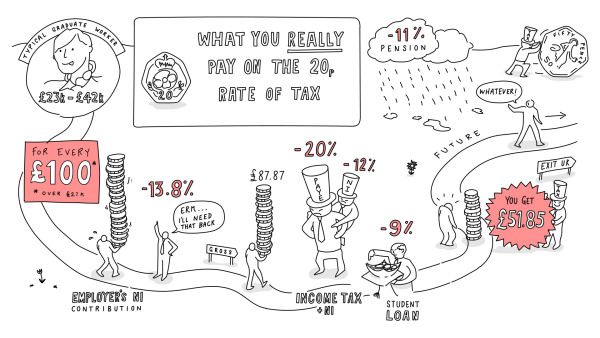
The UK Tax video, posted on Youtube by See What You Mean, explains how much money you actually receive after taxes in the UK. Below is the final infographic.

UK Tax Burden Infographic Video

The tax and deductions on your job are much higher than you might think. The Government likes to talk about a ‘20p rate’ – as if that’s all you pay. But actually, for a typical middle income graduate, total deductions are more than 48p in every pound earned (over the £21k threshold). And will rise to nearly 60p when the statutory pension scheme comes in by 2018.

What will it do for the incentive to work and do better, and to the UK’s general prosperity, when graduates only get 40% of any extra they earn?
Against this backdrop some politicians still talk of increasing the taxes on these middle earners.

This is a great example of using the hand-drawn style of design for infographics. Often used for graphic recording of events and meetings, the hand-drawn style has the look of someone just drawing on a whiteboard.

Video infographics tells stories in a very linear way, and in this case the visual metaphor of a road builds on that linear storyline even more. The drawing continues to build and reveal more information as the video progresses, and the viewer can see the overall design coming together.

I say this often, but I'll say it again. "Big numbers are not data visualizations." Visualizations can help the audience by showing the taxes percentages as taking their portion of a person's total salary. Just showing the text number of the percentages, doesn't help the viewers understand how large that tax burden is to them.

Thanks to Richard for sending in the link!

Thursday
Apr022015

The True Cost of a Bad Hire

The True Cost of a Bad Hire infographic

The True Cost of a Bad Hire infographic from Executives Online in the UK puts into perspective the £4.13 billion a year that UK businesses are losing from a bad hire. With one £50 note being less than 1 mm thick, the stack would reach about 933 meters tall. London’s Big Ben is 96 meters tall.

People are a businesses most valuable resource. Actively finding and attracting top talent is a never-ending task for any company that aspires to be the best.

The amount of new hires that don’t work out is frightening – in fact a study by leadership IQ across a range of industries and job roles found that up to 48% of new hires fail within 18 months. It’s a problem that’s estimated to cost UK businesses over £4 billion a year.

So What’s The True Cost When One Of These New Hires Doesn’t Work Out? 

Outside of the obvious salary cost, there are a significant number of tangible and intangible factors that can drive the cost of a failed hire much higher than initially estimated. 

We used an example of a £100k per annum executive to answer one question: “What’s the true cost of a bad executive hire?” We factored in salary, benefits, the cost of the recruitment and sourcing process, and the knock on effects of having a poor performing individual in a role for up to a year.

Using data from a range of external sources and our own databases we arrived at a final figure showing this cost to be around three and a half times more than a year’s salary. To demonstrate the scale of this cost we laid it all out in a infographic as well as breaking down how that cost was arrived at.

So Why Do Bad Hires Happen?

Part of this failure to make successful hires is down to company policies focussing on hiring cost rather than ROI.

As Steve Jobs put it: “A small team of A+ players can run circles around a giant team of B and C payers… I’ve noticed that the dynamic range between what an average person could accomplish and what the best person could accomplish was 50 or 100 to 1”.

Next time you’re making an executive hire, remember what it will cost if it doesn’t work out! 

It’s a long/tall infographic design, but I think that the length is actually part of the visual story in this case.

Visually, the grids would be easier for readers to understand if the rows were 10 icons across instead of 20. We live in a Base-10 society. Rows of only 10 would make the infographic twice as long, but an alternative would be to add some spacing to visually separate the left 10 from the right 10. Same thought for vertical spacing. It would help to have a gap in the icon grids every 10 rows.

The confusing part is that every icon is a £50 note, so with 20 icons, each row represents an even £1,000. That’s why I think they designed the rows to be 20 icons across.

Odd that they published the infographic as a transparent PNG file.

Thanks to Alex for sending in the link!

Friday
Aug292014

False Visualizations: Sizing Circles in Infographics

Accuracy is the most important aspect of an infographic design!

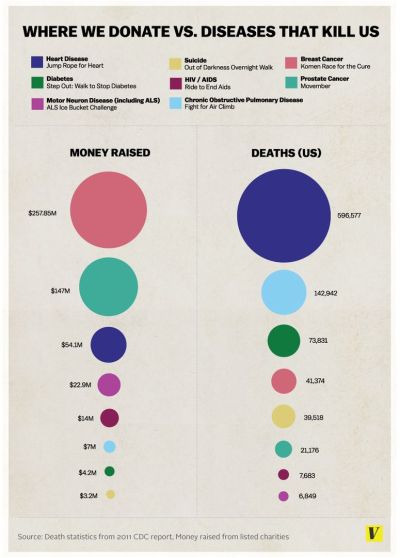
Last week, the article The Truth about the Ice Bucket Challenge by Julia Belluz on Vox Media included the infographic, Where We Donate vs. Diseases That Kill Us, that used proportionally sized circles as its data visualization. The problem with this design is that the circle sizes don’t match the values shown. This is a false visualization and significantly over exaggerates the smaller amounts of money contributed to each charity and the deaths attributed to each cause.

This causes problems because readers often just look at the visuals without reading the actual numbers. They start with the assumption that a visualization accurately represents the data. The Vox Media story and infographic already have over 12,000 shares on Facebook, and this is a great case study for designers to understand how important it is to visualize data accurately.

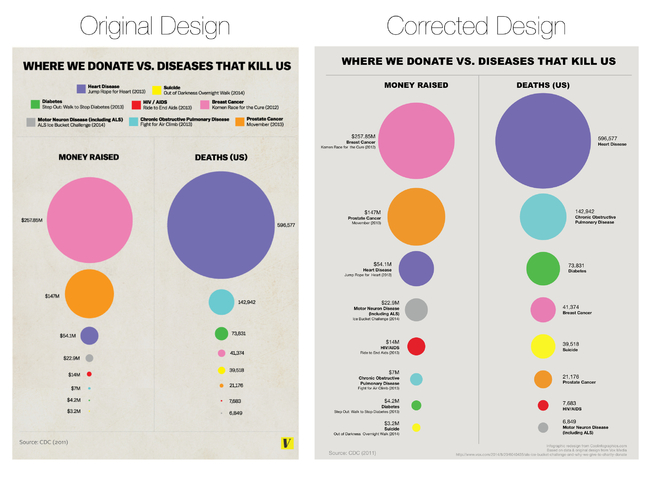
As readers, we see the area of two-dimensional shapes on the page to represent the different values, but design software only allows width and height adjustments to size shapes. Designers make the mistake of adjusting the diameter of circles to match the data instead of the area, which incorrectly sizes the circles dramatically. It takes some geometry calculations in a spreadsheet to find the areas and then calculate the appropriate diameters for each circle. To demonstrate, I created this corrected version of the infographic.
False Visualizations: Sizing Circles in Infographics Revised

My Google Docs spreadsheet of the correct circle area and diameter calculations is available here.

Assuming this was a design mistake, and there was no intent to deceive the audience, this is a common mistake that many designers make.  So many designers, that I included an entire section on this topic in the Cool Infographics book to help designers understand how to size the area of circles.

I made one other improvement to the corrected design above by removing the color legend and listing the charities and causes of death right next to the appropriate circles. This makes the whole visualization easier for the audience to read by eliminating the need to look back-and-forth from the circles to the color legend to figure out what each circle represents.  Placing the text next to each circle keeps the information in the reader’s field of view which minimizes eye movement.

Sticking with the circles data visualization style, I wanted to take the design a little bit further. I would recommend one of two alternate improvements.  First, adding colored connecting lines is one way to make it easier for the audience to find the related circles in the columns sorted in descending order.
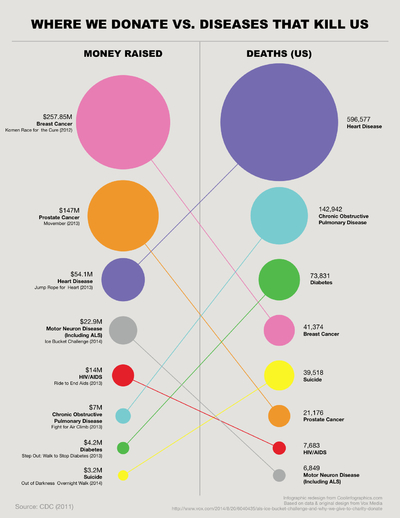
False Visualizations: Sizing Circles in Infographics Revised Lines

A second alternative would be to sort the lists to line up the related circles.  This makes it much easier for the audience to see the direct comparisons between charitable contributions and death rates related to the same cause.
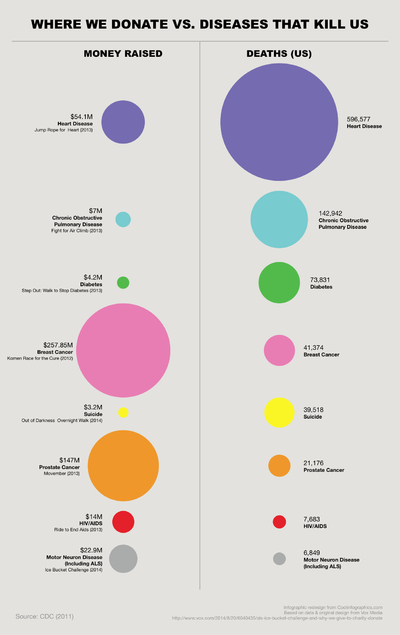
False Visualizations: Sizing Circles in Infographics Revised Descending Sort

I’m passing over any discussion about whether using proportionally sized circles (a bubble chart) is the best visualization method for this data. If a designer makes the choice to use sized shapes, my point is that the data visualizations in the infographic must match the numbers using area.  David Mendoza published a good analysis worth reading and designed an alternative way to visualize the data in his article, This Bubble Chart Is Killing Me.

How else would you improve this design?

NOTE: I was able to contact the designer who created the infographic at Vox Media, and he had already realized his error after the infographic had been published. As I had guessed, he had mistakenly adjusted the diameter of the circles instead of the area. He told me that he’s working on updating the official infographic design in the article, but it hasn’t been published on the Vox Media site yet.


Thursday
Aug212014

Missing Money

Missing Money Infographic

It is no secret that the U.S. is deep in debt. But something you might not know is how much money the U.S. can’t find. The Missing Money infographic from Masters in Accounting covers multiple instances where huge amounts of money are unaccounted for.

With a national debt approaching $17 trillion, Uncle Sam is tightening his belt and looking under the cushions for extra change. But a closer look at his pocket book reveals just how little he knows about where your money is going. Below are a few examples that will make you think twice about Uncle Sam’s accounting skills.

This infographic shares some bold accusations, all meant to be shocking to the readers.  The sources are clearly cited in the footer, but in this case I would recommend including each source along with the claim in the infographic.  The publisher isn’t making any of these claims themselves, just sharing the claims from others, and that should be made clearer to the audience.  It would also be easier for the audience to follow the source link, and learn more about any particualr claim.

The first chart showing the annual increase in the U.S. Debt caused by the budget deficit should show the deficit amount at the bottom of each column instead of the top.  That would visually show that the deficit is the cause of the growing debt from one year to the next by placing it at the end of the column where the heights are different.

Thanks to Merrill for sending in the link!

Wednesday
Jun042014

How to Buy a Used Car: 12 Things You Didn’t Know About Car Buying


How to Buy a Used Car: 12 Things You Didn’t Know About Car Buying infographic

For some buying a used car is fun, for others troublesome. The How to Buy a Used Car: 12 Things You Didn’t Know About Car Buying infographic from Toyota Certified gives some interesting facts and tips on buying a used car.

Whether you’re in the market for a family SUV, or a sporty little two-seater just for you, buying a used car is something that most of us do at least once in a lifetime. Toyota recently did a fascinating survey that outlines 12 Things You Didn’t Know About Car Buying and found that 26% of us find the experience fun and interesting… and 52% of buyers have no idea what model they want until they step into the dealership! Check out this fun infographic that takes a closer look at America’s car buying experience and you may discover some interesting facts you didn’t know… and some helpful tips about buying your next used vehicle, as well.

Good design, and I love that Toyota Certified (the used car division of Toyota) is sharing some of their internal customer information publicly.  They definitely need to do a better job citing the sources of the data, but some of these statistics are clearly based on Toyota sales numbers.  Others like the “Top Brand Loyalty” that shows Toyota as #1 are suspect because no source is listed.

A few of the percentage statistics could be better visualized.  A percentage is always comparing the statistical value to the total possible of 100%.   So numbers like “53% of buyers prefer their first dealer interaction to be online” should be shown as a stacked bar totaling 100%.  Others like “80% of people used the Internet in their car research” weren’t visualized at all, which makes them feel less important and secondary information to the audience.

Data visualization errors like the doughnut chart of the “Most Popular Colors” just hurt the brand credibility.  You can’t have a pie chart or a doughnut chart that only adds up to 88%.  They must total 100%!

Thanks to Belinda for sending in the link!

Tuesday
Jun032014

What the Heck is a Bitcoin

What the Heck is a Bitcoin infographic

The Bitcoin is the first widely traded digital crypto-currency that is decentralized and unregulated. Find out more from the What the Heck is a Bitcoin infographic by SumAll.

Exchanges rising and falling, disputes over inventorship, wild accusations, rapid inflation and deflation, anger, confusion, and sadness. We’re talking about everyone’s favorite unicorn money: Bitcoin. Bitcoin’s six year road to the spotlight has been fraught with more turbulence than a flight through a hurricane in a Learjet, and since mid 2013 it’s only gotten more crazy.

SumAll has just added bitcoin exchanges, mining pools, and mining workers to our range of data platforms to allow our customers to keep tabs on the market and the progress of mining pools. For those who own or mine bitcoins, SumAll is now their one-stop-shop for keeping tabs on all things bitcoin, monitoring their mining efforts, and keeping a close watch over their investments.

For those who don’t own or mine bitcoins, chances are you have no idea what we’re talking about.

If you have an interest in bitcoins and don’t want to be that out-of-the-loop guy at the party who just keeps nodding his head in agreement and staring at your drink, we made this handy infographic to explain a few basic concepts to get you started. Soon you’ll be buying all your pizza–and rent–with bitcoins

Good design that tells a story to the audience, but this one uses too much text.  I wish they had included some data visualizations about the difficulty to mine bitcoins or the strength of the encryption.  The one dataset they did visualize was the value of bitcoins from Jan-Dec 2013.  The value changes so rapidly, including that one data visualization can quickly make the infographic feel old and out-of-date.  For a longer Online Lifespan, the design should focus more on the long-term, consistent information about bitcoins and not the most recent trending data.

This is a good example of the company, SumAll, using an infographic as part of their email marketing campaign.  The infographic was included as the highlight in one of their email blasts to customers with a link back to the full design on their website!

Friday
May302014

Reading Rainbow's Kickstarter Project

Reading Rainbow's Kickstarter Project infographic

Bring Reading Rainbow Back for Every Child, Everywhere.

LeVar Burton has a fantastic Kickstarter project running to bring back Reading Rainbow to make it available on multiple internet connected platforms and free to classrooms in need.  The team is using multiple infographics to help explain the project and the support the funding campaign goal of raising $5,000,000.

Hi. LeVar Burton here. You may know me as Kunta Kinte, from ROOTS, or Geordi La Forge, from Star Trek: The Next Generation. 

You also may have grown up with me on Reading Rainbow. 

It was my mother who taught me that, by picking up a book, I could “go anywhere” and “be anything.” Ever since Reading Rainbow began in 1983, I have dedicated myself to fostering a love of reading in children, just as my mother did for me. 

Over the past year, I have watched Kickstarter bring communities together to support artists and inventors. Again and again, I have been inspired by watching like-minded people team up to accomplish impossible dreams, and to change the world. 

Now, I am hoping you will join me on my mission: to bring Reading Rainbow back for every child, everywhere.

The infographic design above could be improved with the knowledge that people may share the infographic image without the rest of the text and information from the kickstarter page.  It should be able to stand alone as an independent asset with a title, and the URL for readers to find their way back to the original infographic on the Kickstarter campaign landing page. 

The visualizations help make a huge amount of information about the project easily accessible and understandable to the audience.  Take for example this simple illustration of the platforms they would like to reach.  Visualizing the multiple devices and operating systems makes the goal super easy to understand.

Reading Rainbow's Kickstarter Project platforms

I think this is an incredibly worthy project, and I hope you join me in contributing:

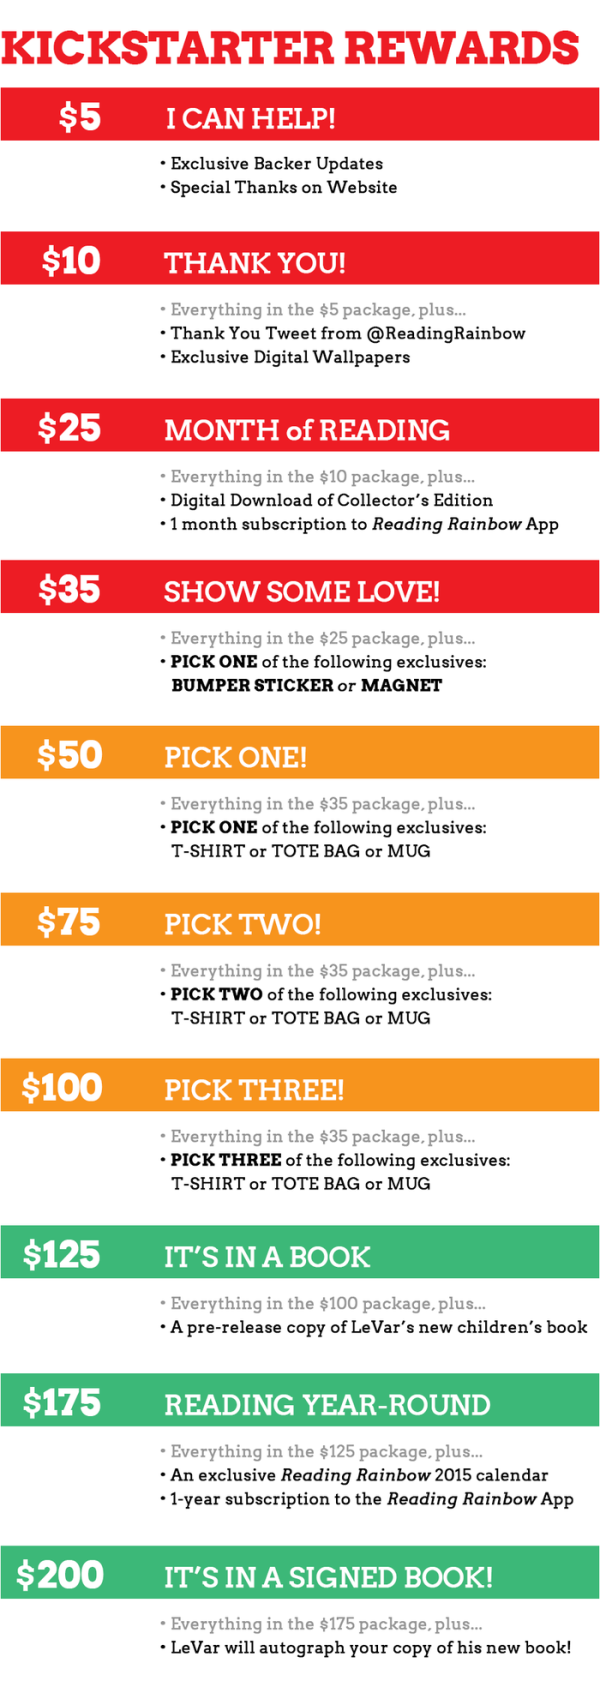
The way Kickstarter works, contributors at different gift amount levels can earn different types of swag merchandise and benefits.  This project is particularly complicated with 24 different funding levels with different swag.  Although mostly text, the visual lists of funding levels help potential contributors choose their amounts.  However, visualizing the swag and benefits with illustrations, icons or photos would have been more helpful.

Reading Rainbow's Kickstarter Project rewards

Infographics for the higher levels of contributions and rewards included images, but simple icons for bumper stickers and coffee mugs would make the first list easier to understand.

Reading Rainbow's Kickstarter Project Limited rewards

Infographics have helped make the campaign a huge success, and also made it easier for people to share through social media.

Friday
Apr112014

Color, Value, and Evolution of Logos

Color, Value, and Evolution of Logos infographic

Logos are very important to a business. A good logo can sell itself, especially if the colors match the product correctly. Color, Value, and Evolution of Logos infographic found on Finances Online.

Do you know how colors influence your buying decisions? Why the charging bulls in the Red Bull logo are red? Or why McDonald’s double arches are yellow? It’s because the emotional power of logos is closely tied to specific colors.

It turns out, our emotions are results of the precise science of effective logo design. In fact, psychologists proved that famous logos are so wired into our brains, that at the age of 2 kids can already link a product with its logo in 67% of cases. You can find even more interesting facts about logos in our latest 

The meaning behind logo colors is always a popular infographic topic, and you can see some prior posts here.  This design goes a bit further by also looking at brand values, the cost to design some of the more famous logos and how some logos have evolved over the years. 

Some portions of the design are too visually busy, and hard for the reader to follow.  Too many different fonts makes the information hard to read, and too much text detracts from the appeal of the visuals.  However, showing the actual logo images is key to sharing this information, and they do a good job of including relevant examples.

I really like that they added a few “Tweetable Facts and Figures” on the landing page below the infographic to help encourage readers to share the infographic.  They even have convenient “Tweet This” links that will fill in the Twitter post with the text for the user. 

Thanks to Alex for sending in the link!

Tuesday
Apr082014

Where Does Your Money Go When You Die?

Where Does Your Money Go When You Die? infographic

Do you know what happens to your assets once you die? Gorman & Jones has created a flow chart infographic to answer the question, Where Does Your Money Go When You Die? If you have a Will, no worries! If you don’t, maybe this flow chart will convince you to write one once you see who will inherit your things!

For many people, the concept of death and the consequences for those we leave behind is scary. While dwelling on this subject can be unpleasant, it’s important to know that your family is going to be taken care of when you die. Do you know where your money is going? To get a better idea of what happens to our assets when we pass on, here is a guide to help answer the question, “Where Does Your Money Go When You Die?”.

What a great, informative topic for a law firm that covers estate law.  I wish the different splits of the estate were visualized, but overall a good topic and design.

I like that the design company is given credit in the footer, but it’s missing the URL to the infographic landing page.  The link to the Gorman & Jones home page is fine, but there aren’t any links to the infographic there, so it doesn’t help readers find the original, full-size infographic.

Thanks to Andrew for sending in the link!

Monday
Apr072014

Women and Fashion In the Digital Age

Women and Fashion: In the Digital Age infographic

The Women and Fashion In the Digital Age infographic from Digital Surgeons breaks down how much a women spends on each item. This infographic also creates categories for each woman based on her style sense. 

A household CPO (Chief Purchasing Officer), women dictate trends across fashion and media. Let’s take a look at where she’s spending her time & money.

Good data and simple graphics that add context to the numbers.  Love the icons and silhouettes and the minimal color palette.  Simple character illustrations like these keep the focus on the data, and not the illustrations.  However, there are two major infographic design lessons that can be learned form this design.

First, shading portions of odd shapes is always tricky, so in this design the shaded shopping bags and bottles don’t actually match the data.  The reader’s eye sees the area of the colored shapes, and this is usually straightforward when working with basic shapes like rectangles and circles.  However, even with simple circles, the designer can’t just calculate the height of shaded regions like a bar chart.  That only works with rectangles, because the area is directly proportional to the height.  The math to calculate the correct area of a circle segment requires a little more math from geometry.  There’s no clear formula to calculate the area of a wine bottle or a shopping bag, so the designer had to take their best guess.

Second, big fonts are not data visualizations!  I hate to see values on an infographic that aren’t visualized.  They provide no context for the readers, and are perceived as less important than the numbers that are visualized.  The job of a good infographic is to make information easier to understand, not just to share information.  Even simple bars under each component of a woman’s outfit in the first section would have helps make the data meaningful to the audience.

You won’t find a link to this infographic on the Digital Surgeons home page, so the infographic image file itself should include the URL back to the landing page in text.  That way readers that see this infographic on other sites can make their way back to the original, full-size version.  Many sites that post infographics, don’t link back to the original like I do.  Don’t make it hard for your audience to find your infographic!

Thanks to Peter for sending in the link!