About
Randy Krum
President of InfoNewt.
Data Visualization and Infographic Design

Infographic Design

Infographics Design | Presentations
Consulting | Data Visualizations

DFW DataViz Meetup

Join the DFW Data Visualization and Infographics Meetup Group if you're in the Dallas/Fort Worth area!

Search the Cool Infographics site

Custom Search

Subscriptions:


Feedburner

The Cool Infographics® Gallery:

How to add the
Cool Infographics button to your:

Cool Infographics iOS icon

- iPhone
- iPad
- iPod Touch


Read on Flipboard for iPad and iPhone

Featured in the Tech & Science category

Flipboard icon

Twitter Feed
From the Bookstore

Caffeine Poster

The Caffeine Poster infographic

Entries in emissions (13)

Tuesday
Dec082015

The Global Carbon Budget 2015

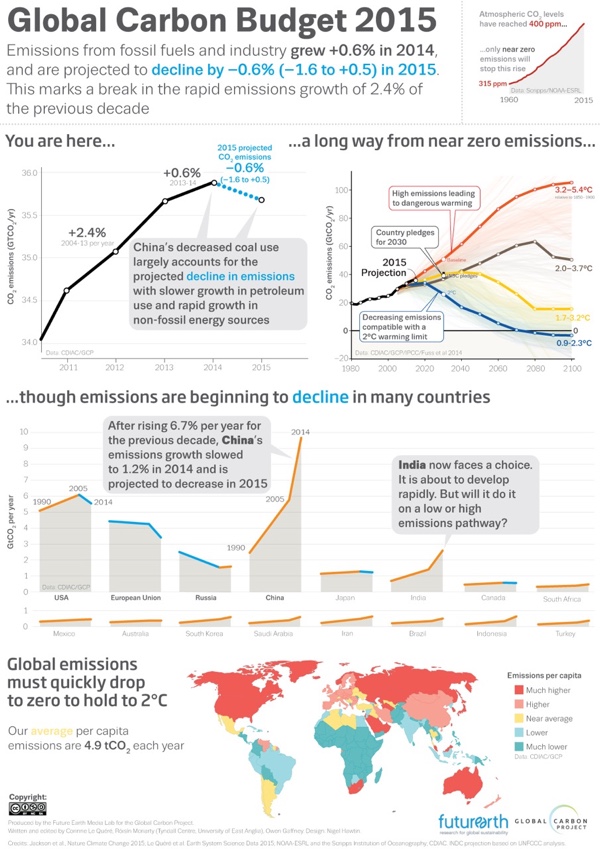
The Global Carbon Budget 2015 infographic

The Global Carbon Budget 2015 full report and infographic have just been released this week.

You can also download the infographic as a HiRes JPG or PDF

Emissions from fossil fuels and industry grew 0.6% in 2014 and are projected to decline by -0.6% in 2015. This marks a break in the rapid emissions growth of 2.4% the previous decade.

The great infographic was designed by Nigel Hawtin working with Owen Gaffney at the Future Earth Media Lab for the Global Carbon Project. 

Designers can learn from Nigel's careful use of color to clearly highlight the stories in the data, and use of black and gray for all of the reference data. Clear Creative Commons license, and each section can be broken apart to easily post on Twitter and in social media.
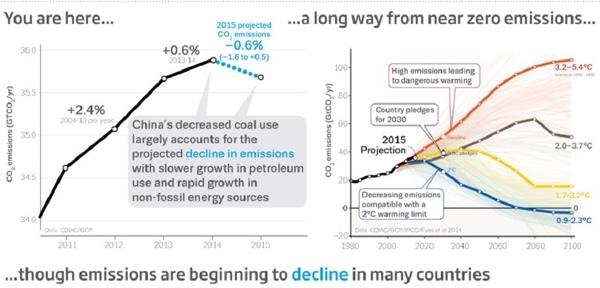
Because the infographic will be shared as a stand-alone piece on the Internet (without the full report or surrounding text) it's missing the URL to the full report. The URL text should be included in the actual infographic JPG image so readers can find their way back to the original full-size version on the publisher's site.

Wednesday
Sep022009

Surface Area Required to Power the World with Solar Power


From LandArtGenerator.org, a world map visualizing the surface area required to power the world's electricity requirements using solar power alone in 2030, using current solar panel technology.  It's getting a lot of traffic on digg, reddit and Twitter too.

Also, check out the same idea, but for off shore wind power.

Monday
May042009

50 Cars or 1 Bus? Infographic Advertising!

Great visual ad by Flygbussarna in Sweden!  Combining a physical construction of a bus made out of cars on the side of the road, a live webcam, and live infographic information on the website!

Every day thousands of cars are driven to and from Swedish airports. Every car holds only 1,2 persons on average which is to be compared with the Airport Coach that takes over 50. Needless to say, this makes no sense whatsoever from an environmental standpoint. To highlight this, an enormous bus was built out of 50 cars on the side of the highway to the airport. On the website, a live camera not only shows the installation 24/7 but also analyses the image and tracks each and every car going by. This data is then being used to highlight just how much emission we could save just by going by bus instead.

 Thanks to @yplim on Twitter!


Wednesday
Apr152009

GE: Plug into the Smart Grid


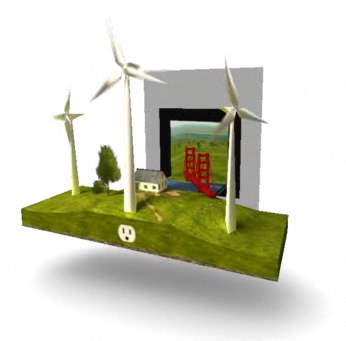
Great interactive infographic website from GE for their Plug Into The Smart Grid ad campaign.  Beautiful graphics, fast, clean interface and all-around good job.  The viewer can change the setting, and see the infographic results change in response.

My son loves the Augmented Reality part!  Not really infographic, but fun.

Friday
Mar062009

Ford's New Green HUD Designs


Ford is working with design firms to develop concepts for a new HUD for its hybrid and future all-electric cars.  Here's the article from BusinessWeek.

Found on Twitter from Mitul69

Thursday
Oct092008

Watercube, The Book


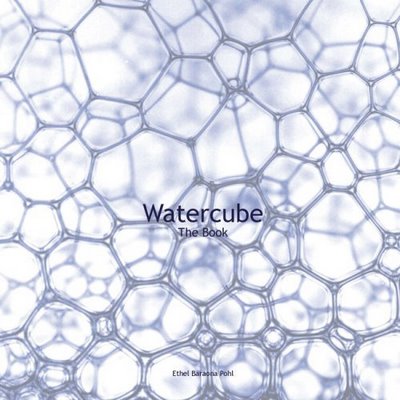
Watercube, is a new book by Ethel Baraona Pohl.  The book is about the National Aquatics Centre built in Beijing for the 2008 Olympics, and has some cool infographics inside.  Some of the graphics were contributed by architect César Reyes Nájera.  A review of the book can be found here on www.v2com.biz
WATERCUBE: The Book is a complete monographic publication about the National Swimming Center for the Beijing Olympics 2008. With an exhaustive description about the Watercube we present a detailed study of the project. The book makes an holistic approach to the project that starts with a brief description of urban and social changes that China has been experienced in the last decade. These facts have encouraged the construction boom that made possible these kind of projects occur in cities like Beijing.

 
This page compared the amount of steel used to built the Watercube to some of the most well known buildings around the world.
This page shows a comparison to the same set of buildings around the world, but shows the tons of CO2 produced due to the steel used in their construction.


This page is one of the years of the timeline leading up to the construction of the Watercube.

Here you can buy Watercube, by Ethel Baraona Pohl, on Amazon.com.

Special thanks to Ethel for sharing the images from her book, and allowing me to post them on Cool Infographics!

Friday
Sep262008

The Rush to Wind Farms!


The rush to wind farming is an interesting article in The Atlantic.  With Federal subsidies, its almost like a land rush.  The planned expansion of wind farm sites is impressive.

Thanks for sending in the link Garrett (also posted on Capturing Ephemera)!

Friday
Aug222008

Beijing Air Quality Index


NYTimes.com is also tracking the Air Quality Index by day during the Olympics using a heatmap style graphic.  There's definitely more pollution and particles in the air than most of the participants are used to.  So far, there have been a couple of days in the 90's, but didn't cross over 100 into the "unhealthy" range.

Thursday
Apr242008

Visualizing Carbon Dioxide Emissions

This is a great way to visualize gas emissions which are normally invisible. That's why most people don't have any real sense how much is produced by the things you do in everyday life like running your washing machine or refrigerator.

The black balloons really work, with the black color implying "bad" and they're actually filled with a lighter than air gas that rises into the atmosphere. I'm assuming that the size of the balloons actually represents the 50 grams of greenhouse gas discussed in the ad.

Found on infosthetics.com and radar.oreilly.com and the original is at www.saveenergy.vic.gov.au from the Australian government.

Monday
Feb182008

GE Ecomagination Blueprint Ads

GE is running The Blueprint Series of five print ads combining photos with an overlay of infographics. This works really nicely because they kept the infographics relatively simple.

Found on notcot.com.